 Kangli Xiang
 Nan Zheng1
 Wei Gao
94% of researchers rate our articles as excellent or good
Learn more about the work of our research integrity team to safeguard the quality of each article we publish.
Find out more
ORIGINAL RESEARCH article
Front. Energy Res. , 04 August 2022
Sec. Sustainable Energy Systems
Volume 10 - 2022 | https://doi.org/10.3389/fenrg.2022.948893
This article is part of the Research Topic Interactions Between China’s National Emissions Trading Scheme and Electricity Market: Practices and Policies View all 27 articles
With the introduction of “dual carbon” goals of “peaking its carbon emissions before 2030 and achieving carbon neutrality by 2060" and the gradual promotion of the carbon trading market, it is the main trend to achieve low-carbon and clean development in the future. It is of great practical significance to effectively measure the low-carbon development level and conduct obstacle degree analysis. Based on this, this article aims to investigate the low-carbon development level index of Fujian province from 2006 to 2019 by using the entropy weight TOPSIS model. Then, the key influencing factors are explored by using the obstacle degree model. The results show that the low-carbon development level index of Fujian province shows a fluctuating upward trend, rising from 0.164 in 2006 to 0.803 in 2019. The environmental system has always been an important factor affecting the low-carbon development in Fujian province, with an average annual obstacle degree of 46.52%, but the impact of the other three subsystems is also gradually increasing. Green innovation, energy conservation, air pollution, economic development, and environmental governance are the top five indexes with the highest annual obstacles. Based on the previous results, this article puts forward corresponding policy recommendations, which provide theoretical support for the low-carbon development of Fujian province.
With the deepening of economic globalization and increasing demand for energy, the extensive consumption of fossil fuels far exceeds Earth’s absorptive capacity, resulting in excessive carbon emissions (Cheng and Yao, 2021). This problem has become an important issue of common concern to all countries in the world (Murshed et al., 2022). In order to alleviate the pressure of global carbon emissions, China has pledged to achieve “dual carbon” goals of “peaking its carbon emissions before 2030 and achieving carbon neutrality by 2060." The “dual carbon” goals also mean that China will accelerate the process of carbon market development, energy system transformation, and other related fields.
Before the “dual carbon” goals were introduced, China had had a corresponding policy system for carbon emissions. On the one hand, top-level design has made remarkable achievements in promoting China’s environmental protection. The implementation of “The 12th Five-Year Plan for Energy Saving and Emission Reduction” and “The 13th Five-Year Comprehensive Energy Conservation and Emission Reduction Work Plan” not only strengthens China’s efforts to reduce carbon emissions but also charters a clear path for low-carbon development in the future. The policies all indicate that we need to pay close attention to the development of low-carbon technologies and carbon emissions control in key areas (Lin et al., 2021). On the other hand, the market-oriented incentive policy has also played an important role (Pan et al., 2022). The relevant policies regulated by the government guide the green development of China’s economy, manifested in using fiscal means to provide financial support to energy-saving and emission-reduction related industries and purchasing energy-saving and environmental-friendly products. In addition, to promote the overall low-carbon transition of the industrial structure, high taxes are imposed on energy-intensive and emission-intensive industries, while subsidies are given to industries with low emission and low-energy consumption through tax subsidies and other means. Most importantly, the operation of China’s national carbon market has also effectively regulated China’s carbon emissions through market regulation. In 2013, China’s carbon emission trading was officially launched in eight pilot projects including Beijing, Shanghai, Guangdong province, and Fujian province. After 7 years of trials, China launched its national carbon emissions trading market in 2021. Therefore, China has completed the market construction of using market forces to regulate carbon emissions (Gu et al., 2022).
Among the pilot provinces and cities, Fujian province, as an important node of “the Belt and Road Initiative,” vigorously builds the pilot zone of the 21st Century Maritime Silk Road and pilot free trade zone, which promotes rapid economic development with its GDP growth rate far exceeding the national average level. More importantly, as one of the first batch of pilot provinces of China’s carbon market, Fujian province has already laid a solid foundation for development and has formed a relatively complete system of energy conservation and emissions reduction. In addition, from the energy structure of Fujian province, the fossil energy storage in Fujian province is deficient, and the self-sufficiency rate of primary energy is only 30%, but the clean energy available for development is relatively sufficient. By the end of 2020, the installed capacity of clean energy in the province has reached 36.25 million KW, accounting for 55.87% of the installed capacity of electricity in the province. The proportion of clean energy in primary energy consumption continued to increase. The consumption of fewer fossil fuels and more clean energy in this province is basically in line with the direction of China’s future energy mix adjustment. Therefore, the low-carbon development in Fujian province can, to a certain extent, provide references for China’s future emissions reduction policies and market target formulation. Based on this, combined with the unique energy mix and carbon emissions structure of Fujian province, this article will focus on the low-carbon development level of Fujian province, so as to provide useful references for China’s future low-carbon development and the goals that China’s carbon emission trading market intends to achieve.
Low-carbon development measurement can reflect the low-carbon development level of the target area. For different low-carbon development levels, the government can support low-carbon development by providing a heterogeneous policy system, which can also provide useful references for carbon emission allowances, the carbon emission price, and carbon emission trading in the national carbon market. Therefore, it is of great practical significance to evaluate the low-carbon development level of target areas. Considering that China’s carbon market has been launched and operating at present, which will play a greater role in carbon emission in the future, the literature review will focus on the practical significance of low-carbon development level measurement, the key influencing factors, and measurement methods of low-carbon development level measurement.
First, the practical significance of low-carbon development level measurement. At present, the research on regional low-carbon development level measurement is mainly divided into two aspects. First, the effectiveness of the low-carbon policy. For example, the low-carbon city policy can improve the residents’ green lifestyle (Cheng et al., 2020) and can rely on technological innovation (Song et al., 2020; Du et al., 2021) to improve the total factor production efficiency of cities with a positive spillover effect (Chen and Wang, 2022). The specific strategy is to optimize the industrial structure by accelerating the development of green technology (Cheng et al., 2019). Second, the low-carbon development level of a specific region is quantitatively measured. At present, previous studies have expounded on the measurement of low-carbon development level (Jia et al., 2012; Duan et al., 2016; Wang et al., 2021) and provided corresponding suggestions for further improvement. Therefore, measuring the low-carbon development level can not only study the effectiveness of the corresponding policies but also objectively quantify the low-carbon development level in the target area, thus putting forward targeted advice for further improvement, which is beneficial to further improving the low-carbon development level.
Second, the key influencing factors of low-carbon development level measurement. The measurement of low-carbon development level in the target area needs to be carried out in multi-dimensions, and the basic characteristics of the evaluation area should also be paid attention to. Taking low-carbon cities as an example, in the process of investigating low-carbon cities, attention should be paid to the economy, security, systematicness, dynamics, and regionality of low-carbon cities (Du et al., 2022). The current study on the evaluation system mainly included the economic system, social system, environmental system, science and technology system, etc. (Tamanini, 2012; Wang et al., 2021). However, the analysis should be tailored to local conditions instead of directly applying the existing system without consideration. Specifically, Chen and Zhuang (2018) measured the effect of temperature control and carbon emissions in China’s low-carbon pilot cities by dividing the index system into six parts, namely, macro-domain, low-carbon energy, low-carbon industry, low-carbon life, low-carbon policy and innovation, resources, and environment. Yang et al. (2018) take the 36 cities from China’s low-carbon pilot project as the research object and use the carbon emission per capita and GDP per capita to categorize the 36 cities into four types to reveal their low-carbon development status; these four types are leading cities, developing cities, latecomer cities, and exploring cities. It can be found that different researchers will adopt different index systems to analyze the low-carbon development level of Chinese cities, which once again resonates with the view that the specific evaluation needs to be combined with the actual index system.
Third, the method of low-carbon development level measurement. At present, there are many methods to measure the low-carbon development level, some of which follow a subjective approach. For example, Sugsaisakon and Kittipongvises (2021) evaluated and assessed the sustainability feasibility of implementing climate change mitigation policies in Chiang Mai based on AHP and conducted a series of studies. Pan et al. (2020) comprehensively evaluate the numerical value of low-carbon economic development of China’s 30 regions from 2000 to 2015 by using the AHP method. Afterward, some scholars tried to combine the subjective analysis method with objective analysis. For example, Na and Zhao (2021) used both the AHP and the entropy weight method to form a fuzzy evaluation method and evaluated the low-carbon development level of evaluated college campuses. Most of the recent studies have applied an objective evaluation approach in order to avoid the errors caused by subjective evaluation methods. Qu and Liu (2017) used the entropy method to calculate the weight of each indicator and used the comprehensive approach of the Technique for Order Preference by Similarity to an Ideal Solution to measure the low-carbon development levels. Tang et al. (2020)investigated the carbon emission level of China’s Yangtze River Economic Belt based on the entropy weight TOPSIS model; Peng et al. (2022) evaluated the development level of low-carbon transportation in Guiyang based on the DPSIR model. Based on the previous analysis, it can be seen that the subjective evaluation method will result in a certain degree of errors, so the objective evaluation method can effectively improve the evaluation accuracy.
In general, it can be seen that the evaluation of the low-carbon development level is not only beneficial to the self-evaluation of the target area but can also provide references for the policy formulation and the effective operation of the carbon market. At the same time, it should be noted that in the process of measuring the low-carbon development level, the evaluation system should be established based on the basic evaluation principles and combined with the local conditions of the evaluation area. In addition, objective evaluation methods should be selected to improve the evaluation accuracy. Therefore, the marginal contribution of this article is divided into the following two aspects. First, the entropy weight TOPSIS model is used to evaluate the development of low-carbon level in Fujian province, which can truly reflect the original information of low-carbon evaluation indicators, minimize the index weight error, and improve the accuracy and precision of the final evaluation results. Second, the barrier factor model is used to analyze the main barrier factors affecting the low-carbon level in Fujian, which is conducive to formulating and adjusting low-carbon development policies.
The remainder of this article is organized as follows. Section 3 presents the model description, introducing the entropy weight TOPSIS model and obstacle degree model; Section 4 shows data description and system construction, explaining the selected indexes and data in this article and constructing the evaluation system needed in this article. Section 5 is the empirical analysis, which effectively evaluates the low-carbon development level in Fujian province, inspecting its evolution trend year by year and further exploring the shortcomings of low-carbon development in Fujian province at different times to ensure that the analysis results are comprehensive and specific. Section 6 puts forward corresponding policy suggestions based on the research conclusions.
Based on the previous analysis, this article will use the entropy TOPSIS model to measure the low-carbon development level of Fujian province and get the low-carbon development level index of Fujian province. Based on the calculation results, in order to study the key influencing factors and improve the low-carbon development level of Fujian province, this article will use the obstacle degree model to investigate the main restricting factors of the low-carbon development index. Corresponding revision suggestions will also be put forward so as to accelerate the high-quality development of the low-carbon process in Fujian province. In this study, the entropy weight TOPSIS model and obstacle degree model will be explained, respectively.
In the conventional TOPSIS method, the weight of each index is the same by default. However, there is a big gap between this assumption and reality. The entropy weight TOPSIS first quantifies the weights of different indexes through correlation calculation and then analyzes them by the TOPSIS method, making the results fitter for reality. The specific steps of this method are as follows:
1)Assuming that there are m evaluation objects and each object has n evaluation indexes, then establish a judgment matrix and standardize it.
2) Calculate information entropy
3) The weighting matrix calculates and determines the optimal solution
4) The Euclidean distance between different items and the optimal solution and the worst solution:
5) Calculate the comprehensive evaluation index
The process of index evaluation will be affected by constituent indicators. Theoretically, there is an optimal allocation in the constituent indicator system, but it is often difficult to achieve in reality. Therefore, the “short-board” index in index formation is the obstacle factor. Therefore, identifying the obstacle factors and correcting them will help to improve the index level. The idea of building the obstacle degree model is as follows.
Assuming that there are
At the same time,
Located on the southeast coast of China, Fujian province has few fossil fuel reserves, but it is abundant in clean energy like wind energy, solar energy, and tidal energy. Under the background of “dual carbon” goals, it has become an inevitable trend for Fujian province to promote energy transformation and optimize its energy mix to be clean and efficient. In 2021, the Fujian Provincial Government issued the “Plan for Accelerating the Establishment and Improvement of a Green Low-carbon Circular Economic System in Fujian province,” which emphasizes the need to promote the green low-carbon transformation of the energy system, accelerate the green transformation of the industrial structure in Fujian province, and improve the urban and rural environment. This shows that the establishment of a low-carbon economic system in Fujian province will accelerate the process of green transformation in various industries and fields. On this basis, combined with the existing research results, this article will build the evaluation system of low-carbon level in Fujian province and divide it into four dimensions: economy, society, energy, and environment. The sample period of the data used in this article is from 2006 to 2019, and the data mainly come from China Statistical Yearbook, Wind Database, EPS Database, and CEIC China Economic Database.
Under the principles of systematicness, safety, feasibility, and scientificity and based on the idea of layer-by-layer decomposition, the index system of this article is gradually refined into three layers from top to bottom: target layer, criterion layer, and index layer. Among them, the target layer is the low-carbon development level index, and the criterion layer refers to the economy, society, energy, and environment. The indicator layer is the representative index under the refinement of each criterion layer: ①From the economic level, this article selects per capita GDP to represent the level of economic development, the proportion of the added value of the secondary industry to represent the industrial structure, and the GDP growth rate stands for economic growth, the unemployment rate is the level of labor force, and the urbanization rate (urban population/total population) denotes urbanization level; ②From the social level, in this article, the per capita urban road area represents the level of social urban construction facilities, the public transport vehicles owned by every ten thousand people refers to the social public construction, the green coverage rate of built-up areas is the level of social greening, the amount of domestic waste clearance stands for the levels of social pollution discharge, and the investment in environmental pollution control represents social-environmental governance. ③From the aspect of energy, the per capita electricity consumption represents energy security, the energy consumption per unit of GDP denotes energy intensity, energy consumption represents energy consumption level, the reduction rate of energy consumption per unit in industrial added value represents energy conservation, and the proportion of renewable energy represents energy structure. ④From the aspect of the environment, carbon dioxide emissions represent carbon emissions, forest coverage represents carbon sink level, emissions per unit of GDP represent the cost of carbon emission, sulfur dioxide emissions represent air pollution, and green patent applications represent green innovation level. The specific index system is shown in Table 1.
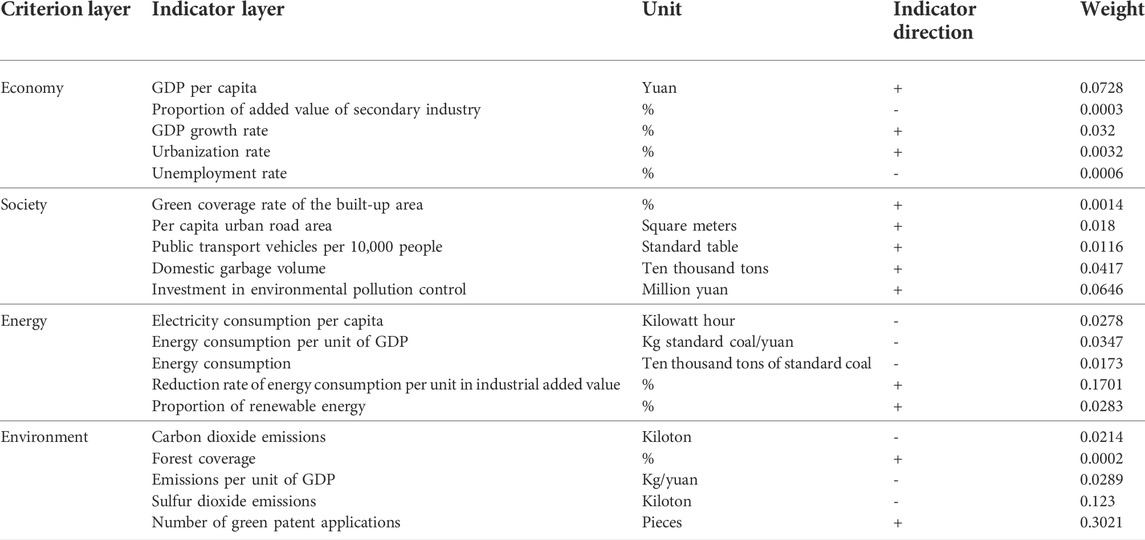
TABLE 1. Evaluation system of low-carbon development level in Fujian province.
This section elaborates on the empirical results. First, this article adopts the entropy weight TOPSIS model to analyze the evolution of the low-carbon development level index in Fujian province, and then combines it with the obstacle degree diagnosis to investigate the impact on the low-carbon development level index from the perspectives of system and indicators.
In the actual computing process, we not only measure the low-carbon development level index of Fujian province but also explore the development level index of four subsystems, namely, economic, social, energy, and environmental systems. It should be noted that the low-carbon development level index of Fujian province and the development level index of each system are relative approach degrees, and the value range is [0, 1], which means the closer the value is to 1, the better the exponential effect. The results are shown in Figure 1.
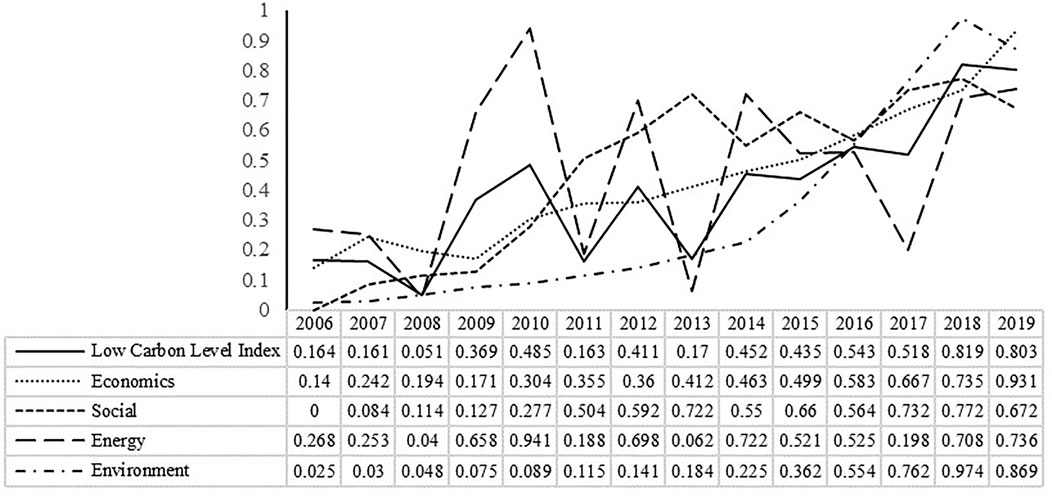
FIGURE 1. Low-carbon development level index and development level index of each subsystem of Fujian province.
It can be seen from the figure that the economic system shows an obvious upward trend on the whole, except for the figures from 2007 to 2009 which show a downward trend. The indexes from 2009 to 2011 register fast growth, while a relatively slow growth from 2011 to 2018 is identified, and the growth after 2018 is strong. In numerical terms, the economic system index of Fujian province has risen from 0.14 in 2006 to 0.931 in 2019, which is a significant improvement. This is because, in the past 20 years, the economic development of Fujian province has registered high-speed growth. With the rise of industry and the continuous development of various industries featuring better technologies and industrial upgrading, the economic development of Fujian province has always enjoyed a strong momentum. At the same time, thanks to its unique topography, tourism in some cities has developed rapidly and plays an important part in Fujian’s economy. In addition, due to the advent of the 5G era and comprehensive infrastructure, the new development model of the digital economy has gradually launched and shown obvious development advantages. The sound development of the digital economy provides a driving force for the scale promotion of investment, consumption, export, and other fields, which will become an effective channel for Fujian province to boost consumption while remaining open to international trade and investment. Based on the previous analysis, the economic development of Fujian province still has much potential, and the economic structure can be gradually optimized.
There is an obvious, fluctuating upward trend for the social system on the whole. From 2006 to 2013, the social system development index maintains an upward trend, with a relatively slow growth from 2006 to 2009 and a relatively fast growth onwards. From 2013 to 2017, an obvious and large fluctuation has been identified. After 2017, it appears to be a relatively stable upward trend. However, in 2019, it drops. In terms of value, Fujian province’s social development has achieved significant progress, especially after 2011, the development index is always higher than 0.5. With regard to the ranking, from 2017 to 2019, it ranks first, second, and fourth, respectively, which indicates that remarkable and stable progress has been made in the social development of Fujian province in the early stage. In reality, Fujian province has made strong headway in social infrastructure construction, comprehensive transportation construction, and sustainable development investment and has also made remarkable progress in environmental protection and people’s welfare. Based on the previous analysis, the social system of Fujian province has been greatly improved, and it is still moving forward. Sound social development lays a solid foundation for development in other fields.
An upward trend has been identified in the energy system on the whole, and there is a large fluctuation in the process. From 2006 to 2010, there is a large fluctuation, and the peak appears during this period. The years 2011–2015 witnessed two large fluctuations, and there is a significant decline in 2013. The years 2016–2019 see a large fluctuation, and in 2017, it drops significantly. After that, the system develops stably. As for the value, although the development of Fujian’s energy system fluctuates greatly, it still witnesses a significant increase, which increased from 0.268 in 2006 to 0.736 in 2019, and the index in 2019 ranks second. The reason is that Fujian province built an LNG receiving station in 2008, so the use of natural gas has increased significantly, which has a significant impact on the energy mix of Fujian province. Meanwhile, Fujian province reserves little fossil fuel, but the reserves of clean energy such as wind and solar energy are relatively high. Because clean energy is difficult to preserve, this will have a negative impact on the stability of the energy system. In addition, as the “dual carbon” goals are put forward, the energy system of Fujian province will continue to optimize. The previous analysis shows that the energy system of Fujian province is still in the process of optimization, and the development level of the energy system is constantly improving in spite of fluctuation.
It can be seen from the figure that there is an obvious upward trend on the whole for the environmental system, except for a slight decline in 2019. To be specific, the environmental system index has a low growth rate from 2006 to 2014, and from 2014 to 2018, the growth rate increases significantly. In terms of value, the environmental system index increased from 0.025 in 2006 to 0.869 in 2019, showing an obvious increase. Moreover, in 2018, the value reaches its peak, which is 0.974, demonstrating huge potential for development. As for the reason, Fujian province is devoted to enhancing environmental governance for a long time, and the relevant policy is relatively mature and is well implemented. At the same time, Fujian province has a high green innovation level. From the entropy results, green innovation has the greatest impact on the low-carbon development level, so the continuous improvement of the environmental system index in Fujian province in recent years is largely due to the continuous advancement and the popularization of green technology. In addition, environmental pollution is also one of the important factors that affect the environmental system. The steady improvement of the environmental system index also indicates that the air pollution in Fujian province has been effectively alleviated. Based on the previous analysis, the development of environmental system in Fujian province has a good prospect, and a good foundation has been laid for the development of green technology.
The overall low-carbon development level shows a fluctuating upward trend, and the fluctuation is relatively large in some years. From 2006 to 2016, the fluctuation of the overall low-carbon development level is similar to that of the energy system, but the fluctuation is relatively small. After 2016, although the low-carbon development level still fluctuates, it shows an obvious upward trend. As for the value, it increases from 0.164 in 2006 to 0.803 in 2019, and 0.051 in 2008 and 0.819 in 2018 are the minimum and maximum values in the sample period, respectively. This shows that the overall low-carbon development level in Fujian province has made remarkable progress in the last decade and has remained at a relatively high level in recent years. Combining with other systems, although the fluctuation of each subsystem is different, they all show a rising trend on the whole, which serves as the basis for the improvement of the overall low-carbon development level. In the meantime, the clean energy in Fujian province develops better, and large-scale installation of wind and solar energy and large-scale use of nuclear power plants are all effective paths for low-carbon development. In addition, the promotion and application of green technology also show that the economic development of Fujian province is gradually transforming into intensive green development, which means the low-carbon development level of Fujian province can stabilize at a high level for a long time.
In order to further investigate the impact of different subsystems and indicators on the low-carbon development level index of Fujian province, this section will conduct an obstacle degree diagnostic analysis based on the obstacle degree model and analyze the obstacle degrees of each subsystem and indicator year by year. Given the large number of indicators in this article, for indicator layer research, this article only lists the first five indicators for ranking analysis.
It can be seen from Table 2 that the impact of each subsystem on the low-carbon development level index of Fujian province is different, but the ranking of the influence of different subsystems is the same each year. The effect of the economic system is the lowest, with the average obstacle degree being 10.29%. The influence of the social system is relatively low, and the average obstacle degree is 12.92%. The impact of the energy system is relatively high, with a 30.27% of average obstacle degree. The environmental system has the biggest impact, with an average obstacle degree being 46.52%. In terms of the annual change of each subsystem, the obstacle degree of economic, social, and energy systems all show a slightly fluctuating upward trend. Also, there is a certain degree of fluctuating downward trend for the obstacle degree of the environmental system. In general, the behavior of the environmental system will directly affect the performance of the low-carbon development level, and the highest obstacle degree of the environmental system proves this statement. Although after more than 10 years of development, the ranking of each subsystem has not changed, and the changes in values show that the influence of each subsystem on the low-carbon development level index of Fujian province has changed. The increase in the obstacle degree of the economic system and the social system indicates that the optimization of the economic structure and the adjustment of sustainable social development need to be strengthened, and the economic production mode and people’s lifestyle need to be further changed, so as to reduce their obstacles to the low-carbon level index. The increase in the obstacle degree of the energy system indicates that the effect of the upgrading of the energy structure is not obvious, and it is necessary to effectively improve the energy consumption mode and reduce the proportion of fossil energy to solve the problem of carbon emission from the root. Based on the previous analysis, the environmental system is still an important factor affecting the low-carbon level index of Fujian province and has been effectively improved. However, the hindrance of other subsystems to the low-carbon level index is gradually increasing, which indicates that the low-carbon path of Fujian province needs to gradually shift from “making up afterward” to “avoiding in advance."
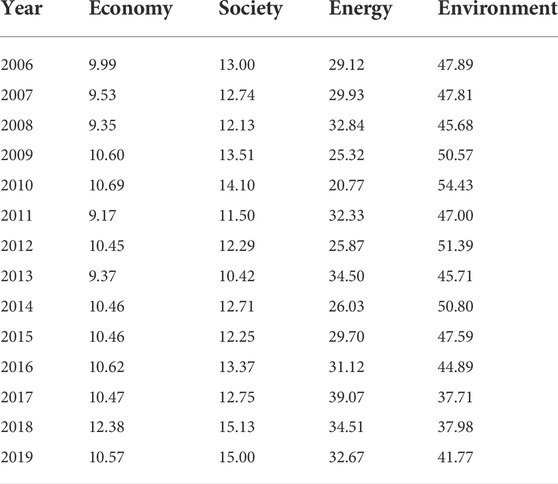
TABLE 2. Subsystem obstacle degree of low-carbon development level index in Fujian province (%).
From Table 3, it can be discovered that from 2006 to 2019, the five indicators that exert the greatest impact on the low-carbon development level index of Fujian province are exactly the same as in the previous analysis, where only the ranking of some years is different. Moreover, the obstacle degree of green innovation, energy conservation, and air pollution rank in the top three, while economic development and environmental governance rank in the last two. Based on the frequency of obstacle degree of indexes in more than 10 years and the ranking of influence, the ranking is green innovation, followed by energy conservation, air pollution, economic development, and environmental governance, with the average obstacle degree being 29.94, 20.07, 11.82, 6.87, and 6.13%, respectively. This indicates that the major measures to improve the low-carbon development level index in Fujian province are as follows: first, advancing the existing technology, increasing the investment in green technology, and promoting the landing of green technology so as to further improve green production and green life and promote the low-carbon development level of Fujian province fundamentally. Second, broadening ways for energy conservation holds the key to improving the level of low-carbon development, which needs to accelerate the energy mix restructuring, energy costs reduction, and clean energy proportion increasing. Third, the optimization of the industrial structure needs to be accelerated and gradually promote de-industrialization thereby reducing carbon emissions. Fourth, controlling air pollution can directly alleviate the pressure of carbon emissions, and accelerating the development of desulfurization and denitrification technology can reduce polluting gas emissions, which can effectively improve the level of low-carbon development. Promoting high-quality economic development, accelerating domestic-international dual circulation, and guiding the economic structure to become advanced and green are important starting points to improve the level of low-carbon development and the quality of people’s lives. Fifth, strengthening environmental governance, formulating a supporting and efficient policy system, and increasing financial support for environmental governance are joint measures to control environmental pollution from government and enterprises to help improve the level of low-carbon development. Based on the previous analysis, the improvement of the low-carbon development level in Fujian province needs to be promoted from many dimensions, such as advancing green technology, promoting the process of de-industrialization, optimizing the economic structure and industrial structure, and increasing investment in environmental protection.
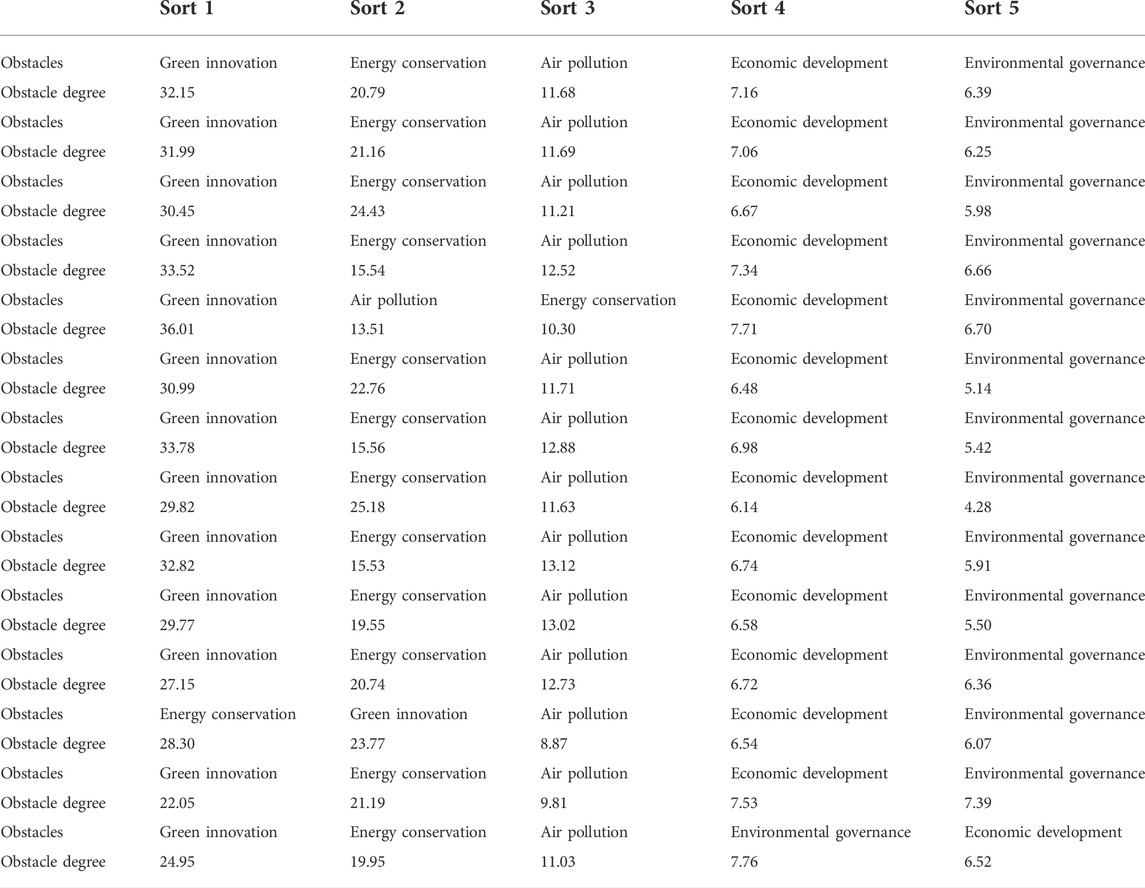
TABLE 3. Analysis of obstacle degree of indicator layer of low-carbon development level index in Fujian province (%).
By adopting the entropy weight TOPSIS model, this article computes the low-carbon development level index of Fujian province from 2006 to 2019, and the obstacle factor analysis is conducted to investigate the key factors that influence the low-carbon development level of Fujian province. This article discovers that the low-carbon development level index of Fujian province shows a fluctuating upward trend, rising from 0.164 in 2006 to 0.803 in 2019, which indicates that the low-carbon development level in Fujian province has achieved remarkable results. As for the subsystems, the environmental system remains an important factor for the low-carbon development level in Fujian province, with an average annual obstacle degree being 46.52%, but the influence of the other three subsystems is gradually increasing. In terms of indicator layer, green innovation, energy conservation, air pollution, economic development, and environmental governance are the five indicators with the highest annual obstacle degree, which paves the path for the improvement of the low-carbon development level. Based on the conclusions, the suggestions are as follows:
To begin with, speeding up the research and development of green technology and promoting its application. Green technology innovation can fundamentally change the mode of production and people’s lifestyle, thereby reducing carbon emissions and pollution. Fujian can make full use of the rich advantages of clean energy, promote the research and development of wind energy and solar energy storage technology, effectively avoid energy waste and achieve a stable supply of clean energy. Orderly promote the green and high-quality development of new infrastructure represented by data center and 5G give play to its role of “one industry leads all industries” and help Fujian province achieve the goal of carbon peak and carbon neutrality.
Second, strengthen energy conservation and carbon reduction. It is required to resolutely curb the blind development of “two high” projects, do a solid foundation in the transformation and upgrading of energy conservation and carbon reduction in key areas of Fujian province, and drive the green and low-carbon transformation of the whole industry. With the theme of “green, low-carbon, and energy-saving first,” we can organize energy-saving publicity and training activities, collect and promote energy-saving technology products, introduce energy-saving diagnosis into enterprises, popularize energy-saving policies and regulations, promote the application of advanced energy-saving technologies, deeply tap the energy-saving potential of enterprises, and comprehensively improve the energy efficiency level of industrial enterprises.
Third, energy transformation should be promoted and the construction of a “safe, efficient, clean, and low-carbon” energy system should be accelerated. Energy use is the main source of carbon emissions. Therefore, the energy structure should be adjusted, which is to increase the proportion of clean energy, accelerate the construction of wind power and photovoltaic infrastructure, and improve the efficiency of nuclear power, so that carbon emissions can be reduced from the root. Improving efficiency in the use of fossil fuels and the coupling of different clean energy applications should be encouraged. In light of the great potential for developing clean energy in Fujian province, it should promote the development of clean energy and increase the proportion of clean electricity and clean energy, so that carbon emissions and pollution can be effectively reduced.
Moreover, promoting the optimization of the economic structure and accelerating the process of de-industrialization. The economic development goals should be well planned and take into consideration both economic growth and its quality, and the economy should gradually shift from high-speed growth to high-quality development. Promoting the advancement of economic structure and gradually transforming to green development, so that the normal life and production are more environmental-friendly, and the low-carbon development level of Fujian province can be increased. In addition, speed up the effort to reconstruct the industrial structure and promote the process of de-industrialization. Promoting the upgrading of industrial structure, which means gradually increasing the proportion of tertiary industry and reducing the proportion of the industry, constructing an advanced and green industrial structure, and then reducing the energy cost and carbon emission of various products, so as to improve the low-carbon development level of Fujian province.
Last but not least, environmental governance should be strengthened, and formulate supporting policies to facilitate the promotion and application of the carbon market. Environmental governance is the direct way to improve the low-carbon development level. From the government’s perspective, building and implementing an effective policy system can effectively alleviate the problem of carbon emissions and pollution. At the same time, the government should increase financial support and set up transfer funds to facilitate Fujian’s low-carbon development. In addition, accelerating the popularization and application of the carbon market and using market forces to effectively allocate resources can also control carbon pollution. Based on this, promoting the integration between policy guidance and the carbon market, coordinating government behavior with market behavior, and using market control and market regulation tools can further promote the low-carbon development level in Fujian province.
The original contribution presented in the study are included in the article/ Supplementary Material; further inquiries can be directed to the corresponding author.
KX: writing—original draft, formal analysis, methodology, and software. NZ: writing—review and editing, investigation, and software; JC: writing—original draft, conceptualization, and data curation. WG: writing—review and editing, supervision, methodology, and validation.
This paper is supported by the State Grid Fujian Electric Power Company research project “Evaluation of the Effectiveness of Energy Transitions and Suggestions in Fujian Province” (Grant SGFJJY00ZCJS2100072).
Authors KX, NZ, and JC were employed by the Economic and Technological Research Institute, State Grid Fujian Electric Power Co., Ltd.
The remaining author declares that the research was conducted in the absence of any commercial or financial relationships that could be construed as a potential conflict of interest.
All claims expressed in this article are solely those of the authors and do not necessarily represent those of their affiliated organizations, or those of the publisher, the editors, and the reviewers. Any product that may be evaluated in this article, or claim that may be made by its manufacturer, is not guaranteed or endorsed by the publisher.
Chen, L., and Wang, K. (2022). The spatial spillover effect of low-carbon city pilot scheme on green efficiency in China’s cities: evidence from a quasi-natural experiment. Energy Econ. 110, 106018. doi:10.1016/j.eneco.2022.106018
Chen, N., and Zhuang, G. (2018). Effective evaluation on low-carbon pilot cities of China. Urban Dev. Stud. 25 (10), 88–95+156. (in Chinese). doi:10.3969/j.issn.1006-3862.2018.10.018
Cheng, J., Yi, J., Dai, S., and Xiong, Y. (2019). Can low-carbon city construction facilitate green growth? Evidence from China’s pilot low-carbon city initiative. J. Clean. Prod. 231, 1158–1170. doi:10.1016/j.jclepro.2019.05.327
Cheng, X., Long, R., and Chen, H. (2020). A policy utility dislocation model based on prospect theory: a case study of promoting policies with low-carbon lifestyle. Energy Policy 137, 111134. doi:10.1016/j.enpol.2019.111134
Cheng, Y., and Yao, X. (2021). Carbon intensity reduction assessment of renewable energy technology innovation in China: a panel data model with cross-section dependence and slope heterogeneity. Renew. Sustain. Energy Rev. 135, 110157. doi:10.1016/j.rser.2020.110157
Du, K., Cheng, Y., and Yao, X. (2021). Environmental regulation, green technology innovation, and industrial structure upgrading: the road to the green transformation of Chinese cities. Energy Econ. 98, 105247. doi:10.1016/j.eneco.2021.105247
Du, X., Shen, L., Ren, Y., and Meng, C. (2022). A dimensional perspective-based analysis on the practice of low carbon city in China. Environ. Impact Assess. Rev. 95, 106768. doi:10.1016/j.eiar.2022.106768
Duan, Y., Mu, H., Li, N., Li, L., and Xue, Z. (2016). Research on comprehensive evaluation of low carbon economy development level based on AHP-entropy method: a case study of dalian. Energy Procedia 104, 468–474. doi:10.1016/j.egypro.2016.12.079
Gu, G., Zheng, H., Tong, L., and Dai, Y. (2022). Does carbon financial market as an environmental regulation policy tool promote regional energy conservation and emission reduction? Empirical evidence from China. Energy Policy 163, 112826. doi:10.1016/j.enpol.2022.112826
Jia, J., Fan, Y., and Guo, X. (2012). The low carbon development (LCD) levels’ evaluation of the world’s 47 countries (areas) by combining the FAHP with the TOPSIS method. Expert Syst. Appl. 39, 6628–6640. doi:10.1016/j.eswa.2011.12.039
Lin, Y., Huang, R., and Yao, X. (2021). Air pollution and environmental information disclosure: an empirical study based on heavy polluting industries. J. Clean. Prod. 278, 124313. doi:10.1016/j.jclepro.2020.124313
Murshed, M., Saboori, B., Madaleno, M., Wang, H., and Doğan, B. (2022). Exploring the nexuses between nuclear energy, renewable energy, and carbon dioxide emissions: the role of economic complexity in the G7 countries. Renew. Energy 190, 664–674. doi:10.1016/j.renene.2022.03.121
Na, W., and Zhao, Z. (2021). The comprehensive evaluation method of low-carbon campus based on analytic hierarchy process and weights of entropy. Environ. Dev. Sustain. 23, 9308–9319. doi:10.1007/s10668-020-01025-0
Pan, W., Gulzar, M. A., and Hassan, W. (2020). Synthetic evaluation of China’s regional low-carbon economy challenges by driver-pressure-state-impact-response model. Int. J. Environ. Res. Public Health 17, 5463. doi:10.3390/ijerph17155463
Pan, X., Pu, C., Yuan, S., and Xu, H. (2022). Effect of Chinese pilots carbon emission trading scheme on enterprises’ total factor productivity: the moderating role of government participation and carbon trading market efficiency. J. Environ. Manag. 316, 115228. doi:10.1016/j.jenvman.2022.115228
Peng, T., Jin, Z., and Xiao, L. (2022). Evaluating low-carbon competitiveness under a DPSIR-game theory-TOPSIS model—a case study. Environ. Dev. Sustain. 24, 5962–5990. doi:10.1007/s10668-021-01680-x
Qu, Y., and Liu, Y. (2017). Evaluating the low-carbon development of urban China. Environ. Dev. Sustain. 19, 939–953. doi:10.1007/s10668-016-9777-8
Song, M., Zhao, X., and Shang, Y. (2020). The impact of low-carbon city construction on ecological efficiency: empirical evidence from quasi-natural experiments. Resour. Conserv. Recycl. 157, 104777. doi:10.1016/j.resconrec.2020.104777
Sugsaisakon, S., and Kittipongvises, S. (2021). Citywide energy-related CO2 emissions and sustainability assessment of the development of low-carbon policy in Chiang Mai, Thailand. Sustainability 13, 6789. doi:10.3390/su13126789
Tamanini, J. (2012). Do national green reputations matter? The global green economy index and implications for stakeholders in the green economy. London: International Place Branding Yearbook.
Tang, D., Zhang, Y., and Bethel, B. J. (2020). A comprehensive evaluation of carbon emission reduction capability in the Yangtze River economic Belt. Int. J. Environ. Res. Public Health 17, 545. doi:10.3390/ijerph17020545
Wang, Y., Fang, X., Yin, S., and Chen, W. (2021). Low-carbon development quality of cities in China: evaluation and obstacle analysis. Sustain. Cities Soc. 64, 102553. doi:10.1016/j.scs.2020.102553
Keywords: carbon peaking and carbon neutrality goals, low-carbon development level, entropy weight TOPSIS, obstacle factor, carbon market
Citation: Xiang K, Zheng N, Chen J and Gao W (2022) Evaluation and obstacle degree analysis of low-carbon development level in Fujian province–based on entropy weight TOPSIS method. Front. Energy Res. 10:948893. doi: 10.3389/fenrg.2022.948893
Received: 20 May 2022; Accepted: 30 June 2022;
Published: 04 August 2022.
Edited by:
Xin Yao, Xiamen University, ChinaReviewed by:
Aijun Li, Shandong University, ChinaCopyright © 2022 Xiang, Zheng, Chen and Gao. This is an open-access article distributed under the terms of the Creative Commons Attribution License (CC BY). The use, distribution or reproduction in other forums is permitted, provided the original author(s) and the copyright owner(s) are credited and that the original publication in this journal is cited, in accordance with accepted academic practice. No use, distribution or reproduction is permitted which does not comply with these terms.
*Correspondence: Wei Gao, d2VpZ2FvXzAxMTBAMTI2LmNvbQ==
Disclaimer: All claims expressed in this article are solely those of the authors and do not necessarily represent those of their affiliated organizations, or those of the publisher, the editors and the reviewers. Any product that may be evaluated in this article or claim that may be made by its manufacturer is not guaranteed or endorsed by the publisher.
Research integrity at Frontiers
Learn more about the work of our research integrity team to safeguard the quality of each article we publish.