 Yaopei Zhu
 Weijia Sun
 Cairan Miao
 Qi Wang
- School of Electrical Engineering, Southeast University, Nanjing, China
The electrical–thermal coupling integrated energy system (IES) has multi-timescale characteristics, and the gas–thermal slow dynamic characteristics of the IES contain rich flexibilities. The state of the gas–thermal system changes relatively with a time delay when the external conditions change, which can provide power support for the system over a certain timescale. Based on the gas–thermal inertia power support capability, a reliability assessment method of the IES considering gas–thermal inertia is proposed. According to research, the reliability assessment of the IES based on gas–thermal inertia can reduce the size and frequency of load shedding, alleviate the system operation risk caused by heavy load, reduce the system operation cost, and improve the system long-term operation reliability and economy. The greater the importance assessment index of energy conversion equipment, the greater its impact on system reliability, which is the weak node that should be focused on and protected.
Introduction
An integrated energy system (IES) has the complementary characteristics of electricity, heat, and gas, which can promote the efficient utilization of energy and improve the absorption capacity of renewable energy (Pan et al., 2017; Fei et al., 2019). However, the multienergy coupling characteristics in the IES increase the operation complexity and uncertainty at the same time, which challenges the safe and reliable operation of the system (Mu et al., 2020; Wu et al., 2021). Therefore, it is necessary to fully exploit IES flexibility and ensure operation reliability and security through coordination and optimization (Wang et al., 2019). Compared with traditional power systems, the slow dynamic characteristics of gas–thermal system in the multienergy coupling IES contains rich flexibilities, which will help improve the reliability of system operation (Saldarriaga et al., 2013).
Regarding the slow dynamic characteristics of the thermal system, the concept of thermal inertia was mostly put forward in the research of the system optimization scheduling (Lei and Yi, 2018; Qin et al., 2019), flexibility assessment (Li et al., 2020a), and load recovery and frequency response strategies (Xu et al., 2019). Thermal inertia was considered as a response resource with scheduling value and verified to play a positive role in IES coordination operation. Only a few articles have conducted reliability assessment based on thermal inertia. For example, energy flow mutual reliability gain brought by thermal inertia was quantified (Li et al., 2020b), and inertia and transmission delay characteristics of the thermal network and modification of thermal supply reliability were considered. The above research only considered thermal inertia during the index calculation stage, and the reliability assessment index was modified accordingly. Thermal inertia did not actually participate in the calculation process of load shedding.
Regarding the slow dynamic characteristics of gas system, current studies mainly use the gas pipe storage characteristics to provide flexibility for IES optimal operation. The positive effects of gas pipe storage on improving IES flexibility were verified through the research on system optimization and scheduling (Fang et al., 2018; Liu et al., 2019; Bao et al., 2020), the mechanism of electrical interaction, flexibility assessment (Clegg and Mancarella, 2016), standby configuration (Antenucci and Sansavini, 2018), and optimal power flow calculation (Saedi et al., 2021). However, few studies have considered gas inertia in the reliability assessment of the IES.
To conclude, current studies mainly explore IES flexibility from the perspective of the gas pipe storage characteristics or thermal inertia characteristics of the thermal system, but few studies comprehensively consider both. At the same time, in terms of utilizing the flexibility of the gas–thermal system, the existing research mainly focused on how to coordinate and optimize the system but lacked basic mechanism analysis on how to consider the dynamic characteristics of the gas–thermal system in the reliability assessment of the IES. In fact, it is necessary to consider gas–thermal inertia in the reliability assessment of the IES when both gas storage and thermal inertia can provide power support for the system with buffer space.
Current innovation points generally lie in considering the influence of different factors on system reliability assessment when the research on IES reliability assessment is conducted. For example, considering the influence of multienergy storage (Cheng et al., 2020), comprehensive demand response, energy grade difference, and the operation strategy on system reliability, optimal load shedding is carried out in different scenarios, and the influence of different influencing factors on reliability assessment results is analyzed. In view of the problems existing in the current research, this study carries out a reliability assessment of the IES based on the characteristics of gas–thermal inertia to fully exploit the flexibility contained in the gas–thermal system and analyze the influence of gas–thermal inertia on the reliability of the IES. Therefore, this study, by considering the rich flexibility contained in the IES slow dynamic characteristics of the gas–thermal system, first establishes the reliability assessment model of the IES considering gas–thermal inertia, then analyzes the reliability assessment of specific processes, and finally analyzes the influence of gas–thermal inertia on the reliability assessment of the IES and studies the importance of different key equipment nodes for the long-term stable and reliable operation of the IES according to the rationality of the proposed model verified by actual examples.
Analysis of Gas–Thermal Inertia Characteristics of the Integrated Energy System
Thermal energy in the IES has inertia characteristics, shown in Figure 1A. 1) Owing to the long transmission pipeline, there is a thermal delay of several minutes to several hours between the thermal source and the thermal load (Wei et al., 2022). 2) The thermal load can operate within the comfort zone and maintain a comfortable temperature for a long time owing to thermal inertia even if the thermal source is stopped. Therefore, the thermal load temperature changes relatively backward, and a comfortable temperature can be maintained in a certain period when the thermal source instantaneously changes owing to the thermal pipeline time delay and thermal load inertia.
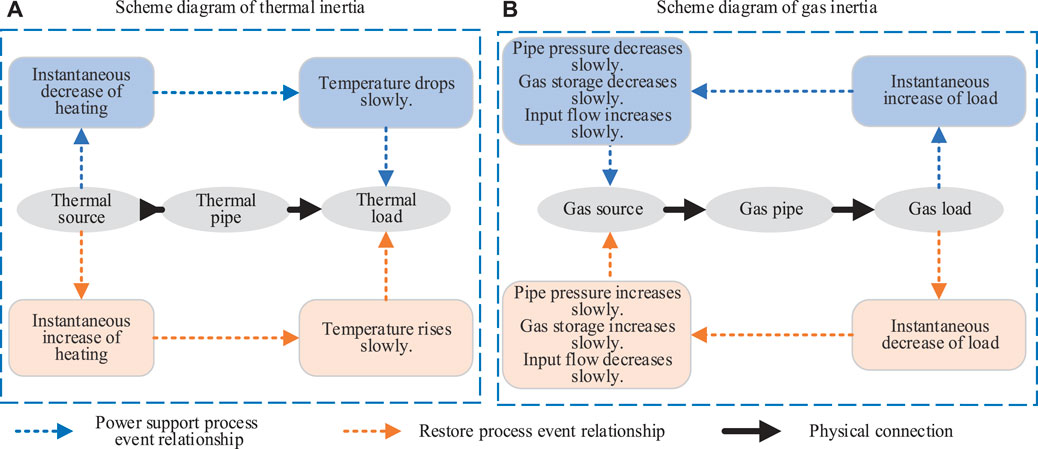
FIGURE 1. Schematic diagram of gas and thermal inertia in the integrated energy system. (A) Scheme diagram of thermal inertia and (B) Scheme diagram of gas inertia.
In a similar manner, natural gas in the IES has inertial characteristics. As shown in Figure 1B, natural gas pipeline storage has negative feedback regulation characteristics (Valdivia et al., 2020), which are as follows: 1) when the gas load increases, the transmission pipeline releases part of the pipe storage to the load, with the pipeline intensity of pressure and the pipe storage decreasing but the input flow increasing and 2) when the gas load decreases, the transmission pipeline stores the natural gas supplied by part of the gas source, with the pipeline intensity of pressure and the pipe storage increasing but the input flow decreasing. The specific principles are as follows: 1) When the gas load suddenly increases, the transmission pipe releases part of the pipe storage to the load in a short time, thereby allowing a large amount of gas to flow out of the pipe, which results in an increased flow rate. The amount of gas left at the pipe ends at that time will be less than before, thereby resulting in decreased pressure. 2) When the gas load suddenly decreases, the reduction of the load reduces the gas flow rate. Natural gas, that would otherwise be consumed, will accumulate in the pipeline, which increases the pipe pressure. Considering the similarity of principles, the intensity of pressure at the end of the gas pipeline is compared to the temperature of the thermal load, and the gas pipe storage is compared to the time delay and inertia of the thermal load. It can be concluded that the intensity of pressure at the end of the pipeline changes relatively backward owing to the existence of the gas pipe, and the appropriate intensity of pressure can be maintained within a certain period when load demand changes instantaneously.
To conclude, the system state changes relatively backward owing to the existence of buffer space and can maintain an acceptable state within a certain period. Therefore, gas–thermal inertia can provide external power support over a certain timescale.
Reliability Assessment Model of the Integrated Energy System Considering Gas–Thermal Inertia
It is necessary to consider IES gas–thermal inertial power support capability when conducting the reliability assessment of the IES. Therefore, this section will establish the IES reliability assessment model considering the gas–thermal inertia.
System Structure
In this work, we study the IES structure shown in Figure 2. The system has two kinds of energy input: electric power and natural gas. The electric load is supplied by an external grid, a photovoltaic (PV), a combined heat and power (CHP) unit, and an electricity storage unit. The thermal load is supplied by an electric boiler, a CHP unit, a gas boiler, and a thermal storage unit. Components that may fail in the system include CHP units, electricity storage, an electric boiler, a gas boiler, and thermal storage.
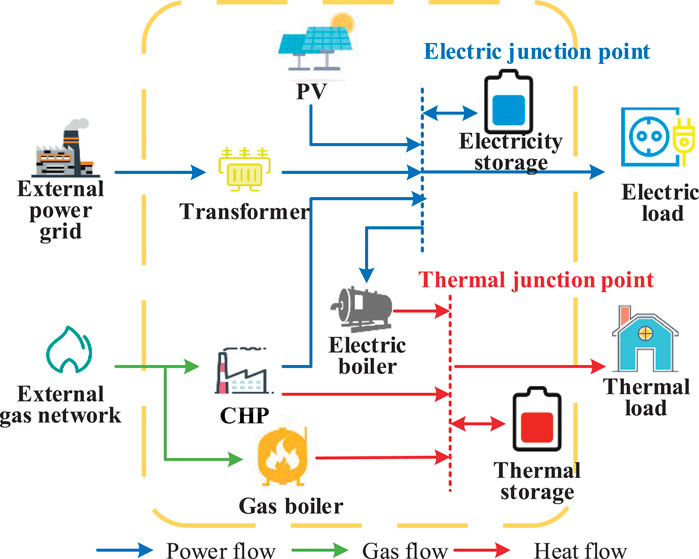
FIGURE 2. Integrated energy system structure.
Objective Function
The first condition aims at the least amount of the reduction of all types of loads. In the assessment cycle (this study takes 1 day as a complete scheduling cycle, which is equally divided into 24 periods), the maximum total energy supply and minimum load shedding of the system are regarded as the objective function. k represents the number of periods.
PL is the total energy supply of the IES. PkEL is the total energy supply of the IES in time k. PkHL is the total thermal energy of the IES in time k.
PLC is the total amount of load shedding. PkElf is the forecasting output of electric load in the IES in time k. PkHLf is the forecasting output of thermal load in the IES in time k.
The second condition includes the cost of compensation for load shedding and the cost of gas–thermal inertia output in the total cost and aims at minimum operating cost. In the assessment cycle, the minimum system operating cost is regarded as the objective function.
C is the total cost of the IES. CE is the output cost of the electrical power grid. CG is the output cost of the gas network. CGR is the output cost of gas inertia. CHR is the output cost of thermal inertia. CEC is the electric load shedding compensation cost. CHC is the thermal load shedding compensation cost. ckE is the unit output cost of the electrical power grid. cG is the unit output cost of the gas network. cGR is the unit output cost of gas inertia. cHR is the unit output cost of thermal inertia. cEC is the electric load shedding compensation unit cost. cHC is the thermal load shedding compensation unit cost.
Constraint Conditions
According to the actual operation of the IES, the constraints are described as follows.
1) Electrical and thermal power balance
The electrical power balance is as follows:
PkPVf is the PV forecast output in time k.
The thermal power balance is as follows:
PkEB,h is the thermal energy output from the electric boiler in time k. PkCHP,h is the thermal energy output from CHP units in time k. PkGB,h is the thermal energy output from the gas boiler in time k. PkHS,discharge is the energy discharged by thermal storage in time k. PkHL is the actual thermal load supplied by the IES in time k. PkHLf is the forecast thermal load output in time k. PkHS,charge is the energy charged in thermal storage in time k. RkH is the power support provided by thermal inertia in time k. fkGB is the working state of the gas boiler. fkHS,discharge is the energy discharged state of thermal storage. fkHS,charge is the energy charged state of thermal storage.
2) Energy supply–side constraint
Power supply constraints are as follows:
PminE is the minimum input for the external power grid. PmaxE is the maximum input for the external power grid. PupS is the upper climbing rate limits for the external power grid input. PdownS is the lower climbing rate limits for the external power grid input. △k is the k period.
Gas supply constraints are as follows:
PminG is the minimum input for the external gas network. PmaxG is the maximum input for the external gas network. PupG is the upper climbing rate limits for the external gas network input. PdownG is the lower climbing rate limits for the external gas network input. PkG is the power supply from the external power grid in time k.
3) Energy conversion and energy storage–side constraints
CHP unit constraints are as follows:
RkG is the power support provided by gas inertia in time k. PkCHP is the input power to CHP units in time k. PkGB is the input power to the gas boiler units in time k.
Electric boiler constraints are as follows:
Gas boiler constraints are as follows:
Electricity storage constraints are as follows:
PmaxES,discharge is the upper limit of electricity storage discharging power. PminES,discharge is the lower limit of electricity storage discharging power. PmaxES,charge is the upper limit of electricity storage charging power. PminES,charge is the lower limit of electricity storage charging power. CkES is the capacity of electricity storage.
Thermal storage constraints are as follows:
PminHS,discharge is the lower limit of heat storage discharging power. PmaxHS,discharge is the upper limit of heat storage discharging power. PminHS,charge is the lower limit of heat storage charging power. PmaxHS,charge is the upper limit of heat storage charging power. CkHS is the capacity of heat storage.
4) Gas–thermal inertia constraints
Gas inertia constraints are as follows:
Thermal inertia constraints are as follows:
4) Integrated energy system reliability assessment process considering gas–thermal inertia
The steps of IES reliability assessment considering gas–thermal inertia, shown in Figure 3, mainly include four parts: load and PV annual data generation, component annual state generation, optimal load shedding optimization, and reliability assessment index calculation (Bansal et al., 2014).
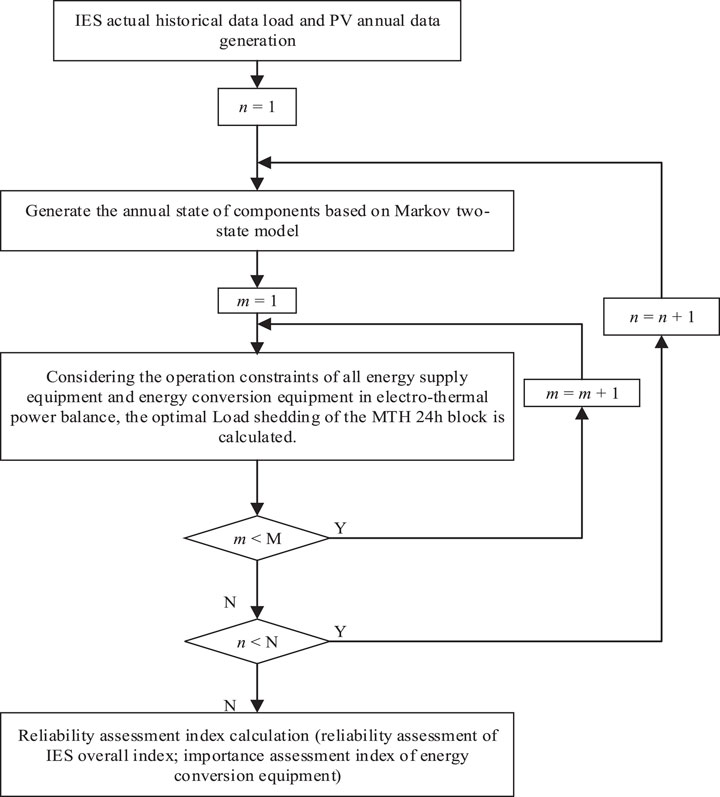
FIGURE 3. Steps of reliability assessment.
Load and Photovoltaic Annual Data Generation
Divide a year into 8,760 periods, each of which is 1 h. The required data for electric load, thermal load, and PV year per hour are captured as follows from the actual historical data of the IES (sampling once every 15 min), and the results will be used as data input parameters.
P4kEL is the electrical load power of the IES at sampling point 4k. P4kHL is the thermal load power of the IES at sampling point 4k. P4kPVf is the PV output of IES at sampling point 4k.
Component Year State Generation
Based on the Markov two-state model, the annual state of components is generated, and the Monte Carlo method is used to simulate the state change behavior of IES components within 1 year. The results will be used as input parameters of availability state variables.
The component i shutdown model is obtained as follows (Wei et al., 2020):
i is the component and
The random number Rd. ti is generated in the evenly distributed [0,1]:
fd.ti is the equipment state of component i in time t at the
The overall state of the system components can be obtained as follows:
Optimal Load Shedding Optimization
The specific steps of optimal load shedding optimization are as follows:
Step 1: Set the initial value of Monte Carlo random simulation times n = 1 and the total random simulation times N = 1,000.
Step 2: Set the initial value of the annual optimal load shedding calculation block m = 1 and the total number of random simulations M = 365.
Step 3: Select the mth 24-h block and calculate the optimal load shedding with 24 h as the whole cycle based on the generated source load data and element state while comprehensively considering the electrical and thermal power balance and the operation constraints of each energy supply device and energy conversion device.
Step 4: If m = 365, the annual optimal load shedding process ends, and the process moves to step 5. If m < 365, go to step 3, where m = m + 1.
Step 5: If n = 1,000, the Monte Carlo random simulation process ends. If n < 1,000, go to step 2, where n = n + 1.
Calculation of Reliability Assessment Index
The overall index of IES reliability assessment can be obtained by averaging the optimal load shedding optimization under multiple Monte Carlo random simulations, in which PaveLC, PaveELC, and PaveHLC can be expressed as follows:
PaveLC is the annual total load shedding amount. PaveELC is the total annual electrical power load shedding. PaveHLC is the total annual thermal load shedding.
Annual energy shortage time taveC and annual energy shortage probability paveC can be expressed as follows:
taveC is the annual energy shortage time. paveC is the annual energy shortage probability. tnC is the number of hours with insufficient energy in the year in the nth Monte Carlo random simulation.
The importance assessment index si of the energy conversion equipment i is expressed as follows: the larger the importance assessment index, the greater the influence of the energy conversion equipment on the system’s reliability.
si is the importance assessment index. PaveLC,i is the annual total load shedding when only the energy conversion device i fails.
Case Study
In this article, the YALMIP toolbox is run in MATLAB 2020a, and Gurobi9.1.1 is used to solve the above mixed integer linear programming problem. To verify the influence of gas–thermal inertia on reliability assessment results of the IES and analyze the importance of different key equipment nodes for the long-term stable and reliable operation of the IES, various cases are considered for comparative analysis, as shown in Table 1.
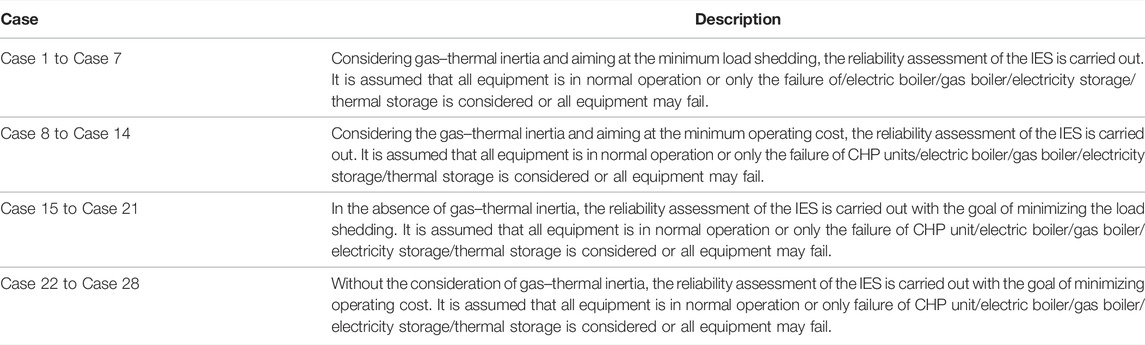
TABLE 1. Descriptions of different cases.
The annual data of electrical and thermal loads and PV in the actual IES are shown in Figures 4A,B, respectively, and the failure rate of each key equipment node is shown in Table 2.
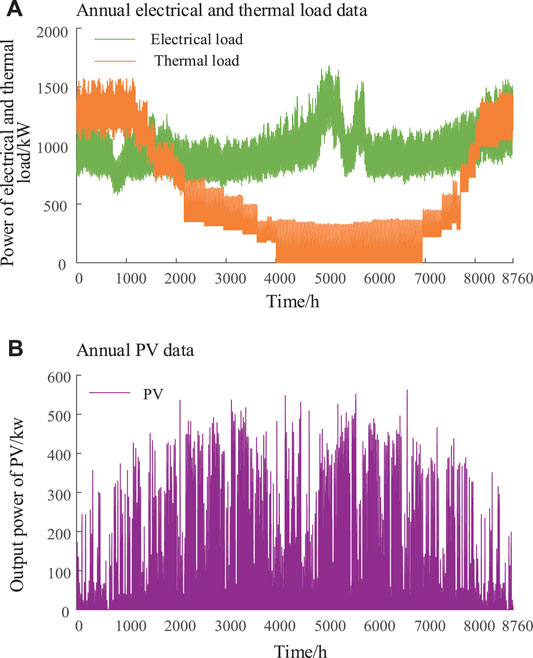
FIGURE 4. Annual data of load and photovoltaic. (A) Annual electrical and thermal load data and (B) Annual PV data.
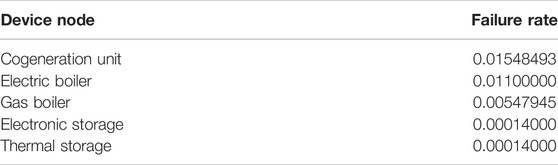
TABLE 2. Failure rate of each key equipment node.
Analysis of Influence of Gas–Thermal Inertia on the Reliability Assessment of an Integrated Energy System with Minimum Load Shedding
A 1-year long-term reliability assessment is carried out considering the minimum load shedding as the goal and including/excluding the gas–thermal inertia of the IES. The comparison results are shown in Table 3. Considering gas–thermal inertia, the power support effectively reduces the annual total load shedding of the system and increases the maximum total energy supply, in which the maximum electricity and thermal supplies increase, while the annual energy shortage time and energy shortage probability decrease obviously.
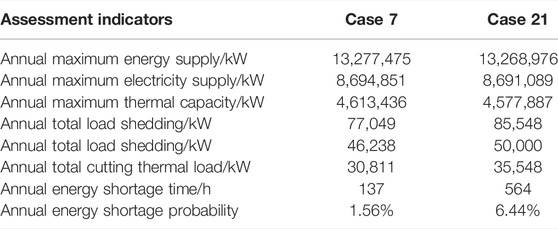
TABLE 3. Comparison results of Case 7 and Case 21.
The annual load shedding data in the scenario are shown in Figure 5, when the annual state of typical components is selected and gas–thermal inertia is included/excluded. In a year, when the total electrical and thermal loads are high, the event of insufficient energy supply is more likely to occur. Compared with Case 21 without gas–thermal inertia power support, Case 7 with gas–thermal inertia included significantly reduces the number of load shedding actions, and the load shedding amplitude decreases to a certain extent. It can be known that considering the power support effect of the gas–thermal inertia of the IES, the size and frequency of load shedding can be reduced simultaneously, the system operation risk caused by heavy load can be effectively alleviated, and the long-term operation reliability of the system can be improved.
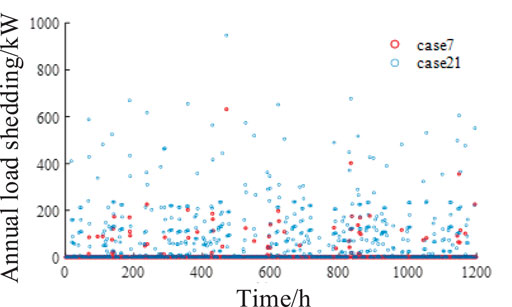
FIGURE 5. Comparative analysis of Cases 7 and Case 21 load shedding. Analysis of the influence of gas–thermal inertia on the reliability assessment of the integrated energy system under the objective of minimizing operation cost.
A 1-year long-term reliability assessment is carried out with the goal of minimizing the operating cost and including/excluding the gas–thermal inertia of the IES. The results are shown in Table 4. Considering the power support of gas–thermal inertia, the annual operating cost of the system is significantly reduced, and the economy is optimized. At the same time, the maximum energy supply of the system is increased, the amplitude, time, and frequency of load shedding are reduced correspondingly, and the reliability of the IES is obviously improved.
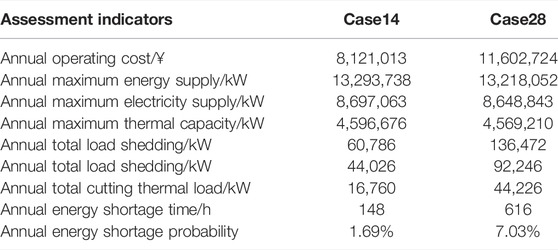
TABLE 4. Comparison results of Case 14 and Case 28.
The annual load shedding data in the scenario are shown in Figure 6, when the annual state of typical components is selected and gas–thermal inertia is included/excluded (in order to highlight the difference between Case 28 and Case 14, the data of the first 2 months with higher total electrical and thermal loads are selected for comparison).
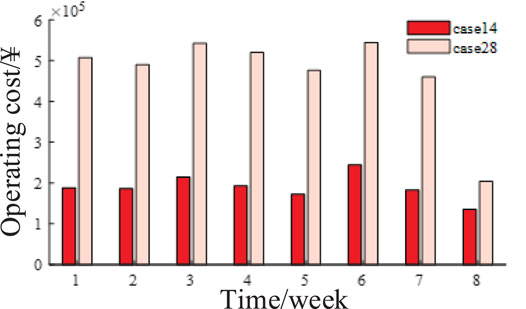
FIGURE 6. Comparative analysis of annual output cost between Case 14 and Case 28.
Compared with that of Case 28 without gas–thermal inertia power support, the operating cost of Case 14 with gas–thermal inertia is significantly reduced due to the reduction in electrical and thermal load compensation expense. It can be known that the system operation cost can be reduced and the system operation economy can be improved considering the power support effect of the gas–thermal inertia of the IES.
Comparative Analysis of the Importance of Critical Equipment
The annual total load shedding of each case and the importance assessment indexes of each key equipment are shown in Table 5, considering the power support effect of gas–thermal inertia and calculation results of Case 2 to Case 6. The annual total load shedding is 77,049 kW in Case 7.
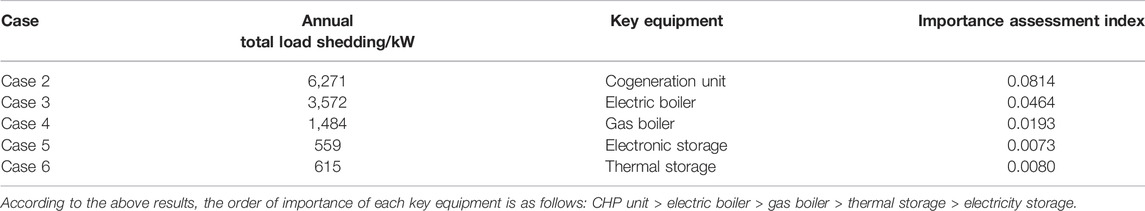
TABLE 5. Results of Case 2 to Case 6.
The importance of different key equipment is related to two aspects. 1) The importance is related to the failure rate of equipment. The higher the failure rate of the equipment, the greater the threat to comprehensive reliability. 2) The importance is related to the critical degree of the equipment. For example, the CHP unit undertakes the power supply and gas supply functions at the same time, and the equipment has a high coupling degree and large power supply. Therefore, when failure occurs, the other equipment is difficult to be provided with power support completely, which has a greater impact on the reliability of the system. As a typical piece of equipment for gas heating, the gas-fired boiler has a low coupling degree and power supply. Therefore, when the gas-fired boiler fails, the synergistic adjustment of the CHP unit, thermal storage, gas inertia, and thermal inertia can buffer its influence on system reliability. The greater the importance assessment index of energy conversion equipment, the greater its impact on system reliability. It is a weak node that should be focused on and protected to reduce system operation risks.
The annual total load shedding of each case and the importance assessment indexes of each key equipment, considering the calculation results of Case 15 to Case 21 without the power support effect of gas–thermal inertia, are as follows. The annual total load shedding is 85,548 kW in Case 21. The results of Case 16 to Case 20 are shown in Table 6.
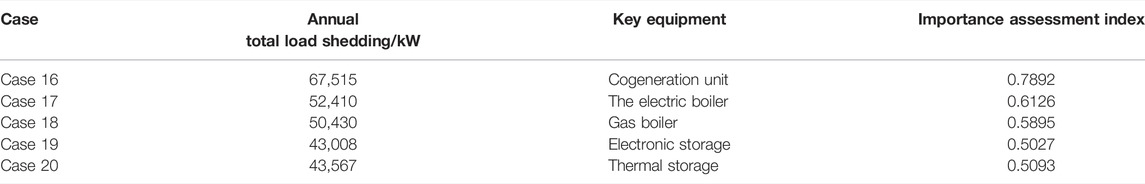
TABLE 6. Results of Case 16 to Case 20.
It can be seen from the above results that the order of importance of each key equipment remains unchanged when the failure rate and critical degree of equipment are affected, including/excluding the gas–thermal inertia characteristics. Therefore, the key equipment with a large importance assessment index is indeed the weak node that the system operator should focus on and protect. The difference is that the importance assessment index of each key equipment is larger when the gas–thermal inertia is excluded, as shown in Figure 7. The reason is that due to the weak power support ability and poor reliability of the system, even a single failure of key equipment may cause serious load shedding consequences. In conclusion, considering the gas–thermal inertia is beneficial to the long-term reliable and stable operation of the system.
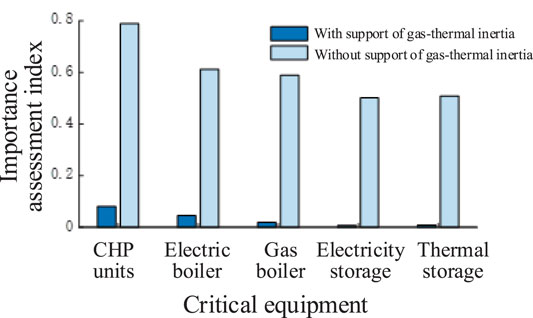
FIGURE 7. Comparative analysis of critical equipment importance index with/without gas–thermal inertial power support.
Conclusion
This study carries out a reliability assessment of the IES considering the rich flexibility of IES gas–thermal slow dynamic characteristics. The reliability assessment model of the IES is established, the influence of gas–thermal inertia on the reliability assessment of the IES is analyzed, and the importance of different key equipment nodes for the long-term stable and reliable operation of the IES is studied. The results of the case verify the rationality of the proposed model, and the following conclusions can be drawn: 1) when the reliability assessment is carried out considering the gas–thermal inertia of the IES, the size and frequency of load shedding can be reduced, the system operation risk caused by heavy load can be alleviated, and the long-term operation reliability of the system can be improved; 2) considering the power support function of the gas–thermal inertia of the IES, the system operation cost can be reduced and the system operation economy can be improved; and 3) the greater the importance assessment index of energy conversion equipment, the greater its impact on system reliability. Therefore, it is the weak node that should be focused on and protected to reduce system operation risks.
The reliability assessment model of the IES with gas–thermal inertia proposed in this article provides a new idea for the reliability assessment of the IES presently. In the next stage, the model-data hybrid drive method will be used to assess reliability and improve the efficiency of reliability assessment to improve the current model-driven assessment method with a relatively slow calculation speed to be further applied to practical complex systems.
Data Availability Statement
The original contributions presented in the study are included in the article/supplementary material, and further inquiries can be directed to the corresponding author.
Author Contributions
All authors contributed to conception and design of the study, organized the database, performed the statistical analysis, wrote the first draft and sections of the manuscript, contributed to manuscript revision, and read and approved the submitted version.
Conflict of Interest
The authors declare that the research was conducted in the absence of any commercial or financial relationships that could be construed as a potential conflict of interest.
Publisher’s Note
All claims expressed in this article are solely those of the authors and do not necessarily represent those of their affiliated organizations or those of the publisher, the editors, and the reviewers. Any product that may be evaluated in this article or claim that may be made by its manufacturer is not guaranteed or endorsed by the publisher.
References
Antenucci, A., and Sansavini, G. (2018). Gas-constrained Secure Reserve Allocation with Large Renewable Penetration. IEEE Trans. Sustain. Energy 9 (2), 685–694. doi:10.1109/tste.2017.2756091
Bansal, M., Khatod, D. K., and Saini, R. P. (2014). “Modeling and Optimization of Integrated Renewable Energy System for a Rural Site[C],” in Proceeding of the 2014 International Conference on Reliability Optimization and Information Technology (ICROIT), Noida, India, February 2014 (IEEE).
Bao, Z., Ye, Y., and Wu, L. (2020). Multi-timescale Coordinated Schedule of Interdependent Electricity-Natural Gas Systems Considering Electricity Grid Steady-State and Gas Network Dynamics[J]. Electr. Power Energy Syst. 118 (1), 1–10. doi:10.1016/j.ijepes.2019.105763
Cheng, C., Sun, Q., Huang, Y., and Dong, Q. (2020). “Reliability Evaluation of Integrated Energy System Based on Coupling Equipment Failure[C],” in Proceeding of the Chinese Automation Congress (CAC), Shanghai, China, November 2020 (IEEE).
Clegg, S., and Mancarella, P. (2016). Integrated Electrical and Gas Network Flexibility Assessment in Low-Carbon Multi-Energy Systems. IEEE Trans. Sustain. Energy 7 (2), 718–731. doi:10.1109/tste.2015.2497329
Fang, J., Zeng, Q., Ai, X., Chen, Z., and Wen, J. (2018). Dynamic Optimal Energy Flow in the Integrated Natural Gas and Electrical Power Systems[J]. IEEE Trans. Sustain. Energy 9 (1), 188–198. doi:10.1109/tste.2017.2717600
Fei, M., Yi, P., Chen, Z., Shi, T., Sha, H., and Zheng, J. (2019). “Research on Multi-Energy Power Flow Calculation of Thermoelectric Coupling Integrated Energy System[C],” in Proceeding of the IEEE Conference on Energy Internet and Energy System Integration (EI2), Changsha, China, November 2019 (IEEE).
Lei, Z., and Yi, L. (2018). Combined Heat and Power Scheduling Utilizing Building-Level Thermal Inertia for Short-Term Thermal Energy Storage in District Heat System[J]. IEEE Trans. Electr. Electron. Eng. 13 (1), 804–814. doi:10.1002/tee.22633
Li, X., Li, W., Zhang, R., Jiang, T., Chen, H., and Li, G. (2020). Collaborative Scheduling and Flexibility Assessment of Integrated Electricity and District Heating Systems Utilizing Thermal Inertia of District Heating Network and Aggregated Buildings[J]. Appl. Energy 258 (1), 1–20. doi:10.1016/j.apenergy.2019.114021
Li, W., Tang, W., Zheng, J., and Wu, Q. H. (2020). “Reliability Modeling and Assessment for Integrated Energy System: a Review of the Research Status and Future Prospects[C],” in Proceeding of the IEEE Sustainable Power and Energy Conference (iSPEC), Chengdu, China, November 2020 (IEEE).
Liu, F., Bie, Z., and Wang, X. (2019). “Energy and Reserve Co-optimization for Combined Electricity and Natural Gas Market[C],” in Proceeding of the IEEE Power & Energy Society General Meeting, Atlanta, United States, August 2019 (IEEE).
Mu, Y., Chen, W., Yu, X., Jia, H., Hou, K., Wang, C., et al. (2020). A Double-Layer Planning Method for Integrated Community Energy Systems with Varying Energy Conversion Efficiencies[J]. Appl. Energy 279 (1), 1–12. doi:10.1016/j.apenergy.2020.115700
Pan, Z., Guo, Q., and Sun, H. (2017). Feasible Region Method Based Integrated Heat and Electricity Dispatch Considering Building Thermal Inertia[J]. Appl. Energy 192 (1), 395–407. doi:10.1016/j.apenergy.2016.09.016
Qin, X., Sun, H., Shen, X., Guo, Y., Guo, Q., and Xia, T. (2019). A Generalized Quasi-Dynamic Model for Electric-Heat Coupling Integrated Energy System with Distributed Energy Resources[J]. Appl. Energy 251 (1), 1–12. doi:10.1016/j.apenergy.2019.05.073
Saedi, I., Mhanna, S., and Mancarella, P. (2021). Integrated electricity and gas system modelling with hydrogen injections and gas composition tracking. Applied Energy 303, 117598. doi:10.1016/j.apenergy.2021.117598
Saldarriaga, C. A., Hincapie, R. A., and Salazar, H. (2013). A Holistic Approach for Planning Natural Gas and Electricity Distribution Networks. IEEE Trans. Power Syst. 28 (4), 4052–4063. doi:10.1109/tpwrs.2013.2268859
Valdivia, P., Barraza, R., Saldivia, D., Gacitúa, L., Barrueto, A., and Estay, D. (2020). Assessment of a Compressed Air Energy Storage System Using Gas Pipelines as Storage Devices in Chile. Renew. Energy 147, 1251–1265. doi:10.1016/j.renene.2019.09.019
Wang, Q., Tao, S., Du, X., Zhong, C., and Tang, Y. (2019). Coordinated Control Strategy for Multi Micro Energy Systems within Distribution Grid Considering Dynamic Characteristics and Contradictory Interests[J]. IEEE Access 7 (1), 139548–139559. doi:10.1109/access.2019.2943926
Wei, N., Lin, L., Yue, X., Junyong, L., Yuan, H., and Pengfei, W. (2020). Reliability Evaluation of Integrated Energy System Based on Markov Process Monte Carlo Method [J]. Power Syst. Technol. 44 (1), 150–158. doi:10.13335/j.1000-3673.pst.2019.0047
Wei, H., Zhang, Y., Wang, Y., Hua, W., Jing, R., and Zhou, Y. (2022). Planning Integrated Energy Systems Coupling V2G as a Flexible Storage. Energy 239, 122215. doi:10.1016/j.energy.2021.122215
Wu, D., Han, Z., Liu, Z., Li, P., Ma, F., Zhang, H., et al. (2021). Comparative Study of Optimization Method and Optimal Operation Strategy for Multi-Scenario Integrated Energy System. Energy 217, 119311. doi:10.1016/j.energy.2020.119311
Keywords: gas–thermal inertia, integrated energy system, load shedding, power support, reliability assessment
Citation: Zhu Y, Sun W, Miao C, Wang Q, Tang Y and Huang Y (2022) Reliability Assessment of the Integrated Energy System Considering Gas–Thermal Inertia. Front. Energy Res. 10:948887. doi: 10.3389/fenrg.2022.948887
Received: 20 May 2022; Accepted: 02 June 2022;
Published: 14 July 2022.
Edited by:
Hao Wang, Monash University, AustraliaCopyright © 2022 Zhu, Sun, Miao, Wang, Tang and Huang. This is an open-access article distributed under the terms of the Creative Commons Attribution License (CC BY). The use, distribution or reproduction in other forums is permitted, provided the original author(s) and the copyright owner(s) are credited and that the original publication in this journal is cited, in accordance with accepted academic practice. No use, distribution or reproduction is permitted which does not comply with these terms.
*Correspondence: Qi Wang, d2FuZ3FpQHNldS5lZHUuY24=