- 1State Key Laboratory of Coastal and Offshore Engineering, Dalian University of Technology, Dalian, China
- 2North China Sea Marine Forecasting Center of State Oceanic Administration, Qingdao, China
To provide basic drift-ice parameters for new-energy structures in ice-infested nearshore waters, an estimation method of the design drift-ice concentration and floe area was established. A total of 700 satellite images in winters from 2010 to 2021 were used to obtain the drift-ice concentration and floe area from 26 sites in the Bohai Sea. The floe area with 90% cumulative probability was selected as the characteristic floe area in each satellite image. Furthermore, the water temperature threshold ranging from −1.6 °C to −0.5 °C was adopted by considering the drift-ice freezing/melting states because of different salinity values in nearshore waters. The upper limit values of the ice concentration and characteristic floe area at the lowest water temperature of −1.6 °C were finally used as the design drift-ice indexes. The maximum design ice concentrations (floe area) in the Liaodong Bay, Bohai Bay, and Laizhou Bay were 96% (0.43 km2), 91% (0.39 km2), and 87% (0.29 km2), respectively. The design ice concentration at the bay bottom was higher than that near the mouth. The design floe area in the Liaodong Bay and Bohai Bay increased with latitudes, but the trend was opposite in the Laizhou Bay. The method developed in the current study has universal applicability, which can be extended to other ice-cover waters and specific structure designs by adjusting the cumulative probability threshold and the water temperature threshold.
1 Introduction
Anthropogenic emissions of greenhouse gases, especially CO2 from fossil fuel combustion, exacerbate global warming (Lacis et al., 2010; Montzka et al., 2011). To sustainably limit global warming, China declared striving to peak carbon emissions by 2030 and to achieve carbon neutrality by 2060 (Li et al., 2022; Liu et al., 2022). As a critical economic zone in China that is seriously threatened by sea-level rises due to global warming, the Bohai Economic Rim needs to develop new energies to replace fossil fuels in the electric industry to reduce CO2 emissions (Zeng et al., 2008; Wang, 2010; Sayigh, 2021). The new energies along the coast are from wind, solar, wave, tidal, current, nuclear, etc. Along the Bohai coast, the seasonal resources of wind energy (Li et al., 2016; Yu et al., 2019), solar thermal energy (Chao et al., 2014), and wave energy (Zhang et al., 2009; Wang et al., 2016) are abundant. As one of the clean energies, nuclear power has also been developed in Bohai coastal areas (Yan et al., 2011).
The wave, tidal, and current energies for power generation are limited because of about a four-month ice period every winter in the coastal waters of the Bohai Sea. To the authors’ knowledge, there has been no report on the utilization of tidal and current energies in the Bohai Sea. Zhang et al. (2020) reported that sea ice in winter reduces average wave energy fluxes by approximately a half in the Bohai Bay and Laizhou Bay and up to 80% in the Liaodong Bay. Wind energy supply is highest from March to May, and solar energy supply peaks between May and July. The variance makes the joint utilization of wind and solar energy superior to the exclusive utilization of wind or solar energy. The combined guarantee rate of wind and solar energy is higher from March to July and is lower in other months (Chao et al., 2014). To manage the conflict between air pollution and an increasing electricity demand, the Chinese central government has chosen the option of building nuclear power plants along the coast of the Bohai Sea (Qi et al., 2020). Therefore, the new energies in nearshore areas in the Bohai Sea are wind farms, photovoltaic plants, and nuclear power plants or platforms that are operated, under construction, and planned.
For the safe operation of industrial activities in Bohai, it is necessary to consider the impact of sea ice (Yang, 2000; Ouyang et al., 2019). Ice engineering in the Bohai Sea has developed since the 1980s, and Chinese scholars have conducted many studies on sea ice problems (Gu et al., 2013; Zhang et al., 2017). Under the background of reducing carbon emissions, more offshore wind farms, photovoltaic plants, and even nuclear power platforms will be built in the Bohai Sea. The sea ice issues in new-energy exploitation have become research hotspots in recent years. Zhu et al. (2018) proposed a control method of wind-turbine vibration in an ice zone based on a three-dimensional pendulum-tuned mass damper. Wang A. et al. (2021) provided a scheme to estimate sea ice design parameters for offshore wind farms. Zhu et al. (2021) analyzed ice-induced frequency lock-in phenomena of offshore wind turbines under various ice conditions through a coupled method. Liu et al. (2021) conducted ice condition monitoring around China’s first nuclear power plant in the ice zone. They found that the main sea ice risks of cooling water sources were located near the cooling water intakes. Wang Y. et al. (2021) carried out an optimal design of the mooring system of a floating nuclear power platform in ice zones.
The interaction of sea ice with offshore structures is an important part of ice engineering (Tuhkuri and Polojarvi, 2018; Hendrikse and Nord, 2019). The ice force on offshore structures cannot be greater than the available environmental driving forces. Driving forces from the dynamic impact of a drift-ice floe on a structure depend on the floe’s kinetic energy, which is determined by the floe velocity, density, thickness, and area. Moreover, when a large-area floe stops in front of the structure, the wind and current driving forces are determined by wind and current drag shear stresses and floe area. When the environmental driving force is great enough to make the ice fail against the structure, the ice force on structures is the ice failure force; otherwise, the ice force on structures is equal to the environmental driving force (Kreider and Vivatrat, 1983; Sanderson, 1988). Therefore, the design ice force on a structure should be determined as the smaller one between the ultimate failure force of floes and the ultimate environmental driving force.
Between the 1980s and 2010s, ice-resistance designs of offshore structures in the Bohai Sea were generally based on the ultimate failure force of ice sheets because ice conditions were more severe and the ice sheets were thicker than those in the present (Zhang, 1989; Yang, 2000). With global warming, the ice season shortens, the ice thickness decreases, and the drift ice occupies most of the existing sea ice in winter in the Bohai Sea (Gong et al., 2007; Yan et al., 2019; Ma et al., 2022). With the increase in drift ice in the Bohai Sea, ice-resistance design criteria only based on the ultimate failure force of floes may lead to overprotection due to less available environmental driving forces than those required to cause ice failure, resulting in economic waste. Nowadays, it is sensible for ice-resistance designs to determine the ultimate environmental driving forces on offshore structures in the Bohai Sea. Ice concentration is a fundamental parameter characterizing sea ice conditions, and floe area is a necessary input parameter for estimating environmental driving forces, so their design values should be determined (Li et al., 2017).
The prevention and control of sea ice disasters require a large amount of ice data (Zhang et al., 2013). Yang (2000) summarized general sea ice conditions in the Bohai Sea by statistical analysis of long-term observations during the 1980s–1990s. Most of the observations were on a local scale at that time, and drift-ice conditions could not be obtained because of the shortage of large-scale observation technology. Nowadays, remote sensing techniques have matured in long-term continuous sea ice monitoring in the Bohai Sea (Yan et al., 2020). China’s Huanjing (HJ), Gaofen (GF), and China–Brazil Earth resource satellites (CBERS) can provide large-scale remote sensing images of sea ice in the Bohai Sea with a high spatiotemporal resolution, making it possible to determine the design indexes of ice concentration and floe area based on a long enough time series of annual data, providing references for the determination of the environmental driving force (Zhou et al., 2010; Wang et al., 2020).
With the aim of providing basic drift-ice parameters for new-energy structures in ice-infested nearshore waters, an estimation method of design drift-ice concentration and floe area was established in the present study. The remote sensing images from HJ, GF, and CBERS satellites in winters from 2010 to 2021 were used to obtain the drift-ice concentration and floe area near 26 sites in nearshore waters of the Bohai Sea. To achieve the universal applicability of the method, a cumulative probability threshold for characteristic floe area determination and a water temperature threshold were introduced, which can be adjusted to extend to other ice-cover waters and specific structure designs. The article is organized as follows: Section 2 introduces the study area, data, and data processing and analysis methods. In Section 3, the results of the design ice concentration and floe area in 26 sites and their latitude variations are shown. The discussion on the selection criteria for the cumulative probability threshold and the water temperature threshold, and the limitations and prospects of the present study are provided in Section 4. The main conclusions of the present study are summarized in Section 5.
2 Materials and Methods
2.1 Study Area
The Bohai Sea is a semienclosed inland sea in China, located at approximately 37°07′–41°00′N, 117°35′–121°10′E. It comprises three bays: the Liaodong Bay in the north, the Bohai Bay in the west, and the Laizhou Bay in the south.
Effective wind energy is highest from March to May and lowest in August along the coastal area of the Bohai Sea (Chao et al., 2014). Long-term average wind power density (W/m2) was derived from the wind conditions at 100 m from 1979 to 2013 (Li et al., 2016), which showed that the mean wind power density over the Bohai Sea and at several potential wind farm sites is 300–500 W/m2 (Figure 1A). No report was given on the spatial distribution of the annual solar energy (kWh/m2) in the Bohai Sea. However, the annual solar energy near the Bohai coast was 118 kWh/m2, which can be obtained from the coastal results (Chao et al., 2014). There is an operating nuclear power plant and a building in the ice-infested coastal area in the Bohai Sea.
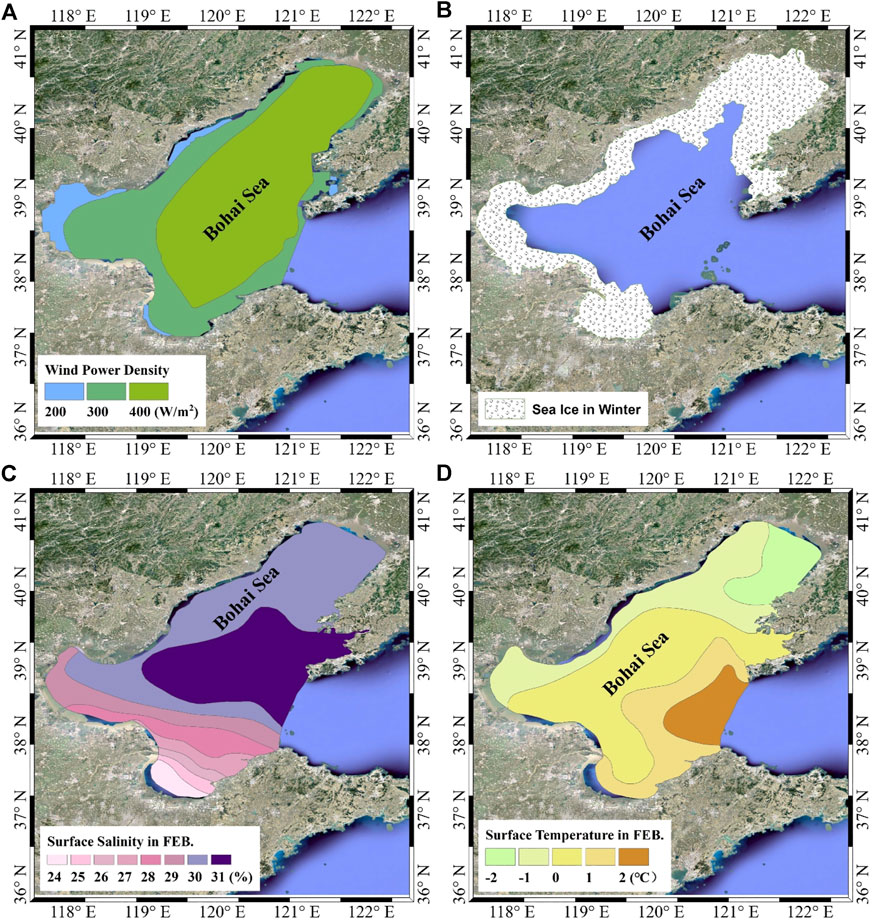
FIGURE 1. General natural environmental conditions in the Bohai Sea in winter. (A) The mean wind power density derived from the wind conditions at 100 m from 1979 to 2013; (B) the sea ice distribution from a satellite image on 19 January 2022; (C) the surface salinity distribution in February; (D) the surface temperature distribution in February.
The sea ice in the Bohai Sea does not reduce the wind and solar energies; however, it affects the safe operations of wind farms, photovoltaic plants, nuclear power plants or platforms. From the 1980s to the 1990s, the sea ice condition variations in the Bohai Sea had six characteristics from spatial distribution and four characteristics from temporal distribution (Yang, 2000). These spatial characteristics were that the ice condition in the north is more severe than that in the south, that along the coast is more severe than that in the middle of the sea, and drift ice is usually drifted from the coast. The temporal distribution mainly was that the air temperature, wind, and tidal current made the ice occur in the morning and disappear in the afternoon; sea ice will increase and thicken abruptly as the cold air mass or a cold front passes; the air temperature rises after the passage of the cold air mass or cold front; and the ice will melt or drift elsewhere. Nowadays, the ice characteristics mentioned above still exist. Still the ice season shortens, the ice thickness decreases, and the drift ice occupies most of the existing sea ice in winter in the Bohai Sea because of global warming (Gong et al., 2007; Yan et al., 2019; Ma et al., 2022). Figure 1B gives the ice conditions from a satellite image on 19 January 2022.
The water temperature indicates the drift ice’s freezing/melting states. However, water salinity influences the freezing point temperature of water. Because many rivers discharge into the Bohai Sea, approximately 8–9×10¹⁰ m3 of freshwater flows into the Bohai Sea each year (Yang, 2000). The water temperature and salinity in the Bohai Sea are not uniform. The Institute of Geography of the Chinese Academy of Sciences (1990) summarized that the salinity of seawater in the Liaodong Bay is the highest, followed by that of the Bohai Bay and that of the Laizhou Bay, which is the lowest (Figure 1C). For the surface temperature of seawater, the opposite is true (Figure 1D).
In the operation areas of new-energy structures, structures are more likely to encounter drift ice than landfast ice. As a result, the ice-resistance design criteria transit from solely based on the ultimate ice failure forces, which were generally employed in the last century, to be based on the smaller one between the ultimate ice failure forces and the ultimate environmental driving forces. After comparing the two ultimate ice forces, the final design scheme can be determined. Therefore, the design values of the drift-ice parameters are required, including the floe area, drift-ice concentration, thickness, velocity, and direction.
To determine the design ice concentration and floe area covering the whole Bohai Economic Rim, high-resolution satellite images were used as the basis to obtain data. It is necessary to select characteristic sites along the coast of the Bohai Sea. Since the 1980s, many large coastal structures in bays, such as dams, ports, and waterways, have changed the morphology and dynamic environments of the coastal waters, influencing the drift-ice movement noticeably (Shi et al., 2016; Xu et al., 2016). Therefore, the selection of characteristic sites in the present study considers the influence of the local bays and large built coastal structures. A total of 26 sites along the coast around the Bohai Sea (Figure 2) were selected as coastal base points to explore the ice concentration and floe area in nearshore waters of the Bohai Sea (Li et al., 2017). The location information is listed in Table 1. The satellite remote sensing images of ice conditions within approximately 20 km from the coast in these sites in winters were collected, with the seawater temperature data recorded from the nearest ocean stations on corresponding days.
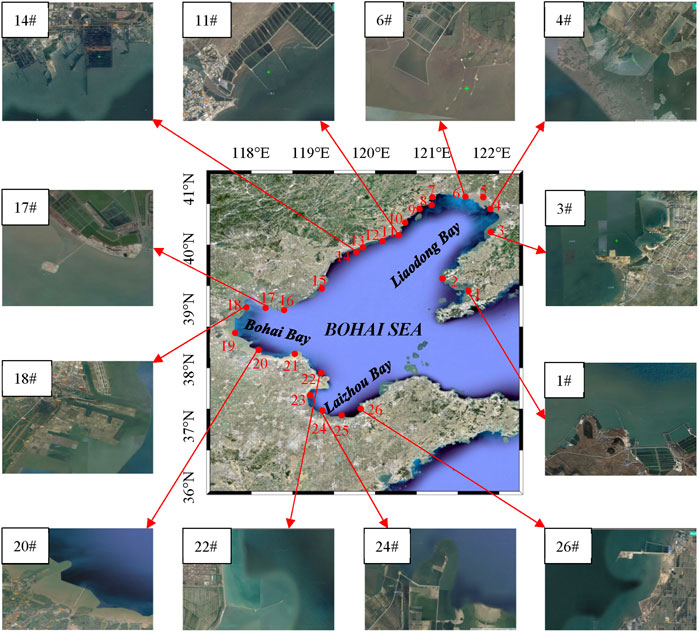
FIGURE 2. Positions of the 26 sites selected as coastal base points in the Bohai Sea (red circles). The red number is the site number. Also shown are satellite images of some of these sites.
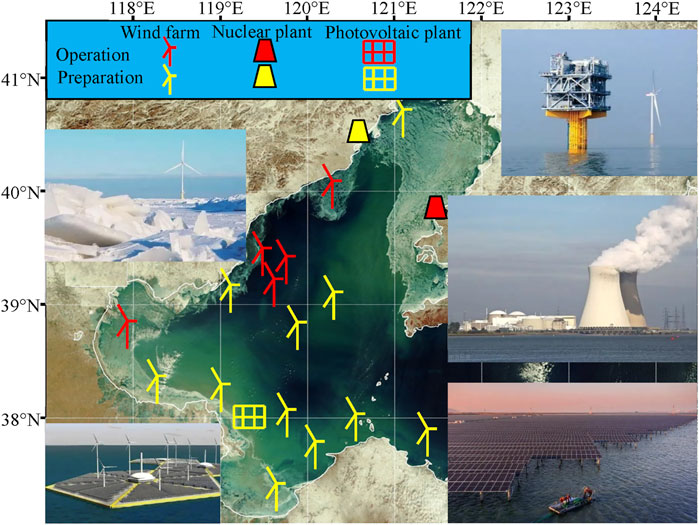
With the requirements of reducing CO2 emissions, many offshore new-energy power generation plants have been operated and projected in the Bohai Rim (Figure 3). These new-energy structures located in ice-infested waters need to select the ultimate ice failure forces or ultimate environmental driving forces as the basis of ice-resistance designs. Therefore, the characteristics of the drift ice in nearshore waters were required. The study area (Figure 2) covers the most operating and projected areas of these new-energy structures. The method and relevant results of the present study can provide references for ice-resistance designs of the projected new-energy structures in these areas.
2.2 Satellite Images and Surface Water Temperature Data
A total of 700 satellite remote sensing images of ice conditions during the severe ice periods of each winter from 2010 to 2021 in the 26 selected sites were provided by the North China Sea Marine Forecasting Center of State Oceanic Administration. Because of the severer ice conditions in the Liaodong Bay than in the Bohai Bay and Laizhou Bay in winter, the number of satellite images of the Liaodong Bay was much more than the numbers of satellite images of the Bohai Bay and Laizhou Bay. The resolution of the images was 1920 × 956 pixels. All satellite images were obtained from five satellites: the HJ-1A, HJ-1B, GF-1, GF-6, and CBERS-04.
The HJ-1A/B, China’s optical remote sensing satellites launched in September 2008, are dedicated to environmental and disaster monitoring and prediction. The HJ-1A is equipped with a 30-m-resolution charge-coupled device (CCD) camera and a 100-m-resolution hyperspectral imager, and the HJ-1B has a 30-m-resolution CCD camera and a 150/300-m-resolution infrared sensor. The GF-1, launched in April 2013, is the first satellite of China’s high-resolution Earth observation system, with a design service life of five to eight years. The GF-1 is equipped with two 2-m-resolution panchromatic/8-m-resolution multispectral sensors and four 16-m-resolution wide-field multispectral sensors. The GF-6 launched in June 2018, a low-orbit optical remote sensing satellite networked with the GF-1, is China’s first high-resolution satellite for precise agriculture observation, with a design service life of eight years. The GF-6 has a 2-m-resolution panchromatic/8-m-resolution multispectral sensor and a 16-m-resolution wide-field multispectral sensor. The CBERS-04, launched in December 2014, is equipped with four cameras. Among the four cameras, the 5/10-m-resolution panchromatic sensor and the 40/80-m-resolution infrared sensor were designed by China, and the 20-m-resolution multispectral sensor and the 73-m-resolution wide-field imager were designed by Brazil.
The surface water temperature data were obtained from the field observations of 21 ocean stations near the 26 selected sites. The daily mean value of surface water temperature from the nearest ocean stations on the corresponding day of a satellite image was determined for further analysis.
2.3 Data Preprocessing
The ice concentration and floe area were obtained from satellite images based on the method proposed by Lu and Li (2010). The image processing method has also been widely used in sea ice retrieval from satellite images (Su et al., 2013; Hwang et al., 2017). A color satellite image was first transformed into a grayscale image and was then transformed into a binary copy using thresholding segmentation. All individual floes were identified from the binary copy of the image (see Figure 4). The ice concentration was calculated by dividing the number of white pixels by the total number of pixels in the binary copy. The area of each floe was obtained based on the pixel cover area of the floe in the binary copy after conversions to the actual size.
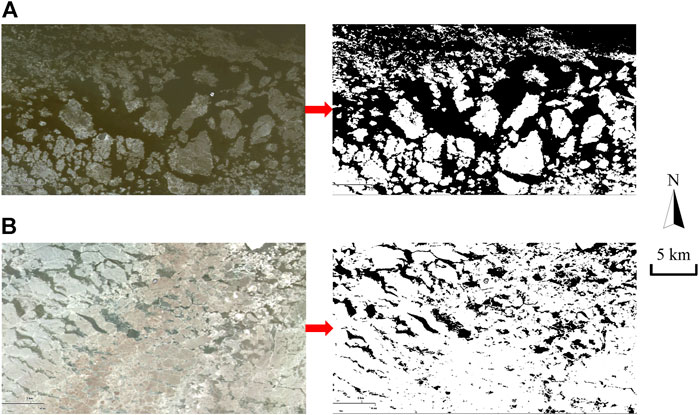
FIGURE 4. Examples of transformations from satellite images at (A) site 22 on 2 February and (B) site 6 on 1 February 2016 to black–white binary copies after thresholding segmentation. In binary copies, white represents ice and black represents water. Also shown are the scale and north arrow of the images.
Floe area data were then further processed. In general, the larger the floe area is, the lower is the frequency of occurrence (Toyota et al., 2006). For the purpose of safe design, a more conservative prediction is preferred. A risk parameter was usually introduced to determine the designed value, and in the current study, the parameter was set at 90% in the cumulative probability distribution of floe size. Figure 5 shows an example of a satellite image’s characteristic floe area determination. The floe area corresponding to the cumulative probability of 90% was selected as the characteristic floe area.
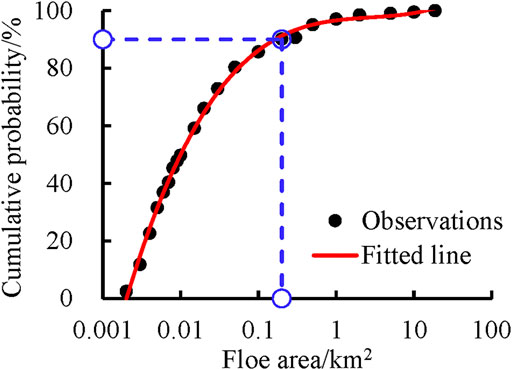
FIGURE 5. Determination of the characteristic floe area based on the satellite image at site 5 on 10 February 2017. The characteristic floe area of this case is 0.20 km2.
3 Results
3.1 Design Ice Concentration and Floe Area
The relationships between ice concentration and water temperatures at the 26 sites were analyzed firstly. Because the analysis processes for different sites are similar, ice concentration versus water temperatures at two sites of the Liaodong Bay, one site of the Bohai Bay, and one site of the Laizhou Bay was selected as case studies. The results of all 26 sites were provided in Supplementary Material.
The influence of water temperature on the drift ice in the Bohai Sea is rarely mentioned. Generally, the ice thermal dynamic process always assumes that the surface water temperature under the ice is the same as the freezing point. This assumption is inappropriate for drift ice because water temperature varies in different regions. In inland seas such as the Bohai Sea, even in winter, the water temperature in some regions is still higher than the freezing point. Most ice floes are not formed where they stand but drift from other areas. The freezing/melting states of ice floes depend on local hydro-meteorological conditions.
Generally, the salinity in coastal waters is lower than that in offshore waters because of the freshwater supply from river discharges along the coastal zone. Salinity determines the water freezing point. Water temperature combined with salinity can be used to determine the local drift-ice freezing and melting situation. The freezing point of ice floes formed in coastal areas was assumed as a threshold of −0.5 °C. Ice floes drifted to other places that would grow if water temperatures < −0.5 °C and melt if water temperatures > −0.5 °C. Moreover, Yang (2000) reported that the lowest water temperature was approximately −1.6 °C in the Bohai Sea. The two water temperature thresholds of −0.5 °C and −1.6 °C correspond to the highest and lowest freezing points of seawater in the Bohai Sea.
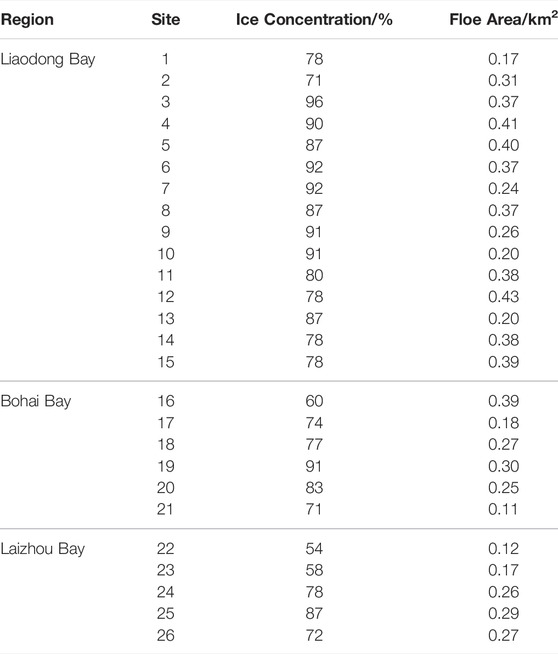
Figure 6 plots ice concentration against water temperatures at the four sites. The freezing/melting states of ice floes were marked according to water temperatures. Although the data were somewhat scattered, upper envelope curves showed significant rising trends of ice concentration with decreasing water temperatures. According to the upper envelope curve of the ice concentration against water temperatures determined, the upper limit value of the ice concentration at the lowest water temperature of −1.6 °C (the black cross in Figure 6) was selected as the design drift-ice concentration. The design ice concentrations at the 26 sites are summarized in Table 2.
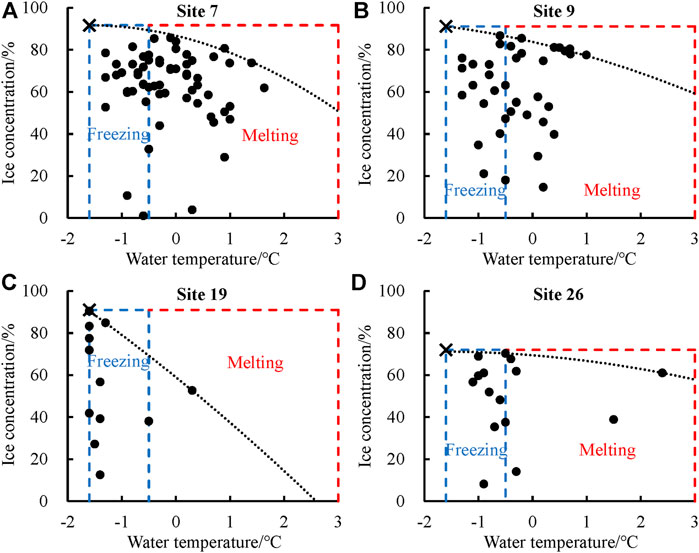
FIGURE 6. Ice concentration versus water temperatures at the four sites ((A) site 7 in the Liaodong Bay, (B) site 9 in the Liaodong Bay, (C) site 19 in the Bohai Bay, and (D) site 26 in the Laizhou Bay). The black dotted line is the upper envelope curve of data points. The blue and red frame areas represent drift ice’s freezing and melting cases. The value of the black cross is the design ice concentration.
Figure 7 plots the characteristic floe area against water temperatures at the four sites. As references, ice floes’ freezing/melting states were also marked according to water temperatures. Upper envelope curves showed significant rising trends of the characteristic floe area with decreasing water temperatures. According to the upper envelope curve of the characteristic floe area against water temperatures, the upper limit value of the characteristic floe area at −1.6 °C (the black cross in Figure 7) was selected as the design floe area. All design characteristic floe areas at the 26 sites are also summarized in Table 2.
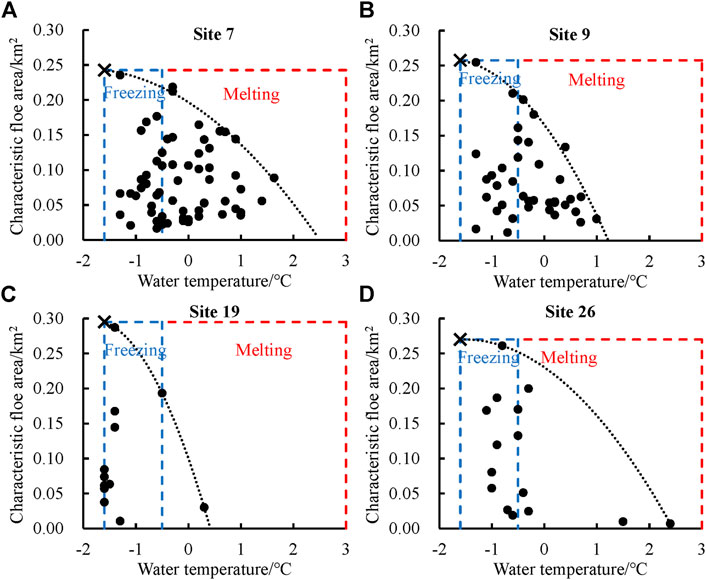
FIGURE 7. Characteristic floe area versus water temperatures at the four sites ((A) site 7 in the Liaodong Bay, (B) site 9 in the Liaodong Bay, (C) site 19 in the Bohai Bay, and (D) site 26 in the Laizhou Bay). The black dotted line is the upper envelope curve of data points. The blue and red frame areas represent drift ice’s freezing and melting cases. The value of the black cross is the design floe area.
3.2 Latitudinal Variations of Design Ice Concentration and Floe Area
3.2.1 Design Ice Concentration Variation With Latitudes
Figure 8 shows the latitudinal variations of the design ice concentration in the Bohai Sea. Along the latitude from low to high are the Laizhou Bay, Bohai Bay, and Liaodong Bay. The overall trend of each bay was that the design ice concentration at the bottom of the bay was larger than that at the bay mouth.
The design ice concentration in the Laizhou Bay decreased with the increase in latitude. At the bottom of the bay, the nearshore seawater was easy to freeze and ice floes accumulated easily, affected by cold north winds. Therefore, the ice conditions at the bottom of the bay were more severe than those at the mouth of the bay. When the latitude was 37.85°N, the design ice concentration was the lowest. This position corresponded to site 22 in the Laizhou Bay, which was located at the bay mouth and affected by the flow of the Yellow River into the Bohai Sea, resulting in the low ice concentration here.
In the Bohai Bay, the regions with the highest design ice concentration appeared at the bottom of the bay, where the design ice concentration was up to 91%. In contrast, the design ice concentration at the bay mouth was lower. The main reason for this distribution of the design ice concentration was the low air temperature in high-latitude areas and ice movement by the north winds.
The bay mouth is located southeast of the Liaodong Bay and at low latitudes. The design ice concentration in the Liaodong Bay increased gradually with latitudes. Severe ice conditions appeared at high latitudes, mainly because of low air temperatures.
Quadratic functions were used to depict the upper envelope curves of the design ice concentration versus the latitude in the three bays of the Bohai Sea (Figure 8). Correspondingly, the equations of these upper envelope curves are provided as follows:
where Cd is the design ice concentration, in %; and θ is the latitude, in °N. Equation 1 can be used to determine the design ice concentration in the Bohai Sea at different latitudes.
3.2.2 Design Floe Area Variation With Latitudes
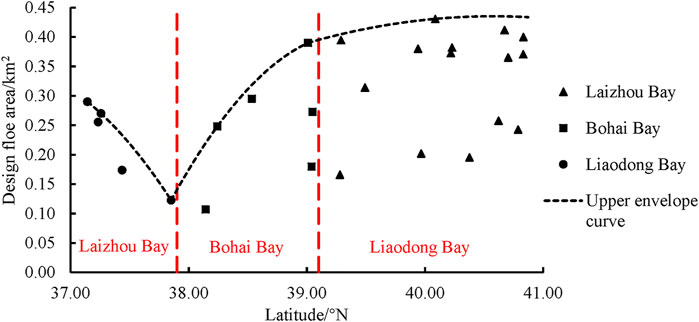
Figure 9 shows the latitudinal variations of the design floe area in the Bohai Sea. The general variation trend of the design floe area with latitude was approximately similar to that of the design ice concentration. The contributing factor for this trend was similar to that of the design ice concentration variation with latitude.
With the latitude increase, the design floe area decreased gradually in the Laizhou Bay. When the latitude is 37.85°N, the design floe area is the smallest. This position is near the estuary of the Yellow River. Under the influence of river water flow, the design floe area is the smallest, only 0.12 km2.
In the Bohai Bay, the regions with a larger design floe area were located at the bottom of the bay and north of the bay mouth, where the design floe area was up to 0.39 km2. In contrast, the design floe area at the south of the bay mouth was the smallest. The main reason for this distribution of design floe area was the low air temperature in areas with high latitudes.
The design floe area in the Liaodong Bay showed a slightly increasing trend with latitude. The scattered latitudinal distribution of the design floe area resulted from the influence of temperature variation with latitude. In addition, the direction from the bay mouth to the bay bottom was opposite to the prevailing wind direction.
Quadratic functions were used to describe the upper envelope curves of the design floe area varying with the latitude in the three bays of the Bohai Sea (Figure 9). The equations of these upper envelope curves are provided as follows:
where Ad is the design floe area, in km2. Equation 2 can be used to determine the design floe area in the Bohai Sea at different latitudes when the characteristic floe area corresponds to the cumulative probability of 90%.
4 Discussion
4.1 Threshold Selection Criteria
The method developed in the present study has universal applicability, although the data used are from the Bohai Sea in China. When the method is extended to other ice-cover waters or specific structure designs in the future, the environmental conditions in the projected engineering areas and the ice-resistance grade requirements of structures should be considered specifically. Therefore, it is necessary to adjust the relevant thresholds of the method. There are two relevant thresholds, i.e., the cumulative probability threshold for characteristic floe area determination and the water temperature threshold. The selection criteria for the two thresholds are discussed as follows.
4.1.1 Cumulative Probability Threshold of Characteristic Floe Area
Engineering design criteria require that ice-resistance designs of a specific offshore structure comprehensively consider its type, fixing way, dimensions, design grade, etc. (ISO, 2019). For offshore structures with higher design requirements, the cumulative probability of floe area to determine the characteristic index should select a higher value.
Figure 10 shows the characteristic floe area versus water temperature for 90 and 100% cumulative probabilities of floe area at site 26 in the Laizhou Bay. For the characteristic floe area of 90 and 100% cumulative probabilities, the design floe areas determined were 0.27 and 18.65 km2, respectively. The difference between them is approximately two orders of magnitude, which leads to a huge difference in environmental driving forces and affects the selection of ultimate ice force mode. Hence, for engineering practice, the characteristic floe area must be selected according to the design requirement of the specific structure.
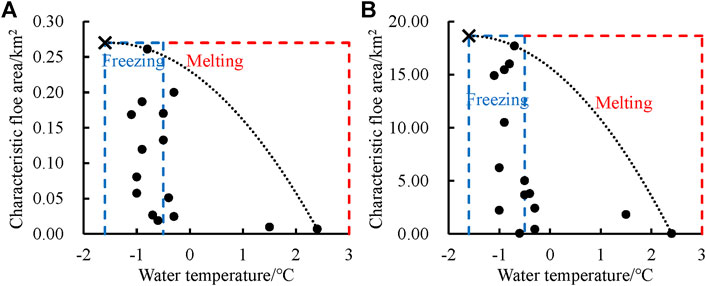
FIGURE 10. Characteristic floe area versus water temperatures at site 26 of the Laizhou Bay. The characteristic floe area corresponds to (A) 90% and (B) 100% cumulative probabilities. The black dotted line is the upper envelope curve of data points. The blue and red frame areas represent drift ice’s freezing and melting cases. The value of the black cross is the design floe area.
4.1.2 Water Temperature Threshold
When the ice floes drift to waters where the water temperature is higher than the floes’ freezing point, the ice temperatures are gradually raised by the seawater here. When the ice floes drift to waters where the water temperature is lower than or equal to the floes’ freezing point, the ice temperatures gradually decrease and the thickness increases. Therefore, water temperature can be taken as a key hydrological control factor to classify the area where drift-ice floes stand into a melting zone or freezing zone. Water temperature is included in the control factors of drift-ice design parameters.
In terms of engineering designs, when the drift ice is in the melting zone, its design ice temperature is deemed to be close to the freezing point of ice floes; when the drift ice is in the freezing zone, its design ice temperature can be approximated as the mean of local surface water temperature and air temperature. Ice temperature affects ice strength, which is an essential control factor of the maximum ice force on a structure in the collision process of ice floes on a structure (Cammaert and Tsinker, 1981; Sanderson, 1988; Li et al., 2011).
The method developed in the present study is based on the data from the Bohai Sea. A large amount of freshwater supply from river discharges leads to local salinity reduction in nearshore waters of the Bohai Sea. Salinity increases to approximately 31‰ in central Bohai (Yang, 2000). Therefore, the water temperature threshold ranging from −1.6 °C to −0.5 °C was selected in the present study, corresponding to the lowest and highest freezing points of seawater in the Bohai Sea. When the local water temperature is higher than −0.5 °C, ice floes drifting here are considered melting; otherwise, ice floes drifting here are deemed freezing. The upper limit values of the drift-ice parameters at the water temperature of −1.6 °C were selected as the basis of ice-resistance designs. For ice-resistance designs in other seas, the water temperature threshold should be selected according to the range of local seawater freezing points in the projected engineering area.
4.2 Limitations and Prospects
Satellite observations are influenced by clouds. The existence of clouds introduced errors in distinguishing ice and water when processing satellite images by thresholding segmentation. The frequency of satellite observations also introduced uncertainties. In the past, the number of satellites was limited and the revisit period of a high-resolution satellite was usually several days. Nowadays, although the increase in the number of satellites reduces the revisit period, it is still not guaranteed that there will be clear satellite images every day. As a result, it is uncertain whether the clear satellite images are obtained on the day with the most severe ice conditions. Thus, the present study used the upper envelope curves of data points rather than the return period method for the designs. Using long-term datasets can ensure that future observations are lower than the upper envelope curve. Therefore, the design indexes of drift-ice concentration and floe area obtained by the present method can be considered reliable.
Meteorological, hydrological, and topographical conditions jointly affect ice formation in restricted waters, and relevant investigations have already obtained much achievement (Yang, 2000; Shi et al., 2016; Xu et al., 2016). However, there is a gap between the drift-ice behavior and design drift-ice parameters. The behavior of drift ice is driven by the ice thermal and dynamic processes, whereas the design parameters depend on the structures and need the upper limit. At present, existing knowledge is not enough to fill this gap. More efforts are required in the future to fill the gap between the drift-ice behavior and design drift-ice parameters.
5 Conclusion
To provide an estimation method of the design ice concentration and floe area for ice-resistance designs of offshore new-energy power generation structures in nearshore waters of the Bohai Sea, 700 satellite images in winters from 2010 to 2021 were used to obtain the ice concentration and floe area near 26 sites in nearshore waters of the Bohai Sea. Each satellite image’s floe area of 90% cumulative probability was selected as the characteristic floe area. A water temperature threshold of −0.5 °C corresponding to the freezing point of local seawater was introduced to consider the local floes’ freezing/melting states. The relations between water temperature and ice concentration as well as water temperature and characteristic floe area were further analyzed. Upper limit values at the lowest water temperature of −1.6 °C of both the ice concentration and the characteristic floe area were selected as design drift-ice indexes. Latitudinal variations of design ice concentration and floe area were also analyzed.
Results showed that the upper limit values of both the ice concentration and the characteristic floe area had an increasing trend with decreasing water temperatures. The design ice concentration in different sites in the Liaodong Bay, the Bohai Bay, and the Laizhou Bay ranged from 71 to 96%, 60–91%, and 54–87%, respectively. Correspondingly, the design floe area in the three bays ranged from 0.17 to 0.43 km2, 0.11–0.39 km2, and 0.12–0.29 km2. The design ice concentration at the bottom of the bay was higher than that at the bay mouth for the three bays. The design floe area had a rising trend with increasing latitudes in the Liaodong Bay and Bohai Bay but had a reducing trend in the Laizhou Bay.
The estimation method of the design ice concentration and floe area provided in the present study has universal applicability and can be used as a reference for ice-resistance designs of offshore structures. The characteristic floe area determined by different cumulative probabilities will result in a quite massive difference in the design floe area. Water temperature threshold selection affects the determination of ice floes’ freezing/melting states. For engineering practice, the characteristic floe area must be selected according to the design requirement of a specific structure, and the water temperature threshold shall be selected according to local hydrological conditions.
Data Availability Statement
The original contributions presented in the study are included in the article/Supplementary Material. Further inquiries can be directed to the corresponding authors.
Author Contributions
ZL: conceptualization, resources, methodology, data curation, formal analysis, writing—original draft, supervising, and funding acquisition; YX: investigation, data curation, formal analysis, writing—original draft, editing, visualization, literature, and data collection; QW: validation, software, writing—review, and funding acquisition; GL: conceptualization, resources, and writing—review; PL: conceptualization, writing—review, and funding acquisition; SZ: literature and data collection; XC: literature and data collection. All authors have read and agreed to the published version of the manuscript.
Funding
This work was supported by the Fundamental Research Funds for the Central Universities (DUT21RC3086), the Liaoning Revitalization Talents Program (XLYC2007033), and the National Natural Science Foundation of China (41906198, 51979024).
Conflict of Interest
The authors declare that the research was conducted in the absence of any commercial or financial relationships that could be construed as a potential conflict of interest.
Publisher’s Note
All claims expressed in this article are solely those of the authors and do not necessarily represent those of their affiliated organizations or those of the publisher, the editors, and the reviewers. Any product that may be evaluated in this article or claim that may be made by its manufacturer is not guaranteed or endorsed by the publisher.
Acknowledgments
We are thankful for the comments and advice that the reviewers and editors gave. They helped in improving the quality of this manuscript.
Supplementary Material
The Supplementary Material for this article can be found online at: https://www.frontiersin.org/articles/10.3389/fenrg.2022.947153/full#supplementary-material
References
Cammaert, A. B., and Tsinker, G. P. (1981). “Impact of Large Ice Floes and Icebergs on Marine Structures,” in Proceedings of 6th International Conference on Port and Ocean Engineering under Arctic Conditions, Quebec, Canada, 27–31 July 1981, Ⅱ, 652–662. Available online at: https://www.poac.com/Papers/POAC81_V2_all.pdf.
Chao, J., Gu, W., Li, Y., Xu, Y., Zhang, H., and Tao, J. (2014). Temporal and Spatial Distribution Characteristics of the Effective Wind and Solar Energy in the Bohai Bay Coastal Area. J. Renew. Sustain. Energy 6 (4), 043133. doi:10.1063/1.4893435
Gong, D.-Y., Kim, S.-J., and Ho, C.-H. (2007). Arctic Oscillation and Ice Severity in the Bohai Sea, East Asia. Int. J. Climatol. 27 (10), 1287–1302. doi:10.1002/joc.1470
Gu, W., Liu, C., Yuan, S., Li, N., Chao, J., Li, L., et al. (2013). Spatial Distribution Characteristics of Sea-Ice-Hazard Risk in Bohai, China. Ann. Glaciol. 54 (62), 73–79. doi:10.3189/2013AoG62A303
Hendrikse, H., and Nord, T. S. (2019). Dynamic Response of an Offshore Structure Interacting with an Ice Floe Failing in Crushing. Mar. Struct. 65, 271–290. doi:10.1016/j.marstruc.2019.01.012
Hwang, B., Ren, J., McCormack, S., Berry, C., Ayed, I. B., Graber, H. C., et al. (2017). A Practical Algorithm for the Retrieval of Floe Size Distribution of Arctic Sea Ice from High-Resolution Satellite Synthetic Aperture Radar Imagery. Elementa-Sci. Anthr. 5, 38. doi:10.1525/elementa.154
Institute of Geography of Chinese Academy of Sciences (1990). Atlas of Ecological Environment in the Beijing-Tianjin Area. Beijing: Science Press.
ISO (2019). Petroleum and Natural Gas Industries - Arctic Offshore Structures. Geneva: International Organization for Standardization, 546. ISO 19906.
Kreider, J. R., and Vivatrat, V. (1983). Ice Force Prediction Using a Limited Driving Force Approach. J. Energy Resour. Technol.-Trans. ASME 105 (1), 17–25. doi:10.1115/1.3230868
Lacis, A. A., Schmidt, G. A., Rind, D., and Ruedy, R. A. (2010). Atmospheric CO2: Principal Control Knob Governing Earth’s Temperature. Science 330 (6002), 356–359. doi:10.1126/science.1190653
Li, D., Geyer, B., and Bisling, P. (2016). A Model-Based Climatology Analysis of Wind Power Resources at 100-m Height over the Bohai Sea and the Yellow Sea. Appl. Energy 179, 575–589. doi:10.1016/j.apenergy.2016.07.010
Li, X., Zhao, C., and Huang, M. (2022). Reassessing the Effect of Low-Carbon City Policy in China: New Evidence from the Nighttime Light Data. Front. Energy Res. 9, 798448. doi:10.3389/fenrg.2021.798448
Li, Z., Wang, J., Li, G., and Guo, K. (2017). “Preliminary Analysis on the Drift Ice Floe Areas and Concentration Near the Structures along Bohai Coastal Based on Satellite Images,” in Proceedings of 24th International Conference on Port and Ocean Engineering under Arctic Conditions, Busan, Korea, 11–16 June 2017, 11. Available online at: https://www.poac.com/Papers/2017/pdf/POAC17_094_Li.pdf.
Li, Z., Zhang, L., Lu, P., Leppäranta, M., and Li, G. (2011). Experimental Study on the Effect of Porosity on the Uniaxial Compressive Strength of Sea Ice in Bohai Sea. Sci. China Technol. Sci. 54 (9), 2429–2436. doi:10.1007/s11431-011-4482-1
Liu, M., Ju, C., and Huang, R. (2022). Assessing the Effects of Market Power on Electricity Reliability in China: Toward a Green and Reliable Market. Front. Energy Res. 9, 811565. doi:10.3389/fenrg.2021.811565
Liu, X.-Q., Yuan, S., Ma, Y.-X., Shi, W.-Q., Xu, N., Song, L.-N., et al. (2021). Analysis of Ice Conditions Around the Coastal Nuclear Power Plant in China's Sea Ice Region Based on Monitoring Data. Int. J. Offshore Polar Eng. 31 (3), 270–274. doi:10.17736/ijope.2021.ik07
Lu, P., and Li, Z. (2010). A Method of Obtaining Ice Concentration and Floe Size from Shipboard Oblique Sea Ice Images. IEEE Trans. Geosci. Remote Sens. 48 (7), 2771–2780. doi:10.1109/TGRS.2010.2042962
Ma, Y., Cheng, B., Xu, N., Yuan, S., Shi, H., and Shi, W. (2022). Long-Term Ice Conditions in Yingkou, a Coastal Region Northeast of the Bohai Sea, between 1951/1952 and 2017/2018: Modeling and Observations. Remote Sens. 14 (1), 182. doi:10.3390/rs14010182
Montzka, S. A., Dlugokencky, E. J., and Butler, J. H. (2011). Non-CO2 Greenhouse Gases and Climate Change. Nature 476 (7358), 43–50. doi:10.1038/nature10322
Ouyang, L., Hui, F., Zhu, L., Cheng, X., Cheng, B., Shokr, M., et al. (2019). The Spatiotemporal Patterns of Sea Ice in the Bohai Sea during the Winter Seasons of 2000-2016. Int. J. Digit. Earth 12 (8), 893–909. doi:10.1080/17538947.2017.1365957
Qi, W.-H., Qi, M.-L., and Ji, Y.-M. (2020). The Effect Path of Public Communication on Public Acceptance of Nuclear Energy. Energy Policy 144, 111655. doi:10.1016/j.enpol.2020.111655
Sanderson, T. J. O. (1988). Ice Mechanics: Risks to Offshore Structures. London: Graham and Trotman, 253.
Sayigh, A. (2021). Up-Date: Renewable Energy and Climate Change. Renew. Energy Environ. Sustain. 6, 13. doi:10.1051/rees/2021004
Shi, W., Yuan, S., Xu, N., Chen, W., Liu, Y., and Liu, X. (2016). Analysis of Floe Velocity Characteristics in Small-Scaled Zone in Offshore Waters in the Eastern Coast of Liaodong Bay. Cold Reg. Sci. Tech. 126, 82–89. doi:10.1016/j.coldregions.2016.04.004
Su, H., Wang, Y., Xiao, J., and Li, L. (2013). Improving MODIS Sea Ice Detectability Using Gray Level Co-Occurrence Matrix Texture Analysis Method: A Case Study in the Bohai Sea. ISPRS-J. Photogramm. Remote Sens. 85, 13–20. doi:10.1016/j.isprsjprs.2013.07.010
Toyota, T., Takatsuji, S., and Nakayama, M. (2006). Characteristics of Sea Ice Floe Size Distribution in the Seasonal Ice Zone. Geophys. Res. Lett. 33 (2), L02616. doi:10.1029/2005GL024556
Tuhkuri, J., and Polojärvi, A. (2018). A Review of Discrete Element Simulation of Ice-Structure Interaction. Phil. Trans. R. Soc. A 376 (2129), 20170335. doi:10.1098/rsta.2017.0335
Wang, A., Tang, M., Zhao, Q., Liu, Y., Li, B., Shi, Y., et al. (2021a). Analysis of Sea Ice Parameters for the Design of an Offshore Wind Farm in the Bohai Sea. Ocean. Eng. 239, 109902. doi:10.1016/j.oceaneng.2021.109902
Wang, Q. (2010). Effective Policies for Renewable Energy-The Example of China's Wind Power-Lessons for China's Photovoltaic Power. Renew. Sust. Energy Rev. 14 (2), 702–712. doi:10.1016/j.rser.2009.08.013
Wang, R., Huang, D., Zhang, X., and Wei, P. (2020). Combined Pattern Matching and Feature Tracking for Bohai Sea Ice Drift Detection Using Gaofen-4 Imagery. Int. J. Remote Sens. 41 (19), 7486–7508. doi:10.1080/01431161.2020.1760396
Wang, Y., Li, H., Huang, Y., and Ji, S. (2021b). Study on Mooring Design and Impacts of Nuclear Power Platform in Ice Zone. J. Ship Mech. 25 (5), 619–626. (in Chinese). doi:10.3969/j.issn.1007-7294.2021.05.010
Wang, Z., Dong, S., Li, X., and Guedes Soares, C. (2016). Assessments of Wave Energy in the Bohai Sea, China. Renew. Energy 90, 145–156. doi:10.1016/j.renene.2015.12.060
Xu, N., Gao, Z., and Ning, J. (2016). Analysis of the Characteristics and Causes of Coastline Variation in the Bohai Rim (1980-2010). Environ. Earth Sci. 75 (8), 719. doi:10.1007/s12665-016-5452-5
Yan, Q., Wang, A., Wang, G., Yu, W., and Chen, Q. (2011). Nuclear Power Development in China and Uranium Demand Forecast: Based on Analysis of Global Current Situation. Prog. Nucl. Energy 53 (6), 742–747. doi:10.1016/j.pnucene.2010.09.001
Yan, Y., Gu, W., Xu, Y., and Li, Q. (2019). The In Situ Observation of Modelled Sea Ice Drift Characteristics in the Bohai Sea. Acta Oceanol. Sin. 38 (3), 17–25. doi:10.1007/s13131-019-1395-5
Yan, Y., Uotila, P., Huang, K., and Gu, W. (2020). Variability of Sea Ice Area in the Bohai Sea from 1958 to 2015. Sci. Total Environ. 709, 136164. doi:10.1016/j.scitotenv.2019.136164
Yang, G. (2000). Bohai Sea Ice Conditions. J. Cold Reg. Eng. 14 (2), 54–67. doi:10.1061/(asce)0887-381x(2000)14:2(54)
Yu, J., Fu, Y., Yu, Y., Wu, S., Wu, Y., You, M., et al. (2019). Assessment of Offshore Wind Characteristics and Wind Energy Potential in Bohai Bay, China. Energies 12 (15), 2879. doi:10.3390/en12152879
Zeng, N., Ding, Y., Pan, J., Wang, H., and Gregg, J. (2008). Sustainable Development. Climate Change–The Chinese Challenge. Science 319 (5864), 730–731. doi:10.1126/science.1153368
Zhang, D.-Y., Yu, S.-S., Wang, Y., and Yue, Q.-J. (2017). Sea Ice Management for Oil and Gas Platforms in the Bohai Sea. Pol. Marit. Res. 24 (S2), 195–204. doi:10.1515/pomr-2017-0083
Zhang, D., Li, W., and Lin, Y. (2009). Wave Energy in China: Current Status and Perspectives. Renew. Energy 34 (10), 2089–2092. doi:10.1016/j.renene.2009.03.014
Zhang, M. (1989). The Action of Bohai Sea Ice on Offshore Structures. Mar. Environ. Sci. 8 (1), 105–108. (in Chinese).
Zhang, N., Li, S., Wu, Y., Wang, K.-H., Zhang, Q., You, Z.-J., et al. (2020). Effects of Sea Ice on Wave Energy Flux Distribution in the Bohai Sea. Renew. Energy 162, 2330–2343. doi:10.1016/j.renene.2020.10.036
Zhang, X.-L., Zhang, Z.-H., Xu, Z.-J., Li, G., Sun, Q., and Hou, X.-J. (2013). Sea Ice Disasters and Their Impacts since 2000 in Laizhou Bay of Bohai Sea, China. Nat. Hazards 65 (1), 27–40. doi:10.1007/s11069-012-0340-0
Zhou, H., Yu, W., Zhang, Y., Oi, X., and Zhang, Y. (2010). “Using HJ 1-A/B Satellite Imagery for Near-Shore Sea Ice Monitoring in the Nanpu-Caofeidian Area, Bohai Bay, China,” in 2010 IEEE International Geoscience and Remote Sensing Symposium, Honolulu, USA, 25–30 July 2010, 2390–2393. doi:10.1109/IGARSS.2010.5649314
Zhu, B., Sun, C., and Huang, Y. (2018). Vibration Response and Control of Offshore Monopile Wind Turbine in Ice Area. J. Vib. Shock 40 (9), 133–141. (in Chinese). doi:10.13465/j.cnki.jvs.2021.09.018
Keywords: new-energy structures, design criteria, ice concentration, floe area, satellite images, Bohai sea
Citation: Li Z, Xiu Y, Wang Q, Li G, Lu P, Zhong S and Chen X (2022) On the Method of Design Drift-Ice Concentration and Floe Area for New-Energy Structures in Ice-Infested Nearshore Areas of the Bohai Sea, China. Front. Energy Res. 10:947153. doi: 10.3389/fenrg.2022.947153
Received: 18 May 2022; Accepted: 03 June 2022;
Published: 12 July 2022.
Edited by:
Xiaohu Yang, Xi’an Jiaotong University, ChinaCopyright © 2022 Li, Xiu, Wang, Li, Lu, Zhong and Chen. This is an open-access article distributed under the terms of the Creative Commons Attribution License (CC BY). The use, distribution or reproduction in other forums is permitted, provided the original author(s) and the copyright owner(s) are credited and that the original publication in this journal is cited, in accordance with accepted academic practice. No use, distribution or reproduction is permitted which does not comply with these terms.
*Correspondence: Ge Li, bGlnZUBuY3MubW5yLmdvdi5jbg==; Peng Lu, bHVwZW5nQGRsdXQuZWR1LmNu
 Zhijun Li
 Yuanren Xiu
 Qingkai Wang1
 Peng Lu
