 Yuan Zhang
 Hongyuan Zhang
 Feng Hao
- 1School of Economics, Tianjin University of Commerce, Tianjin, China
- 2School of Statistics, Tianjin University of Finance and Economics, Tianjin, China
Promoting the low-carbon development of the electricity market is the key to controlling CO2 emissions and achieving carbon neutrality in China. It requires the coordinated development between investment and carbon emissions in the electricity industry. Based on the panel data on electricity investment and carbon emissions from 2000 to 2019, this study systematically explains the coupling coordination mechanism between electricity investment and carbon emissions. We use the coupling coordination model to calculate the coupling coordination degree of each province. Then, the research uses the GM (1, 1) model to predict the coupling coordination development from 2020 to 2030. The study finds that the development of China’s electricity industry is in good shape. Although the coupling coordination degree has entered barely or primary coordination in most provinces, there are certain fluctuations in recent years; there are spatial differences in coupling and coordinated development among regions: the central region has a high coupling coordination degree, while the eastern and northeastern regions are relatively lagging behind. In the next 10 years, the coupling coordination degree will continue to grow, and all regions will reach the primary coordination. Among them, the central region will reach the intermediate coordination.
Introduction
As the proportion of electricity in global terminal energy consumption rises, electricity is gradually replacing other non-renewable energy sources. It gradually becomes the core leading the low-carbon transformation of the energy system. Due to an over-reliance on fossil fuels for electricity production, the share of the electricity industry in global CO2 emissions has increased year by year. It has already surpassed all other sources of CO2 emissions from energy activities. According to Global Energy and CO2 Status Report 2018 released by the International Energy Agency (IEA), the global electricity industry emits 13 billion tons of CO2, accounting for 38% of the total energy-related CO2 emissions. Nearly two-thirds of the increase in energy-related CO2 emissions comes from the contribution of the electricity industry. Under the trend of electrification of the global economy, the use of carbon is flowing across industries, resulting in an increase in carbon emissions in the electricity industry. From a global perspective, the electricity industry is an important source of carbon emissions in the carbon trading market. Thus, strengthening investment, promoting clean energy transformation, and accelerating the expansion of renewable energy power generation have become effective ways to achieve carbon emission reduction in the electricity industry (IEA, 2018).
According to an IEA report, China’s power and thermal energy sector generated 4.747 billion tons of CO2 in 2018, accounting for 49.6% of the country’s total CO2 emissions. Faced with severe environmental pollution, China has been actively optimizing the investment structure of the electricity industry, contributing significantly to the promotion of green and low-carbon development. Affected by global COVID-19, China’s electricity industry has undergone major changes in recent years. Electricity investment has declined and continues to show a downward trend (IEA, 2020). At the moment, China’s electricity market is still in its initial stages, and its carbon emission reduction potential is not fully stimulated. In this context, exploring the relationship between China’s electricity investment and carbon plays a positive role in promoting the construction of the electricity industry. It is beneficial to the overall development of China’s electricity enterprises, reduces carbon emissions, and steers electricity investment on a more environmentally friendly path.
There is a close relationship between investment and carbon emissions in the electricity industry. However, the coupling coordination between them has not been systematically studied. Therefore, based on the coupling perspective, this study studies their interaction mechanism and discusses the differences in the coupling coordination degree from the inter-provincial level. In order to better understand future development, we also forecast the coupling coordination degree. It can provide a scientific basis for the construction of the electricity industry and the coordinated development of the system so as to promote the coupling and coordinated development of the electricity market at different levels and scales.
Literature review
The increasing environmental concerns have led the world to rethink alternative and innovative ways to harness clean energy. Technology and infrastructure, economy and finance, politics and system, culture and behavior, meteorology, and other factors are all factors that hinder its development (Irfan et al., 2022). As traditional non-renewable energy sources such as coal, oil, and natural gas produce a large amount of greenhouse gases, there is unprecedented interest in the increasing supply of renewable energy sources (Kok et al., 2018). With the growth of the economy, the energy problem and the environment deteriorate. The problem of energy consumption structure becomes more and more serious. The generation of renewable energy is crucial for achieving sustainable development (Wei et al., 2022). The amount of investment in renewable and non-renewable energy should be determined by the electricity market. Renewable energy generation technology has a high generation investment cost (Aflaki and Netessine, 2017). Although lowering the investment cost of renewable power generation technology is a key factor to promote the low-carbon transformation, the traditional nonrenewable energy investment is still important. The low investment cost of these energy sources can provide a more reliable electricity supply than renewable energy sources while requiring fuel expenditure and carbon emission costs (Kis et al., 2018).
The use of fossil fuels can be reduced by technological innovation in the electricity industry. In the production process, clean technologies replace the original polluting technologies. In the long run, it will significantly improve the operation efficiency and contribute to low-carbon development (Lee, 2013; Daniel-Gromke et al., 2018). In addition, Internet development and entrepreneurship also help improve the efficiency of green innovation (Fan g et al., 2022). However, in view of natural uncertainties (e.g., climate sensitivity) (Fuss et al., 2012; Turner et al., 2017; Wang et al., 2021), market uncertainty (e.g., energy price fluctuation) (Pahle et al., 2013; Hirth, 2018), technical uncertainty (e.g., the feasibility of new technology) (Gnansounou et al., 2004; Castillo and Linn, 2011), socioeconomic uncertainty (e.g., COVID-19 epidemic impact) (Zhong et al., 2020; Haxhimusa and Liebensteiner, 2021; Iqbal et al., 2021), and policy uncertainty (e.g., hedging strategy, investment tax credit, cash subsidy, etc.) (Morris et al., 2018; Braungardt et al., 2021), it is difficult to evaluate the importance of different technologies in achieving a steady investment to reduce carbon emissions. A key issue for policymakers is how to allocate limited funding across multiple technologies, balancing R&D investment to drive innovation in emerging low-carbon technologies (Santen et al., 2017).
The essence of both the electricity market and carbon market is to achieve low-cost, clean, and low-carbon development. Electricity investment and carbon emissions influence each other through the interaction. Investment in the electricity industry has dual effects on carbon emissions: on the one hand, with the increase in investment, the economic scale of the electricity industry expands unceasingly. Under the condition that the technological level, industrial structure, and emission coefficient remain unchanged, a large amount of energy consumption leads to an increase in carbon emissions (Zhao et al., 2016; Peng et al., 2018); on the other hand, investment can affect carbon emissions through the efficiency path. Technological investment improves the efficiency of energy processing, thereby reducing carbon emissions in production (Jin et al., 2017). On the premise of ensuring energy supply, reasonable investment is conducive to optimizing the electricity market structure, improving energy utilization efficiency, and controlling and reducing carbon emissions (Ma and Liu, 2018).
At the same time, the carbon market information will also be fed back to the investment of the electricity industry. The carbon market will increase the economic burden of low-efficiency and high-carbon electricity enterprises, while the high-efficiency and low-carbon electricity enterprises can obtain economic benefits through the carbon market. A large amount of money is used to create new renewable technologies to reduce its dependence on fossil fuels (Xia et al., 2020). Energy prices should provide real costs associated with the growing problem of environmental pollution (Li et al., 2021). As the main body of regional emission reduction, enterprises are most concerned about their own profits. Emission reduction requires a lot of human, material, and financial resources, which will reduce its output to a certain extent. Therefore, the enthusiasm of enterprises to reduce emissions is not high.
To promote corporate emission reductions, governments around the world have implemented various low-carbon policies. As one of the common carbon emission reduction policies, the carbon cap and trade mechanism imposes carbon quotas on companies that rely on carbon emissions, thereby forcing companies to engage in research and development of emission reduction technologies (Sun et al., 2020). When carbon emissions are too high, the government needs to adjust regulatory incentives to encourage enterprises to increase their investment in low-carbon electricity technologies and give appropriate subsidies and tax exemptions to low-carbon enterprises (Schafer, 2019; Chen et al., 2021). Additionally, the carbon emission trading system and carbon emission quota allocation rules have an impact on how the electricity industry invests, under the carbon emission trading system. When an enterprise’s carbon emissions exceed those set by the government, it will increase investment in renewable energy technologies to lower the cost of the carbon trading market’s quotas (Zhou et al., 2010).
Coupling coordination mechanism
There is a potential trade-off between carbon emission reduction and investment. Reducing carbon dioxide emissions will bring huge economic losses to China. Controlling greenhouse gases can only be achieved by reducing the energy use, adjusting the energy structure, and controlling population growth. Mitigation measures should focus on industrial structure transformation (Jin et al., 2020). At the same time, carbon emissions also have social costs, and the price of carbon dioxide to reduce emissions to the optimal level for the society must be carefully assessed (Bressler, 2021). Under the emissions trading scheme, there is a coupling relationship between investment and carbon in the electricity industry, and they interact and restrict each other.
According to Grossman and Krueger, (1995), carbon emissions are mainly affected by the scale effect, technology effect, and composition effect of electricity investment. The three factors are complementary to each other to a certain extent. On the one hand, the economic scale and industrial structure can influence the direction of technological progress on carbon emissions. With the upgrading of industrial structures and the expansion of the economic scale, technological progress promotes carbon emissions more than inhibiting them, which eventually leads to an increase in CO2 emissions. On the other hand, technological progress will also strengthen the relationship between the economic scale, industrial structure, and carbon emissions. The three effects are as follows:
(1) The scale effect refers to the influence of investment in the electricity industry on carbon emissions by expanding economic activities. With the continuous increase of electricity output, the electricity industry needs more factor inputs. The electricity investment improves the industrial benefits, but it has also brought about an increase in carbon emissions at the same time (Shahbaz et al., 2022).
(2) The technology effect refers to that electricity investment can affect carbon emissions through the efficiency path. Electricity investment can promote innovation in the electricity industry, and technological progress can improve the utilization efficiency of non-renewable energy sources and reduce carbon emissions (Li and Li, 2020).
(3) The composition effect refers to the impact of electricity investment on carbon emissions by affecting the energy structure. As we all know, due to the characteristics of various energy varieties, different energy sources release different carbon emissions (Burnham et al., 2012). The investment plays a role in guiding and regulating the allocation of resources and directly affects the structure of energy production. If limited funds are invested in the production of high-pollution and high-emission energy projects, it will lead to an increase in carbon emissions. If the funds are invested in the production of clean energy projects with low pollution and low emission, it will be beneficial to reduce carbon emissions by improving the energy structure (Li and Qi., 2011).
The scale effect can be offset by the technology effect and the composition effect. When the scale effect dominates, the environmental pollution will increase. When the technology effect and composition effect of clean energy dominate, the environmental quality will be improved. In general, the scale effect and technology effect typically necessitate some degree of economic development. The nation and enterprises can make significant investments and realize independent technological innovation. At the same time, the carbon market will also backfire on electricity investment. The government will introduce policies to intervene in order to meet existing emission reduction targets. Carbon pricing is an effective policy tool to regulate the investment structure of the electricity industry. It can provide more opportunities for electricity enterprises to invest in clean resources. Once carbon pricing is in place, the non-renewable energy sources will be abandoned. The resource portfolio will become cleaner, leading to greater emissions reductions (Oggioni and Smeers, 2012; Fan et al., 2014; Petitet et al., 2016).
The degree of market development for carbon emissions has an important impact on carbon pricing investment. Initially, because of the reasonable setting of the actual emission cap of enterprises, the carbon market did not generate significant costs. Instead, the carbon market system started out modestly. With the continuous improvement of carbon emissions, the price of carbon will increase. This will encourage enterprises to actively step up their efforts to reduce emissions and invest more in renewable energy sources (Aflaki and Netessine, 2017). When investments increase and carbon emissions continue to decline, the electricity market and the carbon market will achieve good coupling coordination. The coupling coordination mechanism is shown in Figure 1:
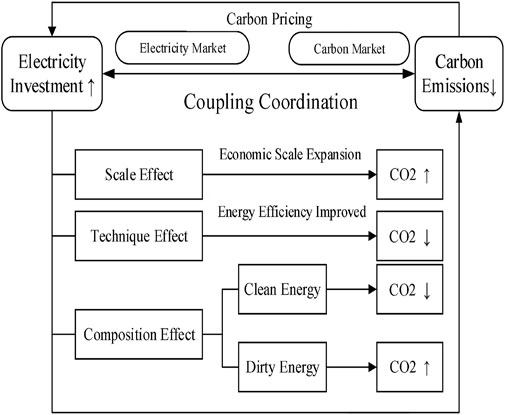
FIGURE 1. Coupling coordination mechanism of investment and carbon emission.
Measurement of the coupling coordination degree
Coupling coordination model
Based on the coupling coordination mechanism, we further use the coupling coordination model to quantify it. The term “coupling” originally belongs to the concept of physics, which refers to the phenomenon that two or more systems interact with each other and have mutual influence. It is often used in the field of economics to judge whether the development of variables is orderly. Compared with other methods, the coupling coordination model has a strong advantage in studying the interaction and coordinated development of subsystems. It is intuitive and easy to explain. Coupling contributes to the development of the joint forces among the systems, which not only promotes the self-development of each subsystem but also strengthens the coordination of each subsystem. The model does not need to select too many control variables. If there are too many control variables, too many systems will interfere with the final result. Since the level of the coupling degree value cannot accurately reflect the coordinated development level, this study establishes a coupling coordination model. The specific steps are as follows:
Normalize the data by min-max, and remove the unit limitation to the data. Also then, convert it into a dimensionless pure value so that indicators of different units or magnitudes can be compared. For the positive indicator of electricity investment, the normalization formula is as follows:
For the reverse indicator of carbon emission, the normalization formula is as follows:
A represents the coupling degree between investment and carbon emissions in the electricity industry,
F represents the comprehensive coordination index;
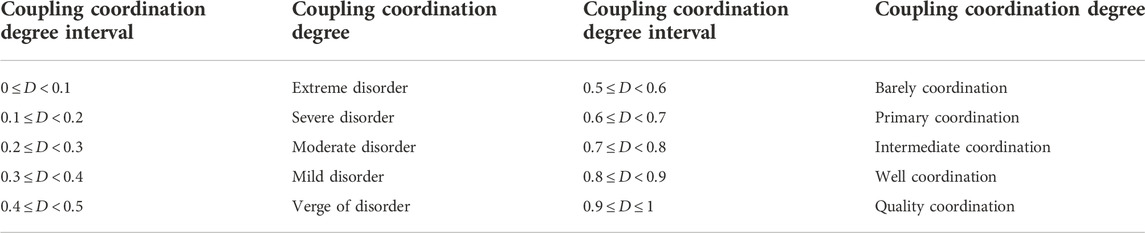
TABLE 1. Classification of the coupling coordination degree.
Data source
This study mainly analyzes the coupling coordination degree of investment and carbon emissions in China’s provincial electricity industry from 2000 to 2019. The investment data on the electricity industry come from the National Bureau of Statistics of China and the China Energy Statistics Yearbook. In view of the lack of official data on carbon emission of the electricity industry in each province, this study adopts the carbon emission data on China’s electricity industry calculated by Carbon Emission Accounts and Datasets (CEAD), by referring to relevant international data recommended by the Intergovernmental Panel on Climate Change (IPCC). These data are based on the 2006 IPCC Guidelines for National Greenhouse Gas Inventories, and the carbon emission intensity of China’s electricity industry is measured by the energy balance table, which has been widely used in related fields. From the perspective of data availability, 30 provinces in China were selected as the research objects. Because CEAD has not released the carbon emission data on Tibet, Hong Kong, Macau, and Taiwan, these regions are not included in the calculation.
Result analysis
Although the carbon emissions of all provinces have increased in recent years, the size is different (Table 2). From the perspective of the average carbon emissions in the electricity industry, Shandong, Jiangsu, Inner Mongolia, and other provinces have relatively high carbon emissions with an annual average of more than 300 Mt. The average annual carbon emissions of Hebei, Shanxi, Henan, and Guangdong also exceed 200 Mt, while the carbon emissions of first-tier developed provinces such as Beijing and Shanghai are relatively low. The standard deviation in Inner Mongolia and Shandong is large, while that in Hainan, Qinghai, Beijing, and Shanghai is small. At the same time, there is a strong positive correlation between investment and carbon emissions. Provinces with high carbon emissions also have larger investments. Hebei, Inner Mongolia, and Shandong have maintained high investment; their investment is much higher than that of low carbon emission areas.
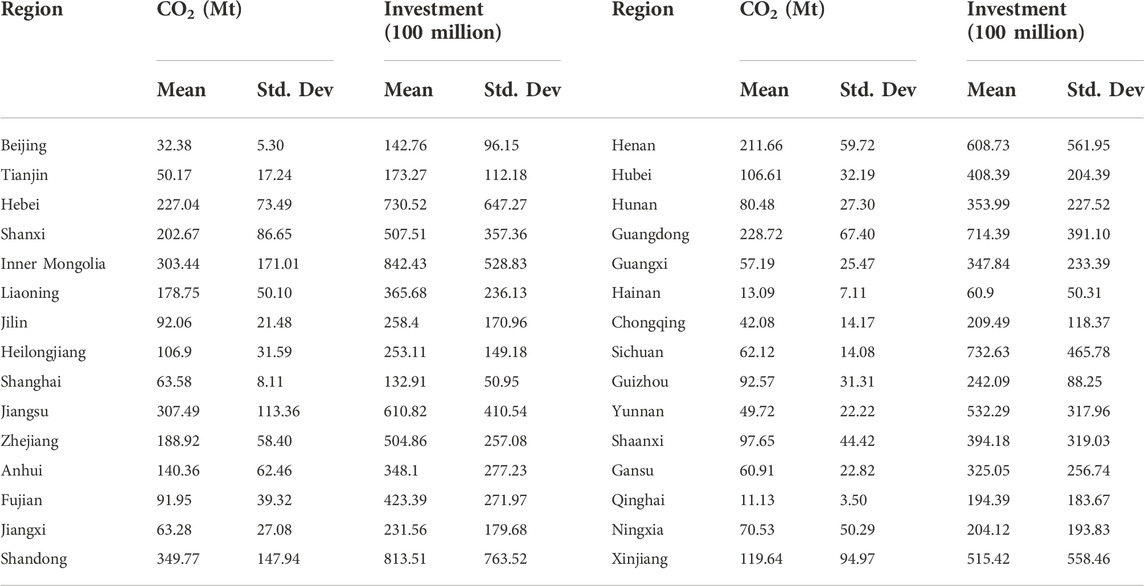
TABLE 2. Descriptive statistical results.
Figures 2, 3, respectively, show the mean value and growth rate of investment and carbon emissions in the electricity industry in China’s provinces from 2000 to 2019. During the investigation period, carbon emissions increased year by year, and the growth rate of carbon emissions decreased significantly since 2010. Although there has also been a significant increase in electricity investment, the growth has been sluggish in recent years. In 2018, there was negative growth. There is great room for improvement.
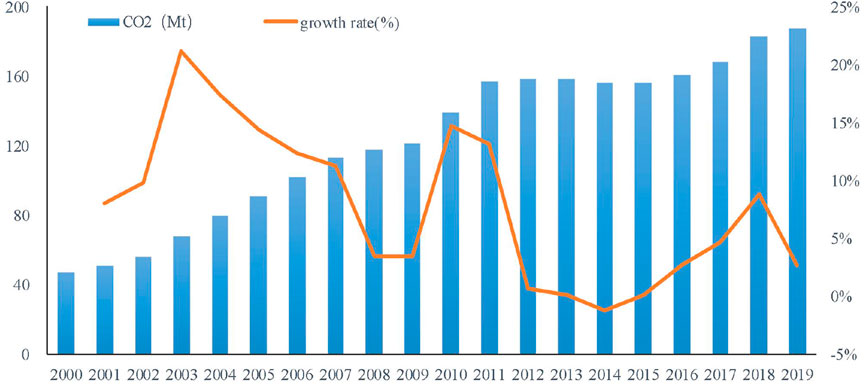
FIGURE 2. Carbon emissions of China’s provinces from 2000 to 2019.
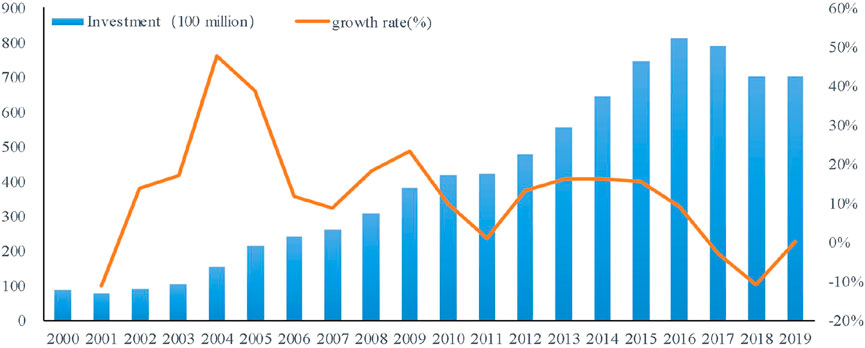
FIGURE 3. Electricity investment of China’s provinces from 2000 to 2019.
According to Eqs 1–5, the coupling coordination degree of investment and carbon emissions of 30 provinces in China each year can be calculated (Table 3). Due to space limitations, only the calculation results of 2000, 2010, and 2019 are shown to investigate the changing trend of the coupling coordination degree with time. From 2000 to 2019, the coupling coordination degree has increased significantly in all provinces. At the beginning of the new century, except for a few provinces and regions such as Zhejiang and Hubei, most provinces were facing a disorder state. There is an imbalance between electricity investment and carbon emissions. The provinces in the state of mild imbalance and on the verge of imbalance account for 40%, respectively, while some provinces such as Hainan were still in a state of severe imbalance.
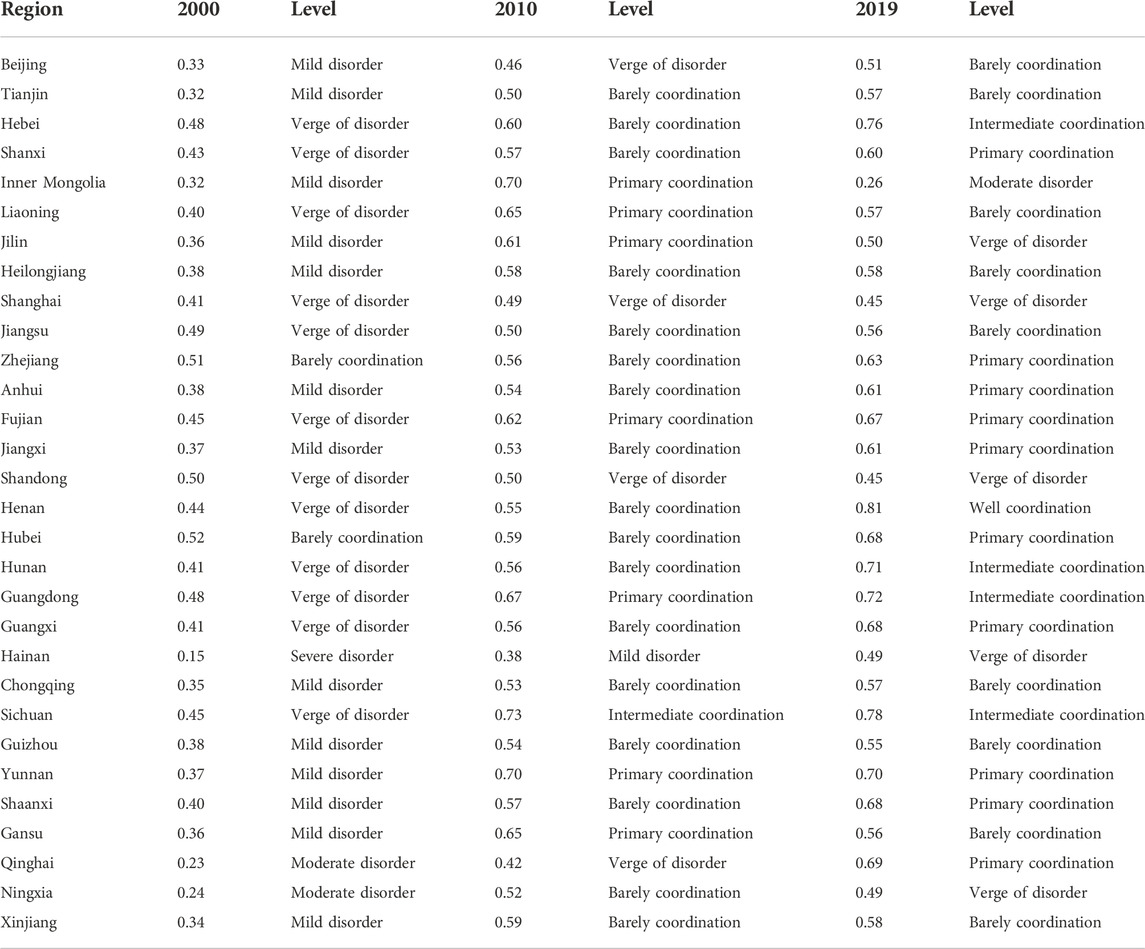
TABLE 3. Results of coupling coordination.
As time goes on, the coupling coordination degree in each province has improved significantly. In 2010, most provinces have gotten rid of the maladjustment state. They entered the stage of reluctant coordination and primary coordination. Among them, Sichuan has even entered the stage of intermediate coordination. Although Hainan is still in the stage of mild imbalance, it still has a significant increase. Beijing, Shanghai, and other developed provinces are still on the verge of imbalance, and the coupling and coordinated development are not satisfactory. In 2019, the coupling coordination degree has achieved a further leap in some provinces. Henan has made the most obvious progress. However, some provinces have not increased. The coupling coordination degree is facing a state of imbalance again, showing an “inverted U-shaped” trend of change.
In order to further analyze the coupling and coordinated development of investment and carbon emission in different regions, this study divides 30 provinces into four parts, according to the geographical location: eastern, central, western and northeastern. Among them, the eastern region includes 10 provinces, namely, Beijing, Fujian, Guangdong, Hainan, Hebei, Jiangsu, Shandong, Shanghai, Tianjin, and Zhejiang; the central region includes 6 provinces, namely, Anhui, Henan, Hubei, Hunan, Jiangxi, and Shanxi; the western region includes 11 provinces, namely, Chongqing, Gansu, Guangxi, Guizhou, Inner Mongolia, Ningxia, Qinghai, Shaanxi, Sichuan, Xinjiang, and Yunnan; and the northeastern region includes three provinces, namely, Heilongjiang, Jilin, and Liaoning.
Among the four major regions, the coupling coordination degree of the central and western regions shows a better development state than the other two regions. After 2014, the average value of coupling coordination in the central region basically reached the primary coordination level and dropped slightly in 2018–2019. The western region has a low degree of coupling coordination at first, but the growth trend is good and it has basically reached the primary coordination state in recent years. Since 2010, the coupling coordination degree of the eastern and northeastern regions has shown an “inverted U-shaped” change. With the weak investment and the increase in carbon emissions in the electricity industry, the coupling coordination degree has shown a downward trend, especially in the northeastern region. The coupling coordination degree dropped from 0.62 in 2010 to 0.55 in 2019, falling from primary coordination to barely coordination again. The same development trend also existed in the eastern and western regions (Table 4).
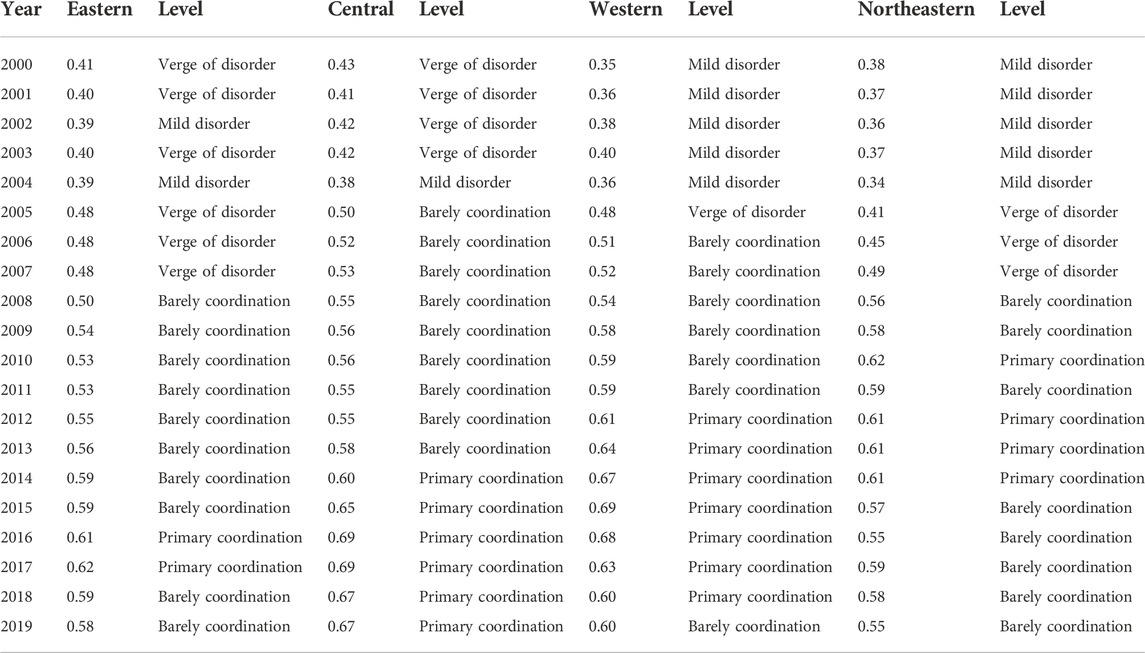
TABLE 4. Coupling coordination degree of four regions.
Coupling coordination degree prediction
Based on the investment and carbon emission data from 2000 to 2019, this study further uses the GM (1, 1) model to predict the coupling coordination degree of each province from 2020 to 2030. Due to the limited sample size, the whole coupling coordination degree trend cannot be predicted by ordinary linear or nonlinear models with high uncertainty. In the gray system theory, the GM (1, 1) model is the most widely used coupling coordination degree prediction (Xing et al., 2019; Cheng et al., 2019; Wang et al., 2020). Under fewer data samples, the GM (1, 1) model makes full use of time-series data information for analysis and prediction. Compared with simulation prediction methods such as Markov chains and cellular automata, this method is more convenient to calculate and has higher prediction accuracy (Liu et al., 2018; Ye et al., 2022).
Suppose there are n observations and the original data time series of each province is
a is the development gray level, u is the endogenous control gray number, and
By substituting the existing data into the GM (1,1) model, the predicted value of the coupling coordination degree can be obtained from Eq. 7. Figure 4 shows the predicted value of the coupling coordination degree in the four regions from 2020 to 2030. The coupling coordination degree in the central region shows the best performance. After 2025, the degree of coupling coordination reached the intermediate level, showing a rising trend. The coupling coordination degree in the western region has also increased steadily, but the growth rate is slightly lower than that in the central region, and it will continue to remain in the primary coordination stage in the next 10 years. In contrast, the development of the coupling coordination between the eastern and northeastern regions is relatively slow. After 2028, the coupling coordination degree of the two has achieved convergence, but there is still a certain gap in intermediate coordination.
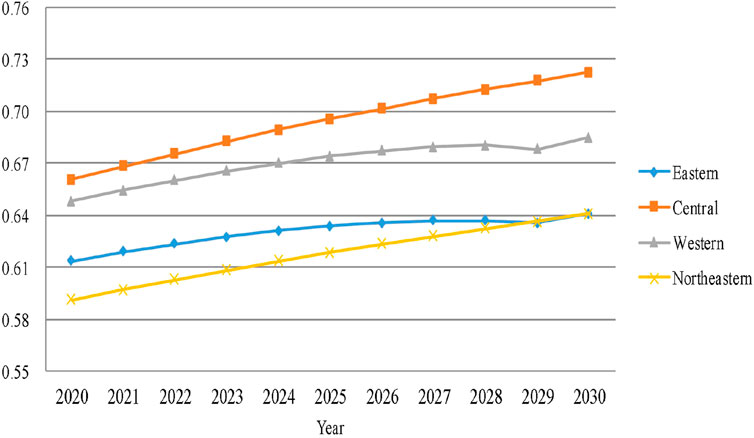
FIGURE 4. Prediction of the coupling coordination degree from 2020 to 2030.
Overall, the coupling coordination degree has been developing in a better direction, but the rising rate still needs to be further improved. Favorable policies and measures are needed to promote the high-quality coupling coordination development between electricity investment and carbon emissions across the country and in various provinces.
Conclusion and policy implications
Conclusion
China’s electricity industry is in a critical transition period. The coordinated development of investment and carbon emissions will have a profound impact. Based on the investment-carbon emission system theoretical mechanism, this study calculates the coupling coordination degree and uses GM (1, 1) to predict them from 2020 to 2030. The conclusions are as follows:
(1) The coupling coordination degree of investment-carbon emissions in China’s electricity industry is increasing steadily, and most provinces and regions have entered the stage of barely coordination and primary coordination.
(2) There are differences in the coupling and coordinated development of the electricity industry in different regions. The coupling coordination degree in the central region has the best development, while the coupling coordination degree in the eastern and northeastern regions is relatively backward. Although the coupling coordination degree of each region has shown good development, it has declined to a certain extent in recent years.
(3) According to the forecast results of the GM (1, 1) model, China’s electricity industry will still show a good coupling and coordinated development trend in the next 10 years. The coupling coordination degree in the central region can reach the intermediate level, while the coupling coordination degree in the eastern and northeastern regions rises slowly, which still needs to be focused on.
This study provides a new perspective for research on the relationship between investment and carbon emissions in the electricity industry, which makes up for the current lack of paying attention to investment and carbon emission reduction in isolation. It theoretically reveals the mechanism of action between electricity investment and carbon emissions, discusses the spatiotemporal evolution trend of the degree of coupling and coordination between the two, and enriches the relevant research on carbon emissions in the electricity industry. The research methods and framework also have a certain reference value for other industries with the same characteristics. The prediction of the coupling coordination degree provides a reference for China’s electricity industry to formulate technological innovation and energy policies. It will help to better achieve the emission reduction goals under the low-carbon background of the “carbon peak” in 2030 and “carbon neutrality” in 2060.
Policy implications
The mismatch between investment and carbon emissions will hinder the development of the electricity industry. Provinces with different coupling coordination degree types need to formulate different strategies. For the provinces with high carbon emissions but low coupling coordination, their electricity industry relies too much on energy consumption in the development process. They lack sufficient technical support in the optimization of resources and the environment, which leads to the uncoordinated electricity investment and carbon emission system in these provinces. For these provinces, it plays an important role in promoting R&D and innovation of electric power technology; for provinces with low carbon emissions and a high coupling coordination degree, these places have developed economies, low dependence on carbon emissions, and relatively coordinated performance in dealing with the relationship between electricity investment and low-carbon development. Therefore, the electricity industry should pay attention to the improvement of existing emission reduction technologies and the development of new technologies.
In the future, it can be seen that there will still be differences in the coordination degree of investment-carbon emission coupling of the electricity industry in different regions. Further research is needed to realize the coordinated development of the two systems. The eastern, central, western, and northeastern regions should strengthen international technical exchanges, cooperation, and sharing and promote the rational utilization and optimal allocation of nationwide electricity investment. They should promote the coupling and coordinated development of the eastern and northeastern regions on the basis of consolidating the good achievements of the central and western regions, narrowing the difference of coupling and coordination between different regions, learn from the excellent regional development experience to form a demonstration effect, and jointly promote the energy conservation and emission reduction in the electricity industry.
Data availability statement
Publicly available datasets were analyzed in this study. These data can be found at: https://www.ceads.net.cn/.
Author contributions
YZ: methodology, data processing, formal analysis, and writing—original draft preparation. HZ: methodology, data processing, formal analysis, and writing—original draft preparation. FH: conceptualization, funding acquisition, and project management. All authors contributed to the manuscript and approved the submitted version.
Funding
The study was supported by Key Projects of Tianjin Philosophy and Social Science Fund (TJTJ21-001).
Conflict of interest
The authors declare that the research was conducted in the absence of any commercial or financial relationships that could be construed as a potential conflict of interest.
Publisher’s note
All claims expressed in this article are solely those of the authors and do not necessarily represent those of their affiliated organizations, or those of the publisher, the editors, and the reviewers. Any product that may be evaluated in this article, or claim that may be made by its manufacturer, is not guaranteed or endorsed by the publisher.
References
Aflaki, S., and Netessine, S. (2017). Strategic investment in renewable energy sources: The effect of supply intermittency. Manuf. Serv. Oper. Manag. 19 (3), 489–507. doi:10.1287/msom.2017.0621
Braungardt, S., Burger, V., and Kohler, B. (2021). Carbon pricing and complementary policies-consistency of the policy mix for decarbonizing buildings in Germany. Energies 14 (21), 7143. doi:10.3390/en14217143
Burnham, A., Han, J., Clark, C. E., Wang, M., Dunn, J. B., and Palou-Rivera, I. (2012). Life-cycle greenhouse gas emissions of shale gas, natural gas, coal, and petroleum. Environ. Sci. Technol. 46 (2), 619–627. doi:10.1021/es201942m
Castillo, A., and Linn, J. (2011). Incentives of carbon dioxide regulation for investment in low-carbon electricity technologies in Texas. Energy Policy 39 (3), 1831–1844. doi:10.1016/j.enpol.2011.01.022
Chen, W., Chen, J., and Ma, Y. K. (2021). Renewable energy investment and carbon emissions under cap-and-trade mechanisms. J. Clean. Prod. 278, 123341. doi:10.1016/j.jclepro.2020.123341
Cheng, X., Long, R. Y., Chen, H., and Li, Q. W. (2019). Coupling coordination degree and spatial dynamic evolution of a regional green competitiveness system-a case study from China. Ecol. Indic. 104, 489–500. doi:10.1016/j.ecolind.2019.04.003
Cui, D., Chen, X., Xue, Y. L., Li, R., and Zeng, W. H. (2019). An integrated approach to investigate the relationship of coupling coordination between social economy and water environment on urban scale - a case study of kunming. J. Environ. Manag. 234, 189–199. doi:10.1016/j.jenvman.2018.12.091
Daniel-Gromke, J., Rensberg, N., Denysenko, V., Stinner, W., Schmalfuss, T., Scheftelowitz, M., et al. (2018). Current developments in production and utilization of biogas and biomethane in Germany. Chem. Ing. Tech. 90 (1-2), 17–35. doi:10.1002/cite.201700077
Fan, J., Zhao, D. T., Wu, Y. R., and Wei, J. C. (2014). Carbon pricing and electricity market reforms in China. Clean. Technol. Environ. Policy 16 (5), 921–933. doi:10.1007/s10098-013-0691-6
Fang, Z., Razzaq, A., Mohsin, M., and Irfan, M. (2022). Spatial spillovers and threshold effects of internet development and entrepreneurship on green innovation efficiency in China. Technol. Soc. 68, 101844. doi:10.1016/j.techsoc.2021.101844
Fuss, S., Szolgayova, J., Khabarov, N., and Obersteiner, M. (2012). Renewables and climate change mitigation: Irreversible energy investment under uncertainty and portfolio effects. Energy Policy 40, 59–68. doi:10.1016/j.enpol.2010.06.061
Gnansounou, E., Dong, J., and Bedniaguine, D. (2004). The strategic technology options for mitigating CO2 emissions in power sector: Assessment of shanghai electricity-generating system. Ecol. Econ. 50 (1-2), 117–133. doi:10.1016/j.ecolecon.2004.03.028
Grossman, G. M., and Krueger, A. B. (1995). Economic growth and the environment. Q. J. Econ. 110 (2), 353–377. doi:10.2307/2118443
Haxhimusa, A., and Liebensteiner, M. (2021). Effects of electricity demand reductions under a carbon pricing regime on emissions: Lessons from COVID-19. Energy Policy 156, 112392. doi:10.1016/j.enpol.2021.112392
Hirth, L. (2018). What caused the drop in European electricity prices? A factor decomposition analysis. Energy J. 39 (1), 143–157. doi:10.5547/01956574.39.1.lhir
Iqbal, W., Tang, Y. M., Chau, K. Y., Irfan, M., and Mohsin, M. (2021). Nexus between air pollution and NCOV-2019 in China: Application of negative binomial regression analysis. Process Saf. Environ. Prot. 150, 557–565. doi:10.1016/j.psep.2021.04.039
Irfan, M., Elavarasan, R. M., Ahmad, M., Mohsin, M., Dagar, V., and Hao, Y. (2022). Prioritizing and overcoming biomass energy barriers: Application of AHP and G-TOPSIS approaches. Technol. Forecast. Soc. Change 177, 121524. doi:10.1016/j.techfore.2022.121524
Jin, G., Guo, B., and Deng, X. (2020). Is there a decoupling relationship between CO2 emission reduction and poverty alleviation in China?[J]. Technol. Forecast. Soc. Change 151, 119856. doi:10.1016/j.techfore.2019.119856
Jin, L., Duan, K. R., Shi, C. M., and Ju, X. W. (2017). The impact of technological progress in the energy sector on carbon emissions: An empirical analysis from China. Int. J. Environ. Res. Public Health 14 (12), 1505. doi:10.3390/ijerph14121505
Kis, Z., Pandya, N., and Koppelaar, R. (2018). Electricity generation technologies: Comparison of materials use, energy return on investment, jobs creation and CO2 emissions reduction. Energy Policy 120, 144–157. doi:10.1016/j.enpol.2018.05.033
Kok, A. G., Shang, K., and Yucel, S. (2018). Impact of electricity pricing policies on renewable energy investments and carbon emissions. Manag. Sci. 64 (1), 131–148. doi:10.1287/mnsc.2016.2576
Lee, J. W. (2013). The contribution of foreign direct investment to clean energy use, carbon emissions and economic growth. Energy Policy 55, 483–489. doi:10.1016/j.enpol.2012.12.039
Li, J. Y., and Li, S. S. (2020). Energy investment, economic growth and carbon emissions in China-empirical analysis based on spatial durbin model. Energy Policy 140, 111425. doi:10.1016/j.enpol.2020.111425
Li, L., and Qi, P. (2011). The impact of China’s investment increase in fixed assets on ecological environment: An empirical analysis. Energy Procedia 5, 501–507. doi:10.1016/j.egypro.2011.03.087
Li, W., Chien, F., Hsu, C. C., Zhang, Y., Nawaz, M. A., Iqbal, S., et al. (2021). Nexus between energy poverty and energy efficiency: Estimating the long-run dynamics. Resour. Policy 72, 102063. doi:10.1016/j.resourpol.2021.102063
Liu, N., Liu, C., Xia, Y., and Da, B. (2018). Examining the coordination between urbanization and eco-environment using coupling and spatial analyses: A case study in China. Ecol. Indic. 93, 1163–1175. doi:10.1016/j.ecolind.2018.06.013
Ma, R. K., and Liu, F. C. (2018). Intra- and inter-regional technology transfer and co2 emissions in China: Comparing the effects of energy and environmental technologies. Appl. Ecol. Environ. Res. 16 (1), 709–723. doi:10.15666/aeer/1601_709723
Morris, J. F., Srikrishnan, V., Webster, M. D., and Reilly, J. M. (2018). Hedging strategies: Electricity investment decisions under policy uncertainty. Energy J. 39 (1), 101–122. doi:10.5547/01956574.39.1.jmor
Oggioni, G., and Smeers, Y. (2012). Evaluating the application of different pricing regimes and low carbon investments in the European electricity market. Energy Econ. 34 (5), 1356–1369. doi:10.1016/j.eneco.2012.06.012
Pahle, M., Lessmann, K., Edenhofer, O., and Bauer, N. (2013). Investments in imperfect power markets under carbon pricing: A case study based analysis. Energy J. 34 (4), 199–227. doi:10.5547/01956574.34.4.10
Peng, J. Y., Zhang, Y. G., Xie, R., and Liu, Y. (2018). Analysis of driving factors on China’s air pollution emissions from the view of critical supply chains. J. Clean. Prod. 203, 197–209. doi:10.1016/j.jclepro.2018.08.219
Petitet, M., Finon, D., and Janssen, T. (2016). Carbon price instead of support schemes: Wind power investments by the electricity market. Energy J. 37 (4), 109–140. doi:10.5547/01956574.37.4.mpet
Santen, N. R., Webster, M. D., Popp, D., and Perez-Arriaga, I. (2017). Inter-temporal r&d and capital investment portfolios for the electricity industry’s low carbon future. Energy J. 38 (6), 1–24. doi:10.5547/01956574.38.6.nsan
Schafer, S. (2019). Decoupling the eu ets from subsidized renewables and other demand side effects: Lessons from the impact of the eu ets on co2 emissions in the German electricity sector. Energy Policy 133, 110858. doi:10.1016/j.enpol.2019.06.066
Shahbaz, M., Sinha, A., Raghutla, C., and Vo, X. V. (2022). Decomposing scale and technique effects of financial development and foreign direct investment on renewable energy consumption. Energy 238, 121758. doi:10.1016/j.energy.2021.121758
Sun, L., Cao, X., Alharthi, M., Zhang, J., Taghizadeh-Hesary, F., and Mohsin, M. (2020). Carbon emission transfer strategies in supply chain with lag time of emission reduction technologies and low-carbon preference of consumers. J. Clean. Prod. 264, 121664. doi:10.1016/j.jclepro.2020.121664
Turner, S. W. D., Hejazi, M., Kim, S. H., Clarke, L., and Edmonds, J. (2017). Climate impacts on hydropower and consequences for global electricity supply investment needs. Energy 141, 2081–2090. doi:10.1016/j.energy.2017.11.089
Wang, D., Jiang, D., Fu, J. Y., Lin, G., and Zhang, J. L. (2020). Comprehensive assessment of production-living-ecological space based on the coupling coordination degree model. Sustainability 12 (5), 2009. doi:10.3390/su12052009
Wang, H., Tian, T., Gong, Y., Ma, S., Altaf, M. M., Wu, H., et al. (2021). Both environmental and spatial variables affect bacterial functional diversity in mangrove sediments at an island scale. Sci. Total Environ. 753, 142054. doi:10.1016/j.scitotenv.2020.142054
Wei, X., Mohsin, M., and Zhang, Q. (2022). Role of foreign direct investment and economic growth in renewable energy development. Renew. Energy 192, 828–837. doi:10.1016/j.renene.2022.04.062
Xia, Z., Abbas, Q., Mohsin, M., and Song, G. (2020). Trilemma among energy, economic and environmental efficiency: Can dilemma of EEE address simultaneously in era of COP 21?[J]. J. Environ. Manag. 276, 111322. doi:10.1016/j.jenvman.2020.111322
Xing, L., Xue, M. G., and Hu, M. S. (2019). Dynamic simulation and assessment of the coupling coordination degree of the economy-resource-environment system: Case of wuhan city in China. J. Environ. Manag. 230, 474–487. doi:10.1016/j.jenvman.2018.09.065
Ye, S., Ge, Y., Xu, S., and Ma, X. (2022). Measurement and prediction of coupling coordination level of economic development, social stability and ecological environment in qinghai—thoughts on sustainable societal safety. Sustainability 14 (17), 10515. doi:10.3390/su141710515
Zhao, X., Zhang, X., and Shao, S. (2016). Decoupling CO2 emissions and industrial growth in China over 1993–2013: The role of investment. Energy Econ. 60, 275–292. doi:10.1016/j.eneco.2016.10.008
Zhong, H. W., Tan, Z. F., He, Y. L., Xie, L., and Kang, C. Q. (2020). Implications of COVID-19 for the electricity industry: A comprehensive review. Csee J. Power Energy Syst. 6 (3), 489–495. doi:10.17775/cseejpes.2020.02500
Zhou, D., Zhang, X. R., and Wang, X. Q. (2020). Research on coupling degree and coupling path between China’s carbon emission efficiency and industrial structure upgrading. Environ. Sci. Pollut. Res. 27 (20), 25149–25162. doi:10.1007/s11356-020-08993-w
Keywords: electricity industry, carbon emission (CE), spatiotemporal evolution characteristic, coupling coordination degree, gray system analysis
Citation: Zhang Y, Zhang H and Hao F (2023) Spatiotemporal evolution of investment-carbon emission coupling coordination in China’s electricity market. Front. Energy Res. 10:946451. doi: 10.3389/fenrg.2022.946451
Received: 17 May 2022; Accepted: 30 September 2022;
Published: 10 January 2023.
Edited by:
Tsun Se Cheong, Hang Seng University of Hong Kong, ChinaReviewed by:
Gui Jin, China University of Geosciences Wuhan, ChinaMuhammad Mohsin, Jiangsu University, China
Chengjiang Li, Guizhou University, China
Copyright © 2023 Zhang, Zhang and Hao. This is an open-access article distributed under the terms of the Creative Commons Attribution License (CC BY). The use, distribution or reproduction in other forums is permitted, provided the original author(s) and the copyright owner(s) are credited and that the original publication in this journal is cited, in accordance with accepted academic practice. No use, distribution or reproduction is permitted which does not comply with these terms.
*Correspondence: Feng Hao, ZmVuZ2hhb190amN1QDE2My5jb20=