 Mustafa Cagatay Kocer
 Ahmet Onen
 Taha Selim Ustun
 Sahin Albayrak1
- 1Department of Electrical Engineering and Computer Science, Technical University of Berlin, Berlin, Germany
- 2Department of Electrical-Electronic Engineering, Abdullah Gül University, Kayseri, Turkey
- 3Department of Electrical and Computer Engineering, College of Engineering, Sultan Qaboos University, Al-Khoud, Muscat, Oman
- 4Fukushima Renewable Energy Institute, AIST (FREA), National Institute of Advanced Industrial Science and Technology (AIST), Koriyama, Japan
The recent developments in electric vehicles (EVs) causes several issues that have not been satisfactorily addressed. One of the foremost problems is the charging–discharging processes of EV batteries with diverse characteristics. Although a charging station is the first choice in this regard, a battery swap station (BSS) is also a suitable alternative solution as it eliminates long waiting periods and battery degradation due to fast charging. BSS has the capability to ensure prompt and efficient service for electric vehicles. Since BSS has a large number of battery systems, optimum planning of the charging–discharging operations of the batteries is critical for both BSS and the grid. This study presents an optimal charging–discharging schedule for multiple BSSs based on the swap demand of privately owned EVs and electric bus (EB) public transportation system. In addition, BSSs reinforce the power grid by providing ancillary services such as peak shaving and valley filling with demand response programs. In order to increase the flexibility of the operation, the mobile swapping station (MSS) concept, an innovative and dynamic service, is introduced to the literature and added to the model. The results indicate that BSS is an essential agent in the ancillary services market and the MSS concept is a yielding solution for both BSSs and power networks. Last, the data utilized in the study for swap demand calculation and power grid analysis are real-world data from Berlin, Germany.
1 Introduction
The impact of climate change creates many problems all over the world. Efforts to prevent disasters caused by global warming ensure that improved solutions are preferred more. Among these solutions, EVs are the most effective and popular technology. However, there are significant problems that hinder the preferability of EVs, such as battery life and range anxiety (Zhang et al., 2021). Also, long charging times lead to a waste of time in the daily lives of EV owners. Although fast-charging stations have certain advantages for this challenge, the chemical structure of the batteries being damaged during fast charging brings an extra burden to EV owners (Dan et al., 2022). The BSS concept, which is a new approach, has the potential to offer solutions to many issues related to EVs.
BSS is a system that allows a discharged battery to be replaced with a fully charged one in less than a minute. With its great advantage in saving time, BSS can easily compete with gas stations compared to charging stations (Ahmad et al., 2020; Wu, 2021). BSS has a large number of batteries and can manage these battery systems with a central decision mechanism. This shows that BSS is an extremely useful technology in meeting the needs of the power grid through vehicle-to-grid services. Moreover, it can flexibly organize the charging schedule and does not create additional pressure on the network in high consumption periods. In this way, an innovative approach is developed in which operating costs are reduced for both the BSS and the power system (Kocer et al., 2019; Revankar and Kalkhambkar, 2021). Vehicle-to-grid is particularly suitable for networks with high and intermittent renewable-based generation. However, the stochastic characteristics of both renewables and EVs reduce the success rate of decision mechanisms. This causes various problems in voltage and frequency stability due to the uncertainty of demand and generation. Moreover, vehicle-to-grid systems are controlled in a decentralized way. Therefore, a mid-contractor is needed between the EV owners and the grid operator. This is a reason that reduces profit and efficiency. Since BSS is the sole authority on all batteries, there is no need for an intermediary for the provided vehicle-to-grid services (Kocer et al., 2018; Kocer et al., 2021).
In addition to charging stations and BSS, another concept that has emerged recently is mobile stations. With the help of these services, EVs achieve the energy that provides extra range without coming to main stations. The first application of these technologies is the mobile charging station (Afshar et al., 2021). In the future, MSS will gain popularity with the spread of BSSs and EVs with appropriate technical designs for swapping operations. As these systems reduce the swap demand reaching the station, BSSs can allocate more capacity for ancillary services. Therefore, assistive technologies such as MSS are factors that increase the profitability of BSS and similar systems.
The MSS concept has not been studied much in the literature. Only Shao et al. (2017) can be presented as a general study on this subject. In this study, a van providing MSS service is designed, and its service process and economic analyses are mentioned. Studies on mobile services mostly focus on mobile charging station technology. In Atmaja and Amin (2015), the authors determined the most suitable Li-ion battery and ultracapacitor type for mobile stations to provide a fast-charging service. The interior design of stations is also mentioned. Fodorean et al. (2019) and Zhang et al. (2020) offer a mobile solution for urban and resort areas. The authors of Raboaca et al. (2020) developed an optimal scheduling algorithm for charging stations serving temporarily in different regions.
One of the pioneering studies on BSS is Sarker et al. (2015). The authors created a cost optimization problem by considering the indecision in the swap demand and day-ahead planning. In Rao et al. (2015), the swap demand is estimated by conducting a survey of EV driver characteristics, and the operation is optimized. Liu et al. (2015) present an optimal charging plan for BSS operating as a photovoltaic-based prosumer. Also, one of the systems that BSS can contribute efficiently to is public transport bus services (PTBS) due to its stable operation plan. Kocer et al. (2021) and You et al. (2016) give a daily optimal schedule for BSS, which provides swap services to EBs working for PTBS. BSS, which shapes the charging schedule according to different demand response (DR) programs, is studied in Ke et al. (2020). With the help of the electric taxi data in Beijing, the BSS system is planned and the daily profit is maximized by linear programming by the researchers of Liang et al. (2017). A simulation-based analysis of BSS’s economic operations is examined in Wu (2022) by analyzing the real data of eight different BSSs located in Guangzhou, China.
There are several important studies examining the effect of BSS on the grid. In Kang et al. (2016), while reducing the daily cost of a station providing charging–swapping services, the voltage stability and power loss of the power grid are also taken into account. Esmaeili et al. (2019) create an optimal strategy for BSS and microgrid operations. Zhang et al. (2021) analyze the contribution of BSSs to frequency regulation services by constructing a two-stage model. The authors of Yang et al. (2021) investigate the impact of multiple BSS on ancillary services such as peak shaving and valley filling with the self-adaptive dispatching strategy.
This article presents the following contributions:
1) In this study, besides introducing the concept of MSS to the literature, economic analyses of BSS working with MSS are also performed. For this analysis, the optimal operation of BSS and the influence of extra capacity provided by MSS on ancillary services are examined.
2) The benefits of MSS for BSS and grid are investigated not only from an economic but also from a technical perspective. Hence, the impact of MSS is carried out in comparison with demand response programs, and the results are presented to the reader.
3) Data used for swap demand calculation and power grid analysis are real data coming from the region of Berlin, Germany.
The remainder of the article is organized as follows. Section 2 presents the system model of BSS and MSS. Section 3 proposes problem formulation, which includes swap demand and optimization models. In Section 4, the results of case studies are given to prove the effectiveness of the developed model. Lastly, Section 5 concludes the article.
2 System model
In this part, information about the working principles of BSS is given. The batteries in the station are in either charging, discharging, swapping, or standby modes. BSS comprises control, communication, power, forecast, and decision sections as shown in Figure 1. MSS, on the other hand, consists of control, communication, and decision units only. MSS charges empty batteries in BSS and loads them into the vehicle. Therefore, it does not need a power unit. The forecast section obtains information about the grid data and distribution of battery swap demand during the day and reports it to the decision center. The communication section connects with customers, MSS, and the grid operator. The power unit has the necessary equipment for charging and discharging processes. The decision center gives an order to the control section according to the energy capacity and demand data of the BSS. The control section follows the instructions of the decision center and manages the operational status of the batteries. In addition, when BSS needs extra capacity, it contacts MSS via the communication unit and calls MSS to BSS.
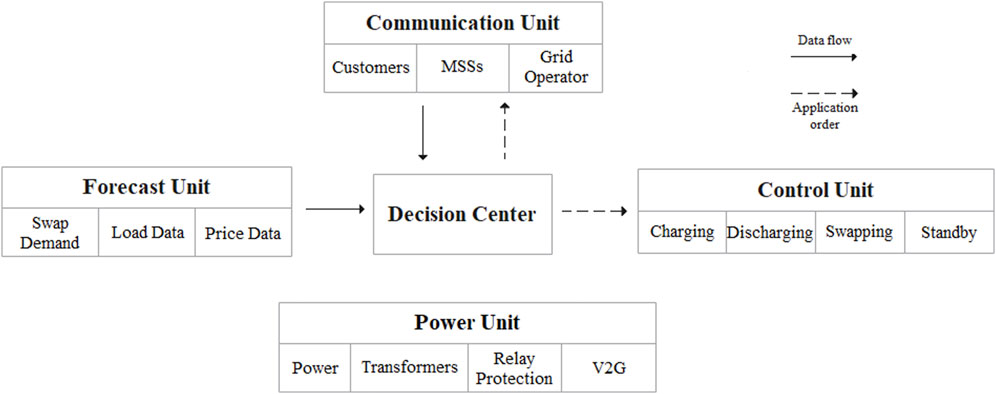
FIGURE 1. General structure of BSS.
The BSS serves not only EVs and EBs but also the power grid. In Figure 2, the interactions of BSSs with the grid are shown. The system consists of the power network, grid operator, and BSSs. The operator determines the needs of the power grid and connects with the communication units of the BSSs. Peak shaving and valley filling through demand response programs are some of these needs. BSSs optimize operations according to day-ahead energy prices and notify the operator about the hours reserved for charging and regulation services. Thus, BSSs support the network by means of the vehicle-to-grid infrastructure. However, the main task of BSSs is to meet the swap demand, and in this process, BSSs need to provide a sustainable service to their customers.
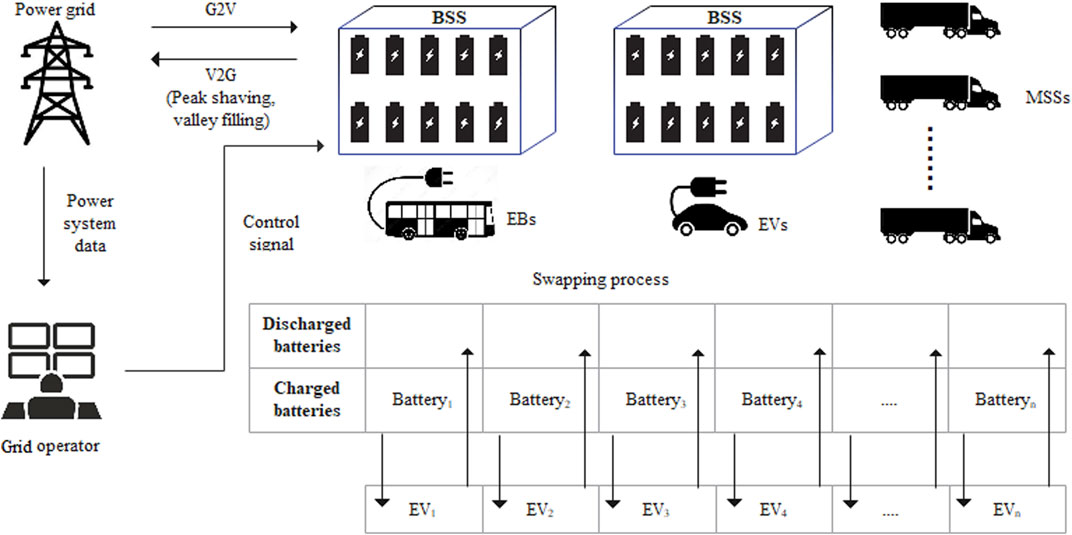
FIGURE 2. Interactions of BSSs with the grid.
3 Problem formulation
3.1 Battery swap demand models
In the study, two BSSs are examined. The first BSS (BSS1) serves EBs working at Berlin PTBS, while the second BSS (BSS2) serves EVs. Since PTBS has a regular operation schedule of 24 h, the swap demand characteristics of BSS1 are different from those of BSS2. There is also a difference between swap demands because the battery capacities of EBs are larger than those of EVs and the number of vehicles arriving at the station is not the same.
3.1.1 The first battery swap station demand model
In this part, the model utilized in the battery swap demand calculation of BSS1 is presented. It is worth mentioning again that BSS1 offers services to the EBs running in Berlin public transport system. Thus, computations are based on real-world data from the PTBS in Berlin, Germany.
In order to achieve the swap demand, the energy consumption of each EB during the trip from terminus to terminus is calculated. First, the energy used between two consecutive stops is calculated using an analytical-based model. Second, using the number of stops on every bus line and the number of daily trips of EBs, the battery swap demand of BSS1 for a 24 h period is obtained.
An analytical-based model for battery energy consumption is used to calculate the utilized energy “terminus-to-terminus” on a bus route by calculating the energy consumed between two consecutive bus stops. This model is based on a prevalent longitudinal dynamics model (Shekhar et al., 2016; Gallet et al., 2018; Kocer et al., 2021).
The tractive force
The term
If data on the number of in-vehicle passengers are available, the total mass of the vehicle can be determined as
The expression
The expression η is an efficiency factor used for the losses in the inverter, motor, and drivetrain. While the vehicle is braking
In order to assess the energy consumption of the EB, developing a driving profile between consecutive stops is a must. Hence, the model in Gallet, Massier,and Hamacher (2018) is wielded to constitute the driving characteristics.
A trip between two consecutive stops involves
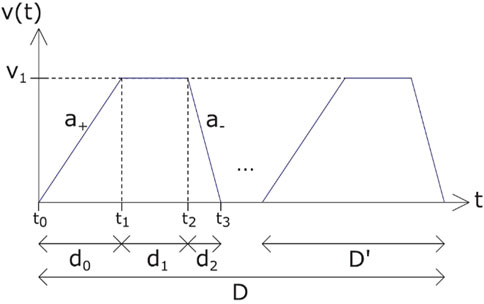
FIGURE 3. The trip profile between two consecutive stops.
For simplicity, it is assumed that there is only one intermediate halt point between two stops, that is,
The energy consumption between consecutive bus stops (
The terminus-to-terminus energy consumption (
The values of the parameters introduced in this section are given in Table 1.
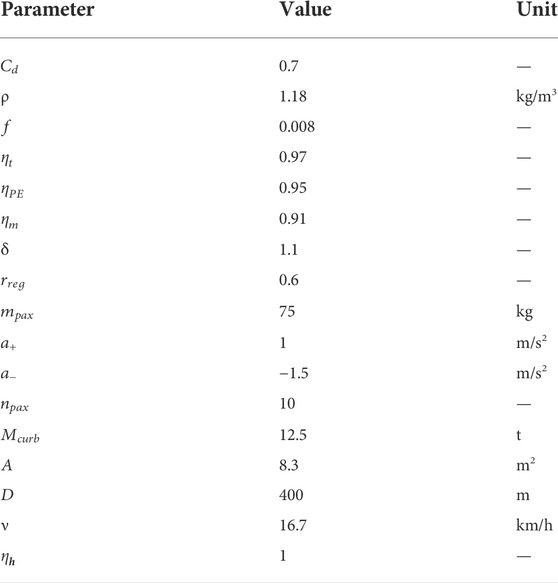
TABLE 1. Parameters in swap demand calculation of BSS1.
3.1.2 The second battery swap station demand model
The BSS2 serves EVs rather than large-sized vehicles like EBs. Therefore, there is a difference in the demand characteristics. An analytical-based method is used for the swap demand of BSS1. Another approach is followed for BSS2, and a data-driven model based on real-world measurements is used. GasBuddy (GasBuddy, 2018) conducted research on more than 30 million customers’ gas station visits in 2018. As a result of the study, data on gas station hourly visit percentages are obtained. Thus, BSS2’s swap demand is created based on percentage data by determining a suitable number of vehicles in case studies.
3.2 Optimization model
3.2.1 Objective function
The aim of BSSs in the study is to maximize their income. To achieve this, BSSs must perform their 24 h operations optimally. An objective function based on mixed-integer linear programming has been created for BSSs. It is shown in Eq. 9 and consists of two components; charging costs and regulation income.
λ denotes the electricity prices for charging and discharging.
3.2.2 Constraints
The constraints are set for both BSSs and MSS.
Equation 10 gives the impact of operations performed in time t on the available capacity at time t+1.
Charging and discharging powers must be within a certain range. This is important for the grid and battery. Equations 11 and 12 keep BSS’s charging–discharging power in this range.
The total capacity of the BSS has to be limited. Eq. 14 presents
Eq. 15 secures that BSS continues operation within the specified limits in the entire scheduling horizon while considering the initial capacity.
In addition, BSS’s main responsibility is to make swap operations sustainable. BSS’s available capacity has to meet the next hour’s demand. Eq. 16 ensures that, and DB,t+1 denotes the next hour swap demand.
The number of batteries in MSS is limited to how many batteries the vehicle can take.
The capacity allocated by BSS for regulation is not more than the available capacity, and it does not create a problem with meeting the swap demand.
4 Results
Two BSSs with different characteristics are chosen for the application of the methodology clarified in the previous sections. The first BSS (BSS1) is designed for EBs running for the PTBS in Berlin. BSS1 optimizes the charging–discharging operation according to the swap demand profile obtained using data from the daily PTBS in Berlin, Germany. The data belong to 50 different public transport bus lines (Berliner Verkehrsbetriebe BVG, 2022). Hence, the routes of each EB are unique. The second BSS (BSS2) serves EVs. BSS2 provides a typical gas station service and has similar characteristics. Since BSS1 serves EBs, the capacity of each battery it has is higher than that of BSS2’s. Therefore, the total energy capacity is higher than that of BSS2. Both stations have 150 kW charging power and 50 charging units. The battery capacity of each EB and EV is assumed to be 337 kW and 100 kWh, respectively. BSSs have their own MSS services. If necessary, BSSs receive assistance from these MSSs to reduce the swap demand. There are 5 kWh × 337 kWh batteries in each MSS of BSS1 and 5 kWh × 100 kWh batteries in each MSS of BSS2. The total number of MSS varies according to the needs of BSSs.
Peak shaving and valley filling services provided by BSSs are shown on real daily load data from Berlin (Stromnetz Berlin - Grid user, 2022). In the study, two different load profiles belonging to residential and industrial areas in Berlin are used. The scheduling horizon of the case study is 24 h from midnight to midnight, and the resolution is 1 h. Also, initially, BSSs start with empty batteries.
4.1 Battery swap demand
As stated before, BSS1 meets the battery swap demand of 50 different EBs running for PTBS. The method used to calculate the swap demand is already given in Section 2. Each EB creates a swap demand when the battery SoC level falls in the 5–10% range. The swap demand capacity that BSS needs to meet throughout the day is given in Figure 4. There is no swap demand until 4 h as all EBs start with a fully charged battery. Then, the peak value is reached due to the accumulated swap demand. As seen in Figure 4, the demand characteristic created by EBs is very different from the those of charging station and gas station profiles. Until the end of the day, the profile between 5 and 2 MW continues with ups and downs. This is an expected result as each bus has a distinctive route, timetable, number of stops, and trip duration. As the PTBS operations decrease at night, the battery swap demand diminishes at the end of the day. During the whole day, BSS1 has over 300 swap requests from 50 EBs, and the total charge capacity is 71.5 MW.
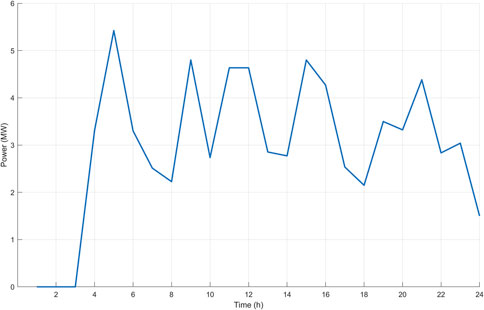
FIGURE 4. Battery swap demand for BSS1.
The daily swap demand profile requested from BSS2 is given in Figure 5. The demand characteristic is very different from BSS1. BSS1 demand is dependent on PTBS plans, while swap demand for BSS2 is specific to individual EVs and traffic flow characteristics. BSS2 serves a total of 300 EVs during the day. The battery capacity of each is 100 kWh. Since BSS starts the process with empty batteries, the swap demand at 1 h is eliminated. The average hourly demand is 1.25 MW. Swap demand is low until the early hours of the morning. A gradual increase is observed up to 18 h, and the peak value of 2.6 MW is achieved. After this point, there is a rapid decrease, and at the end of the day, the demand falls below 0.5 MW.
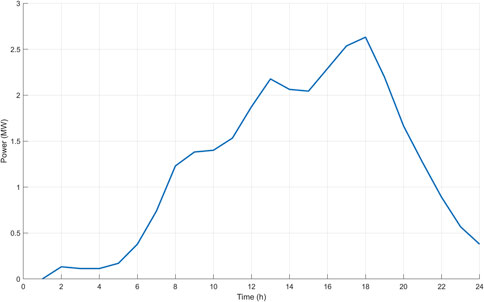
FIGURE 5. Battery swap demand for BSS2.
4.2 Case studies
4.2.1 Case 1: Battery swap station with mobile support
One of the main focuses of the study is to analyze the contributions of MSSs to BSSs. MSSs are expected to take a much more active role in the future. It is an option that ensures flexibility for BSSs and the power grid, especially with the extra capacity it provides in emergency situations. In Figures 6, 7, the optimal charging–discharging (regulation) operation schedule for BSSs is presented in two different ways, with and without MSS support. BSSs are allowed to use MSS support after the time when the swap demand exceeds the average demand until the demand starts to decrease significantly. After the MSS is used, the batteries need to be recharged and the use of MSSs is also reflected as a cost. Therefore, BSSs pay attention to electricity prices and swap demand and use MSSs as extra capacity. BSS1 and BSS2 seek help from different MSS types as their battery capacities are 337 and 100 kWh, respectively. Both MSS types contain five batteries, each ready to be swapped. BSSs can only use one MSS in a time frame. This corresponds to 1,685 and 500 kWh extra capacity for BSS1 and BSS2, respectively, in a single time period.
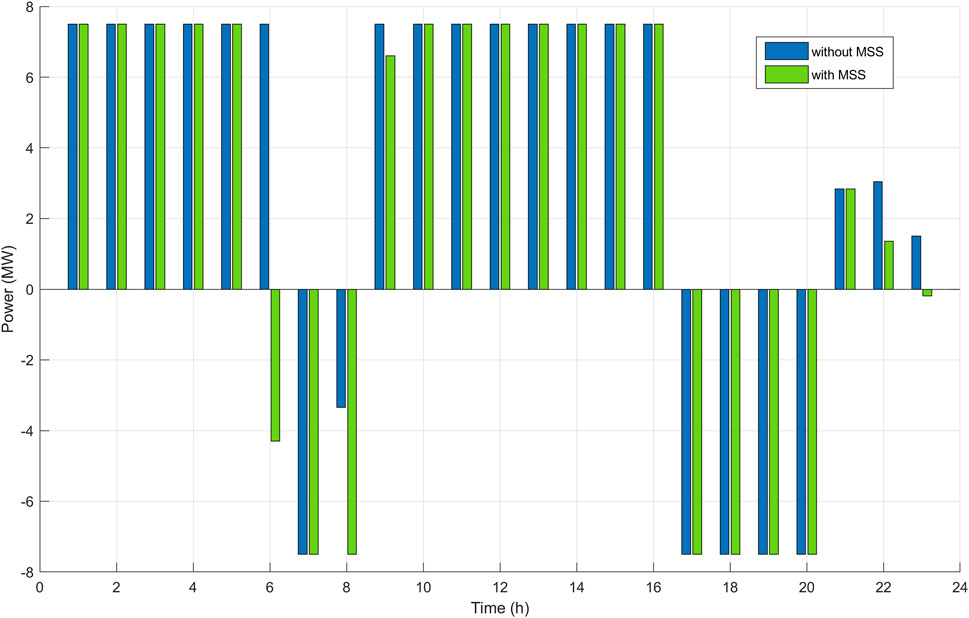
FIGURE 6. The optimal charging-discharging schedule for BSS1.
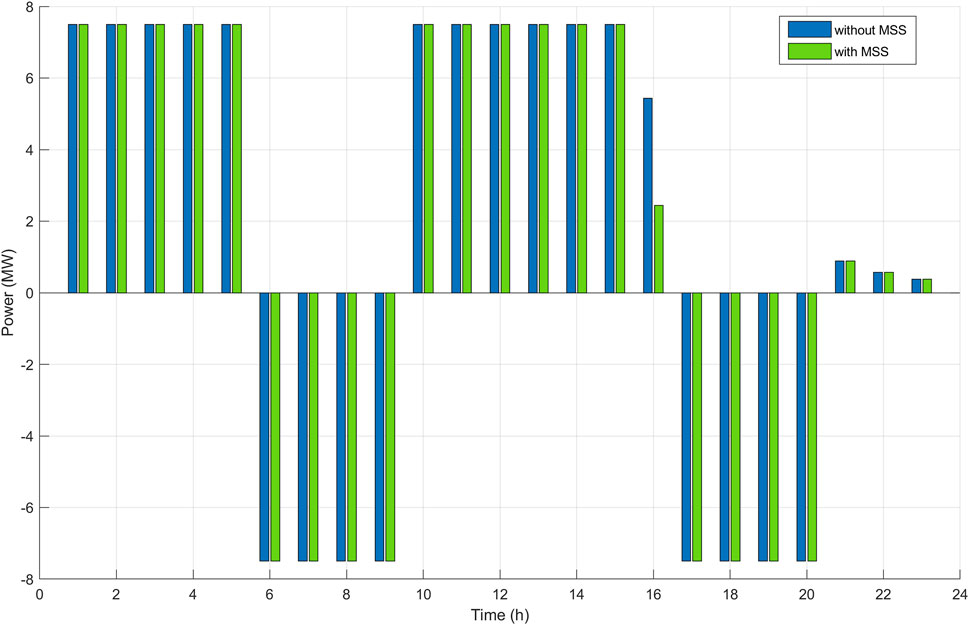
FIGURE 7. The optimal charging-discharging schedule for BSS2.
It should be remembered that although the charging capacities of BSSs are the same, there is a great difference in swap demands. Therefore, the impact of MSSs on the operation schedule of BSSs is not the same. Also, Figures 6, 7 only give the power consumption and regulation capacity of the BSSs. Since MSS is used to reduce the swap demand in the specified time period, the charging load of MSS is not shown in the figures. When the daily optimum profile of BSS1 is examined, a total 20 MW charging power difference is seen between with and without MSS options in Figure 6. In line with these data, it can be said that MSS is an important resource in terms of providing flexibility. The biggest difference during the day occurred at 6 h. BSS1, which reduced swap demands by using MSS until this time and has reserved a 4.1 MW regulation capacity instead of consuming 7.5 MW charging power.
MSSs for BSS2 do not make as much difference as for BSS1. This is because the charging capacity of BSS2 is large enough to easily meet the swap demand. It does not need the extra capacity MSS can provide. The biggest difference in operation schedule occurs at 16 h. The magnitude of this difference is 3 MW, and this is also the total difference for a 24 h scheduling horizon. While BSS2 charges aggressively during periods when the electricity price is low, it contributes to regulating services in periods where it can generate a high profit.
BSSs can only use one MSS per time period. BSSs prefer this support to reduce the swap demand in the specified time frame. Swap demands met by BSSs before and after receiving MSS support are given in Figure 8. In Figure 8, it can be seen when BSS1 uses MSSs. By using MSSs, BSS1 ensures a significant decrease in swap demands, particularly between 4 and 16 h. By using the extra capacity of MSSs, BSS1 achieves a 0.85-MW decrease in daily average swap demand. BSS2 needs fewer MSSs as its charging capacity is much higher than that of swap demand. As can be seen, BSS2 only used MSSs in the 10–15 h time interval when the demand increased. Even if the swap demand reaches its peak in the following periods, BSS2 does not need the support of MSS as it has sufficient energy capacity. The average swap demand of BSS2 declines by only 0.12 MW.
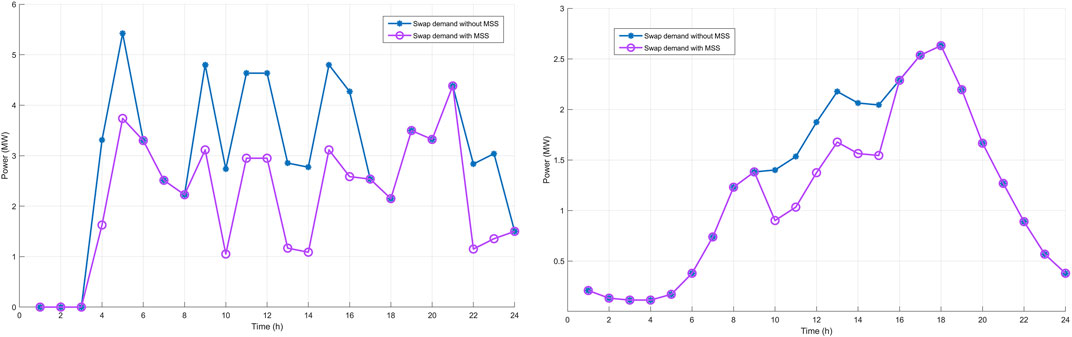
FIGURE 8. Swap demand reduction for BSSs by using MSS support.
The impact of the MSS option on the daily operational cost of BSSs is given in Table 2. These data are achieved by subtracting the revenue of the regulation services from the charging costs. MSS ensures a 40% cost reduction for BSS1. The daily cost reduction for BSS2 is 32% as it uses less MSS.
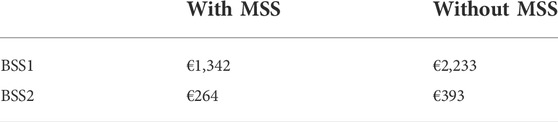
TABLE 2. The daily operational cost of BSSs in EUR by MSS option.
4.2.2 Case 2: Contribution of battery swap stations to peak shaving and valley filling by leveraging demand response and mobile swapping station
BSSs have the potential to consume high levels of energy. Therefore, such restrictions may be required during the charging–discharging schedules of these stations. With the help of demand response programs, BSSs can provide various advantages instead of creating a negative effect on the grid, as they are more flexible about charging times. Peak shaving and valley filling are the most suitable ancillary services for BSSs. For the second case study, the operation schedule of the BSSs without MSS support is planned according to the demand response levels of 20%, 40%, and 50%. More specifically, BSSs are not allowed to charge when the load level is more than +20%, +40%, or +50% of the average load so as not to increase the stress on the grid. The peak shaving and valley filling services provided by BSSs, as a result of the optimized daily schedule according to the DR programs applied to residential and industrial load profiles, are shown in Figures 9, 10.
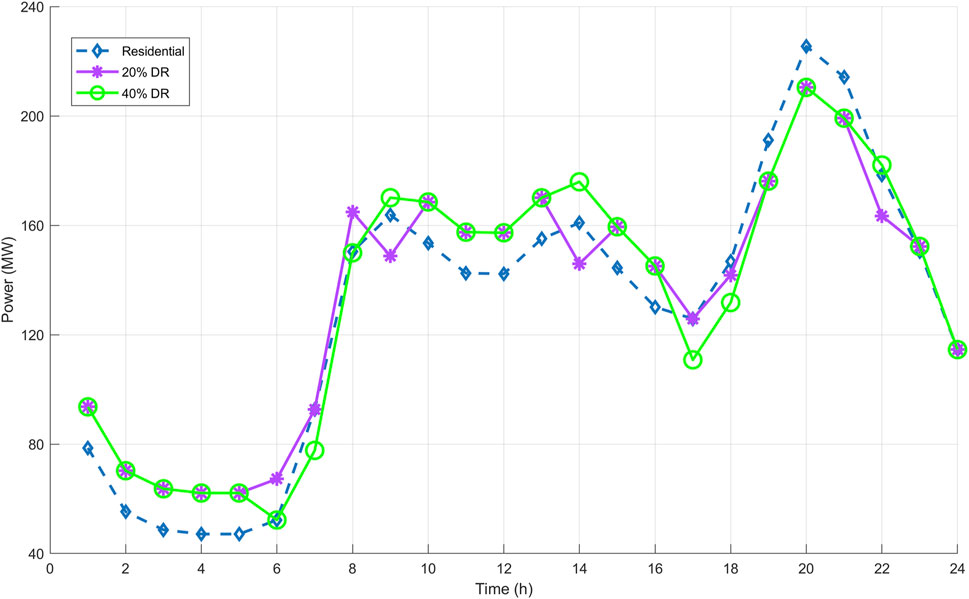
FIGURE 9. Peak shaving and valley filling services provided by BSSs in a residential area with different DR programs.
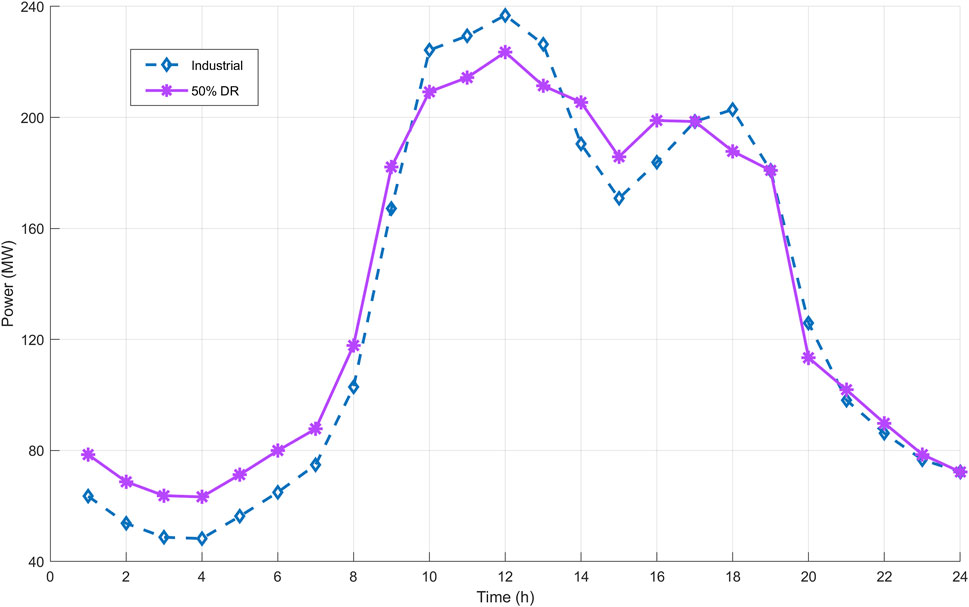
FIGURE 10. Peak shaving and valley filling services provided by BSSs in an industrial area with different DR programs.
In Figure 9, BSSs are assumed to be in a residential area. DR programs determined for residential load are 20% and 40%. Accordingly, in times when the load level exceeds +20% and +40% of the average daily load, BSSs are prevented from increasing the load on the grid by charging batteries. For the 20% DR case, the load level that must not be exceeded is 155 MW. Therefore, BSSs are not allowed to charge the batteries when the load level is higher than 155 MW. In this case, BSSs allocate these time slots to regulation services instead of charging. In this way, a decrease in peak load levels is observed. Particularly, the peak at 20 h is successfully reduced. BSSs charge batteries aggressively when the load level and electricity prices are low in order to provide regulation service in the determined time frames. In this way, the difference between the highest and lowest load levels is reduced. It is observed that a successful valley filling service is provided by BSSs, especially when the first hours of the day are considered. Since the 20% DR program is more restrictive than the 40% one, the peak shaving and valley filling processes obtained in this program are more noteworthy. The daily operating costs of BSSs under DR programs are given in Table 3. These costs are obtained by subtracting the income of the regulation services from the charging costs. As can be seen from Table 3, DR programs create a 15% cost difference for BSS1. This value increases to 30% for BSS2.
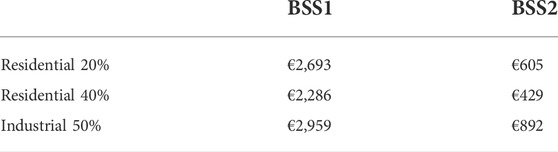
TABLE 3. The daily operational cost of BSSs with DR programs in residential and industrial areas.
Since the load levels in the industrial region are very high within working hours, the DR program is planned more flexibly considering the characteristics of this region, and +50% of the average load is deemed appropriate. Figure 10 shows the valley filling and peak shaving processes in the industrial area. Peak levels in electricity consumption are reached at noon. Hence, BSSs reduce the stress of the network with the regulation services they provide in this time period, and peak levels are reduced in the time frame between 10 and 13 h. In addition, the batteries are charged in the first part of the scheduling horizon, contributing to the valley filling services. The costs of BSSs for the industrial area are shown in Table 3. Although the DR program in the industrial area is more flexible, the daily cost of the BSSs is higher than that in the residential area.
The extra capacity MSS provides allow BSSs to avoid high-demand periods. This makes MSS more advantageous than charging stations. In this way, the pressure on the grid can be reduced. Figure 11 shows the impact of BSSs using MSSs on residential load. MSSs have to be recharged after use. Therefore, charging loads are reflected in the time period when MSSs are used. The extra capacity MSS offered in the residential region has successfully performed during peak shaving and valley filling operations. This impact becomes greater as the number of MSS increases.
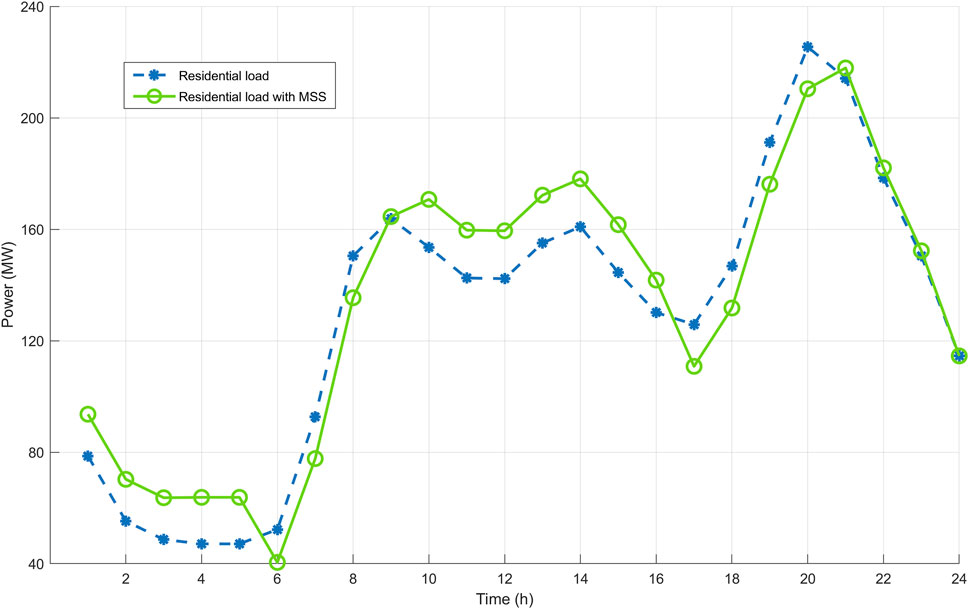
FIGURE 11. Peak shaving and valley filling services provided by BSSs in a residential area with MSS support.
Figure 12 gives the influence of MSSs on peak shaving and valley filling in an industrial area. Although the valley filling process is successful up to 6 h, an increase is observed in the peak levels at noon. This is because BSSs allocate noon hours for charging operations. It is an inevitable condition to meet the swap demands and to avoid charging in the morning and evening hours. However, there is a significant decrease in the peak level at 18 h. Thus, by increasing the number of MSSs for industrial areas, peak shaving operations can be performed more successfully.
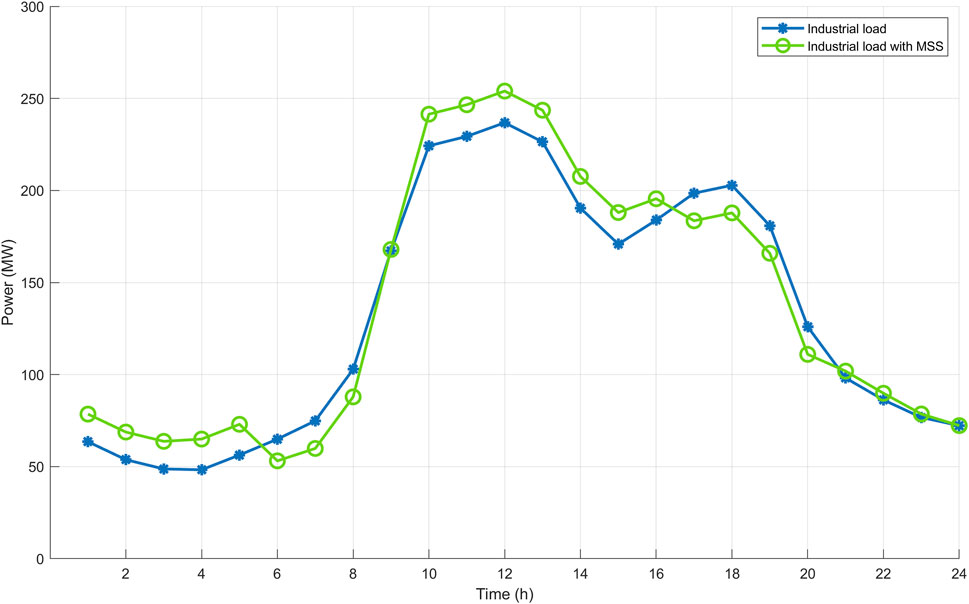
FIGURE 12. Peak shaving and valley filling services provided by BSSs in industrial area with MSS support.
5 Conclusion
The BSS concept creates innovative opportunities for EVs and power systems. In this study, a daily optimum charging–discharging schedule is modeled for two BSSs with different characteristics. A detailed analytical approach and data-driven models are used for the swap demand of BSSs. In addition, MSS, a new and innovative concept, is introduced to the literature and added to the problem formulation to generate flexibility in BSS operations. As a case study, peak shaving and valley filling services by BSSs are ensured with the help of demand response programs and MSS options are examined.
According to the results, BSS1 creates a 20-MW difference in daily charge–discharge cycles by using the extra capacity provided by MSSs. Since the capacity of BSS2 is sufficient for the demand of vehicles it serves, MSS support makes a difference of only 3 MW in the 24 h horizon. In addition, the MSS option creates a difference of 40% for BSS1 and 33% for BSS2 in daily operational costs.
In the study, the impact of different DR programs on BSS operation costs and grid loads is also given. The results show that DR programs make a difference of 13% for BSS1 and 30% for BSS2 in daily operating costs. In addition, with the help of support provided by MSSs, BSSs can provide peak shaving and valley filling services similar to DR programs.
This study shows that BSSs successfully support the network in analyses carried out for residential and industrial load regions, and BSS has significant potential for ancillary services markets. MSSs provide extra battery capacity, which causes a significant decrease in the operational costs of BSSs. BSSs with MSS support ensure a salient improvement in the load levels, without the application of demand response programs. The data used in the study belong to Berlin, Germany. Finally, the outcomes show that BSS is a suitable solution for electrification of the public transportation system.
Data availability statement
The original contributions presented in the study are included in the article/Supplementary Material; further inquiries can be directed to the corresponding author.
Author contributions
MK designed the methodologies, performed the simulations, and wrote the paper. AO supervised the study and contributed to the writing of the manuscript. TU and SA assisted in reviewing and improving the study. All authors contributed to the article and approved the submitted version.
Conflict of interest
The authors declare that the research was conducted in the absence of any commercial or financial relationships that could be construed as a potential conflict of interest.
Publisher’s note
All claims expressed in this article are solely those of the authors and do not necessarily represent those of their affiliated organizations, or those of the publisher, the editors, and the reviewers. Any product that may be evaluated in this article, or claim that may be made by its manufacturer, is not guaranteed or endorsed by the publisher.
References
Afshar, S., Macedo, P., Mohamed, F., and Disfani, V. (2021).Mobile charging stations for electric vehicles - a review. Renew. Sustain. Energy Rev., 152. 111654. doi:10.1016/J.RSER.2021.111654
Ahmad, F., Saad Alam, M., Saad Alsaidan, I., and Shariff, S. M. (2020). Battery swapping station for electric vehicles: Opportunities and challenges. IET Smart Grid 3 (3), 280–286. doi:10.1049/iet-stg.2019.0059
Atmaja, T. D., and Amin, (2015).Energy storage system using battery and ultracapacitor on mobile charging station for electric vehicle. Energy Procedia, 68, 429–437. doi:10.1016/J.EGYPRO.2015.03.274
Berliner Verkehrsbetriebe BVG (2022). Launch becomes lounge: the new BVG website. Available at: https://www.bvg.de/de (Accessed: April 12, 2022).
Dan, Y., et al. (2022).Tertiary control for energy management of EV charging station integrated with PV and energy storageFront. Energy Res., 9, 855. doi:10.3389/FENRG.2021.793553/BIBTEX
Esmaeili, S., Anvari-Moghaddam, A., and Jadid, S. (2019).Optimal operation scheduling of a microgrid incorporating battery swapping stations. IEEE Trans. Power Syst., 34, 5063–5072. doi:10.1109/TPWRS.2019.2923027
Fodorean, D., Cirlea, F., Raboaca, M. S., and Filote, C. (2019).New mobile charging station for urban and resort areas. in 2019 Electric Vehicles International Conference EV. IEEE. doi:10.1109/EV.2019.8892866
Gallet, M., Massier, T., and Hamacher, T. (2018).Estimation of the energy demand of electric buses based on real-world data for large-scale public transport networks. Appl. Energy, 230, 344–356. doi:10.1016/j.apenergy.2018.08.086
GasBuddy (2018). Foot traffic report for the fuel & convenience retailing industry. Minneapolis, MN, USA. Available at: https://www.iab.com/wp-content/uploads/2018/05/GasBuddy-Foot-Traffic-Report-Q1-2018-1.pdf (Accessed: April 23, 2022).
Kang, Q., Wang, J., Zhou, M., and Ammari, A. C. (2016).Centralized charging strategy and scheduling algorithm for electric vehicles under a battery swapping scenario. IEEE Trans. Intell. Transp. Syst., 17, 659–669. doi:10.1109/TITS.2015.2487323
Ke, B. R., Lin, Y.-H., Chen, H.-Z., and Fang, S.-C. (2020).Battery charging and discharging scheduling with demand response for an electric bus public transportation system. Sustain. Energy Technol. Assessments, 40, 100741. doi:10.1016/J.SETA.2020.100741
Kocer, M. C., Cengiz, C., Gezer, M., Gunes, D., Cinar, M. A., Alboyaci, B., et al. (2019). Assessment of battery storage technologies for a Turkish power network. Sustainability 11 (13), 3669. doi:10.3390/su11133669
Kocer, M. C., Yoldas, Y., Goren, S., Onen, A., Alan, I., Al-Agtash, S., et al. (2018). Cloud induced PV impact on voltage profiles for real microgrids. in 2018 5th International Symposium on Environment-Friendly Energies and Applications (EFEA), Rome, Italy, September 24–26, 2018. Piscataway, NJ, United States: IEEE, 1–6. doi:10.1109/EFEA.2018.8617080
Kocer, M. C., Yurdakul, O., and Albayrak, S. (2021).Optimal scheduling of battery swapping stations for electric public transportation. in 2021 IEEE PES Innovative Smart Grid Technologies Europe (ISGT Europe), Espoo, Finland, October 18–21, 2021. Piscataway, NJ, United States: IEEE, 1–5. doi:10.1109/ISGTEUROPE52324.2021.9639941
Liang, Y., Zhang, X., Xie, J., and Liu, W. (2017).An optimal operation model and ordered charging/discharging strategy for battery swapping stations. Sustainability, 9. 700. doi:10.3390/SU9050700
Liu, N., Chen, Q., Lu, X., Liu, J., and Zhang, J. (2015).A charging strategy for PV-based battery switch stations considering service availability and self-consumption of PV energy. IEEE Trans. Ind. Electron., 62. 4878–4889. doi:10.1109/TIE.2015.2404316
Răboacă, M. S., Băncescu, I., Preda, V., and Bizon, N. (2020).An optimization model for the temporary locations of mobile charging stations. Mathematics, 8. 453. doi:10.3390/MATH8030453
Rao, R., Zhang, X., Xie, J., and Ju, L. (2015).Optimizing electric vehicle users' charging behavior in battery swapping mode. Appl. Energy, 155. 547–559. doi:10.1016/J.APENERGY.2015.05.125
Revankar, S. R., and Kalkhambkar, V. N. (2021).Grid integration of battery swapping station: A review. J. Energy Storage, 41. 102937. doi:10.1016/J.EST.2021.102937
Sarker, M. R., Pandzic, H., and Ortega-Vazquez, M. A. (2015).Optimal operation and services scheduling for an electric vehicle battery swapping station. IEEE Trans. Power Syst., 30. 901–910. doi:10.1109/TPWRS.2014.2331560
Shao, S., Guo, S., and Qiu, X. (2017).A mobile battery swapping service for electric vehicles based on a battery swapping van. Energies, 10, 1667. doi:10.3390/EN10101667
Shekhar, A., Prasanth, V., Bauer, P., and Bolech, M. (2016). Economic viability study of an on-road wireless charging system with a generic driving range estimation method. Energies 9 (2), 76. doi:10.3390/en9020076
Stromnetz Berlin - Grid user (2022). stromnetz.berlin. Available at: https://www.stromnetz.berlin/en/grid-use/grid-user (Accessed: April 12, 2022).
Wu, H. (2022).A survey of battery swapping stations for electric vehicles: Operation modes and decision scenarios, IEEE Trans. Intell. Transp. Syst., 23. 10163–10185. doi:10.1109/TITS.2021.3125861
Wu, Y. (2022). Economics of battery swapping for electric vehicles—simulation-based analysis. Energies 15 (5), 1714. doi:10.3390/EN15051714
Yang, J., Wang, W., Ma, K., Yang, B., and Dou, C. (2021). Optimization and self-adaptive dispatching strategy for multiple shared battery stations of electric vehicles. IEEE Trans. Ind. Inf. 17 (2), 1363–1374. doi:10.1109/TII.2020.2983393
You, P., Yang, Z., Zhang, Y., Low, S. H., and Sun, Y. (2016).Optimal charging schedule for a battery switching station serving electric buses, IEEE Trans. Power Syst., 31, 3473–3483. doi:10.1109/TPWRS.2015.2487273
Zhang, B., Niu, N., Li, H., Wang, Z., and He, W. (2021).Could fast battery charging effectively mitigate range anxiety in electric vehicle usage?Evidence from large-scale data on travel and charging in Beijing, Transp. Res. Part D Transp. Environ., 95, 102840. doi:10.1016/J.TRD.2021.102840
Zhang, F., Yao, S., Zeng, X., Yang, P., Zhao, Z., Lai, C. S., et al. (2021). Operation strategy for electric vehicle battery swap station cluster participating in frequency regulation service. Processes 9 (9), 1513. doi:10.3390/PR9091513
Keywords: battery swapping station, mobile swapping station, vehicle-to-grid, ancillary services, optimal scheduling, electric vehicle, electric bus
Citation: Kocer MC, Onen A, Ustun TS and Albayrak S (2022) Optimization of multiple battery swapping stations with mobile support for ancillary services. Front. Energy Res. 10:945453. doi: 10.3389/fenrg.2022.945453
Received: 16 May 2022; Accepted: 17 August 2022;
Published: 26 September 2022.
Edited by:
Hussein T. Mouftah, University of Ottawa, CanadaReviewed by:
Gulnur Kalimuldina, Nazarbayev University, KazakhstanYongxi Zhang, Changsha University of Science and Technology, China
Copyright © 2022 Kocer, Onen, Ustun and Albayrak. This is an open-access article distributed under the terms of the Creative Commons Attribution License (CC BY). The use, distribution or reproduction in other forums is permitted, provided the original author(s) and the copyright owner(s) are credited and that the original publication in this journal is cited, in accordance with accepted academic practice. No use, distribution or reproduction is permitted which does not comply with these terms.
*Correspondence: Mustafa Cagatay Kocer, Y2FnYXRheS5rb2NlckBkYWktbGFib3IuZGU=