Abstract
The broad development of integrated heat and electricity systems (IHES) improved the energy utilization efficiency, but it also increased the risk of cascaded accidents and the difficulty of operation. The security region that defines the permitted operation range is efficient for the planning and control of IHESs, while the accurate formulation of security region boundary renders its applications. To address this problem, this article first proposes a novel equivalent thermal model (ETM) to build the direct connection between the operations states and the control variables in the heating system. The ETM directly characterizes the network response to the inputs and accurately describes the dynamic process in the heat system. On this basis, the method to construct the security region for IHES is presented considering the thermal dynamics, where the critical boundary is formulated with a set of accurate hyperplanes. To describe the thermal dynamics, numerical simulations from different aspects verify the effectiveness of the ETM. The results of security region indicate that the thermal dynamics influence the operation security and renewable penetration in the power system significantly.
1 Introduction
Sustaining development of society and further innovation of energy utilization technology promoted the cross-cutting and integrated evolution of multienergy fields (Mancarella, 2014; Zhang et al., 2021a). As an important component of energy system, the integrated heat and electricity system (IHES) owns the characteristics of low carbon and high efficiency through the energy cascade utilization and multienergy optimization (Bitar et al., 2011; Ma et al., 2018). Its technical exploration has become the current research hotspot.
Security and economy are the fundamental requirements for the operation of IHES, which is also the basis of optimal scheduling and simultaneous control. However, the wide applications of coupling equipment, such as combined heat and power units (CHPs) and heat pumps, caused deeper interdependency between the power system (PS) and the heating system (HS), and it increased the concerns about coordinate operation. On the one hand, the dynamics at HS side (Sanjari et al., 2016; Cruz et al., 2018), which is also named thermal inertia, provides extra flexibility for the operation of the PS and promotes the penetration of renewables like photovoltaics (PVs). On the other hand, the inaccurate quantization of thermal dynamics is more likely to misguide the normal operation of IHES, thereby threatening the security of PS. Different from the PS, the thermal loads are largely influenced by the environmental factors, and this further increased the possibility of operational accidents (Li et al., 2016). A well-known electric and thermal power failure in China during 2012 is the consequence of thermal load upsurge and electric line damage, which is caused by the arctic weather, and influenced several hundred thousand inhabitants (Sina, 2009). Thus, accurately describing the response characteristic of the system state to the external inputs and analyzing the operational security under different conditions is essential for the future development of IHES.
Some methods have been proposed to study the feasibility and security of IHESs containing the operation assessment, prevention and simultaneous control, and robust planning. In terms of operation assessment, reference (Wei et al., 2018) proposed a cascading fault transfer model for PS based on graph theory and constructed the structure to evaluate the system vulnerability region. Reference (Yan et al., 2014) further optimized the evaluation structure combined with the graph theory with the physical features. In (Jiang et al., 2014; Nan et al., 2020), the concept of operation security was extended into integrated gas and electricity system, and the bidirectional coupling influence was analyzed. In terms of prevention and control, a steady-state security control strategy was proposed in (Chen et al., 2020) based on sensitivity analysis. Next, to formulate the thermal dynamics, reference (Zhang et al., 2021b) proposed an equivalent model based on the partial differential equations. Then, the global sensitivity matrix was built to describe the coupling between electric and thermal states. Also, a rolling dynamic security control was developed to ensure the normal operation under uncertainties. As for robust optimization, a coordinate optimization method was proposed in (He et al., 2018) for IHES considering the N-1 constraints and critical equipment accidents, and the multiple uncertainties were further included in (Li and Xu, 2019).
The literatures above studied the operation of IHES from different aspects. However, the analysis is conducted through traverse or optimization with various constraints. The deficiencies are summarized as follows: 1) The methods above focus on the specific operation states and are unable to obtain the operational margin visually. 2) The states proposed by optimization probably locate at the operation boundary, and the security cannot be ensured with unexpected deviations. In contrast, the security region (SR) model formulates the control strategy by delineating the operation boundary and provides the feasible operation range visually. Thus, it is an efficient method to handle the mentioned deficiencies.
Derived from the SR of PS, the SR in IHES is defined as a set of energy flow injections that satisfies the energy flow equations and operational security constraints (Liu, 1986). During the analysis of SR, the SR boundary is critically significant since it restricts the feasible points and presents the security margin visually. In this regard, reference (Xiao et al., 2012) adopted the hyperplanes to approximate the SR boundary and then constructed SR for IHES. In (Xiao et al., 2017), the convex hull method was used to build the robust SR for integrated energy system. The SR problem was formulated into a robust nonlinear programming model and solved by IPOPT. Despite the normal operation constraints, to study the SR under different accidents, the N-1 constraints were considered in (Chen et al., 2017) and (Liu et al., 2020). In (Jahromi and Bouffard, 2017), the SR in demand spaces with multiregion transmission constraints was formulated. The research indicated that the uncertain renewables like wind power and PV significantly influence the size of SR. On this basis, (Chiang and Jiang, 2018) characterized the SR of IHES with optimal energy flow and explored its potential to promote the renewable consumption. Then, the model was extended into (Wei et al., 2015), considering the PV uncertainty, and was used for robust dispatching.
The existing research studies mainly focus on the PS and integrated electricity and gas system, while the study on IHES is relatively few. In addition, the regions constructed by the current literatures are probably different from the real conditions because the dynamic transmission process is omitted. Also, this may result in an inaccurate assessment of the operation state. Moreover, according to the topology analysis, the operation states in HS are alternately solved through the pipes and nodes. It is challenging to build a direct connection between state variables and disturbance in HS, which increase the difficulty to formulate the SR boundary. To address the mentioned problems, this article proposes an equivalent thermal model (ETM) to quantitatively describe the intuitive relationships between the operation states and external disturbance in HS. Then, to formulate the accurate SR boundary, the methods to construct the SR for IHES based on ETM considering the thermal dynamics are presented. The main contributions of this article are summarized as the following:
1) An equivalent thermal model is formulated. The model constructs the intuitive connection between state and control variables instead of the recursive process in operation analysis.
2) The approach to constructing the SR of IHES considering thermal dynamics is proposed. Based on the hyperplane method, the formulation of security region boundary (SRB) is presented. The simulation results indicate that the thermal dynamics influence the SR and PV consumption of IHES significantly.
The remainder of this article is organized as follows. Section 2 describes the modeling of IHES. Section 3 proposes the ETM. Section 4 constructs the SR for IHES and the corresponding hyperplane for SRB. Case study and conclusion are given in Sections 5, 6.
2 Energy Flow in Integrated Heat and Electricity System
The structure of IHES contains three parts: the PS, the HS, and the coupling units. Both the energy systems consist of sources, networks, and loads. The energy flow distribution in PS, HS, and coupling units are given in the following part.
2.1 Energy Flow in Power System
The power flow balance at buses is expressed as the following: the energy flow in PS usually describes the active and reactive power flow distribution. Since that, the PS and HS mainly interacts through the active power flow, and this article adopts the direct current (DC) power flow model to describe the state distribution. The model is expressed as (Li et al., 2016):where PL,i, PV,i, and PG,i denote the active power of load, active power output of PV, and generators at bus i in PS, respectively; θi denotes the voltage phase angle at bus I; Bij denotes the susceptance between bus i and bus j; Pij denotes the active power flow between bus i and bus j; subscript sl denotes the variables of the slack bus. Eq. 1 denotes the active power balance at each bus; Eq. 2 denotes the active power flow balance at each branch; Eq. 3 indicates that the voltage phase angle at the slack bus equals to zero. The above equations restrict the output active power of the generators with the given load distribution.
2.2 Energy Flow in Heating System
The thermal sources and loads in HS are connected through the supply and return network, and each of the networks demonstrates a similar structure. As illustrated in Figure 1, the thermal power produced by the thermal sources are first transferred with supply water flow by circulation pumps. After arriving the load side, the consumers exchange the thermal power, and the water flow reflows into the return network. Next, finally, the return water starts at the load nodes, transfers to the source nodes, and forms a cycle. Thus, the energy flow model in HS usually contains the thermal parts and the hydraulic parts. In this study, to formulate the HS model, the widespread constant-mass-flow control strategy is adopted. In the condition, the time-varying requirements of thermal consumers are satisfied by adjusting the source supply temperature with the fixed mass flow distribution (Li et al., 2016; Zhang et al., 2021a). Due to the superior stability, the strategy is mostly adopted in North China and North Europe.
FIGURE 1
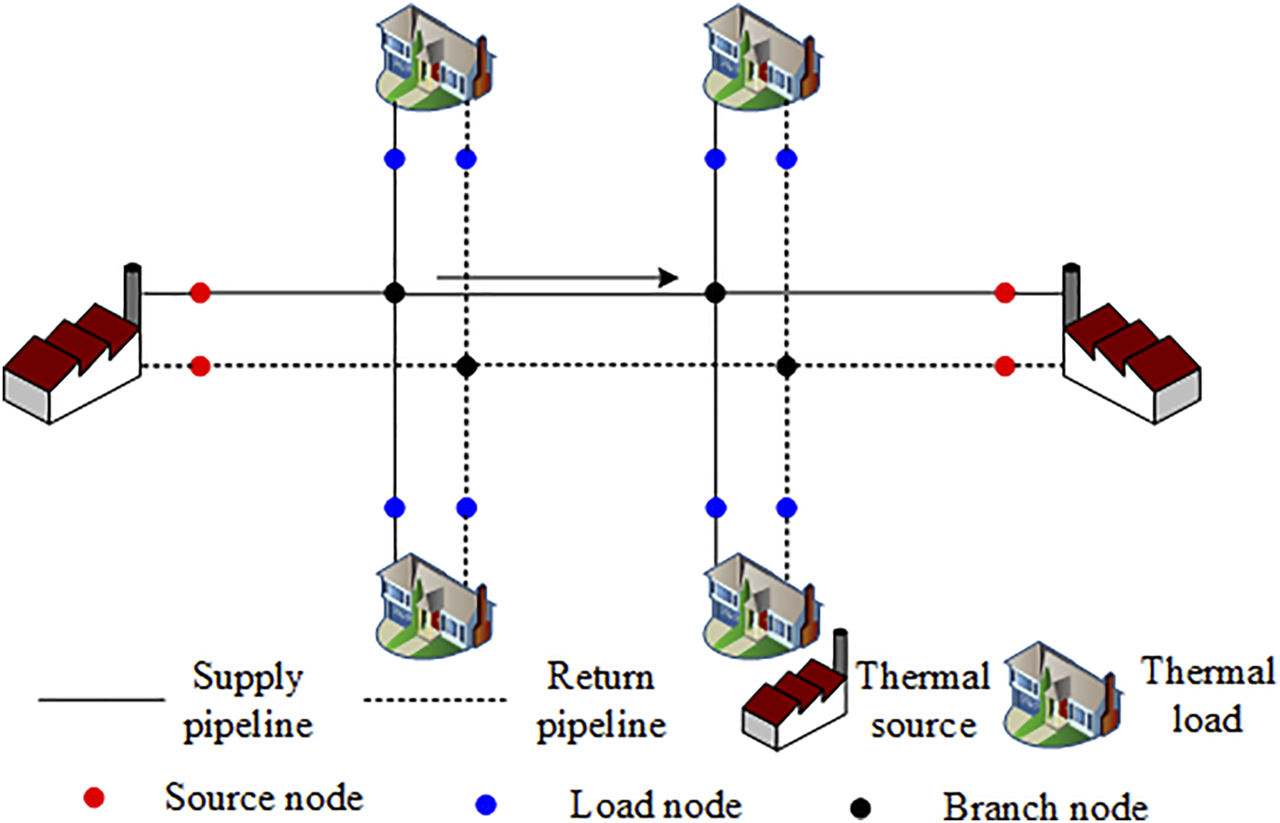
Structure of heating system.
For simplification, the temperature mentioned in this article is defined as the temperature mismatch between the absolute temperature and the ambient temperature, which is expressed as the following:where T′ denotes the absolute temperature, and Tamb denotes the ambient temperature. The thermal model describes the distribution of temperature and thermal power. First, the node in the HS is modeled as the heat exchanger.
In Eq. 5,ϕ denotes the thermal power consumption, which is positive at load nodes and negative at sources nodes; the superscripts nd denotes the variables at nodes, and C denotes the specific heat capacity of water; the superscripts s and r denote the variables in supply and return networks, respectively. Second, the node temperature after flow mixing is expressed as the following:
Eq. 6 is an equivalent representation of energy conservation at nodes, where the superscripts br denote the variables at pipeline; superscript e denotes the variables at the end of the pipeline, Inj denotes the set of pipelines that end at node j; Lvj denotes the set of pipelines leaves from node j. Third, the temperature at the beginning of pipeline equals to the temperature at the corresponding node, which is expressed as the following:
Next, finally, the pipe temperature conductivity equation describes the temperature distribution along the pipe. Here, we adopted the widely used node method to formulate the corresponding equation, and its procedure contains two steps: 1) model the time delay and 2) model the transfer loss.
Since the thermal power is transferred through water flow with a slow velocity, the adjustment at the pipeline inlet temperature takes a certain time delay to influence the pipeline outlet temperature. Thus, the node method discretizes the mass flow inside the pipeline into different micro elements, and each of the micro elements takes a different time delay to arrive the pipeline outlet, as shown in Figure 2 (Li et al., 2016).
FIGURE 2
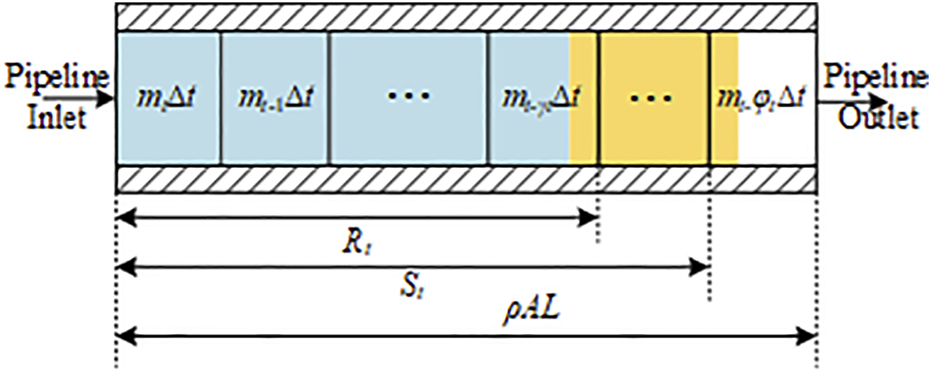
Flow schematic diagram of pipeline in heating system.
The elements in yellow denote the mass flow injecting into the pipeline at t. The element in blue denotes the mass flow injecting into the pipeline during a continuous time interval. The figure indicates that the mass flow injecting into pipeline at t leaves at t-γt. Next, correspondingly, the mass flow injecting into pipeline at t-1 leaves at t-φt. For arbitrary pipeline i, its time labels γi,t and φi,t can be obtained from (Li et al., 2016):where A is the cross-section area of the pipeline, ρ is the water density, ∆t is the time length, and L is the pipeline length. On this basis, the pipeline outlet temperature is formulated as the linear weighted sum of the temperature series at the pipeline inlet. Considering the time delay, the pipeline outlet temperature without transfer loss is formulated as the following:where Ri,t denotes the mass flow injecting into the pipeline i between t-γt and t; Si,t denotes the mass flow injecting into the pipeline i between t-φt+1 and t; and denote the pipeline outlet temperature in the supply and return network, respectively, at t without transfer loss. The expressions of Si,t and Ri,t are the following:
On this basis, the pipeline outlet temperature is further modified considering the transfer loss, which is expressed as the following:where and denote pipeline outlet temperature in the supply and return network, respectively; λ denotes the thermal transfer coefficient.
2.3 Energy Flow in Coupling Units
The PS and HS are usually coupled with the energy cogeneration and conversion equipment. In this article, the extraction CHP units and heat pumps are adopted for analysis. Next, the feasible region is used to describe the relationship between thermal power and electric power in CHP units and heat pumps. The feasible region of CHP units is constructed with several extreme points, whose mathematical formulation is expressed as (Zhang et al., 2021b):where PCHP and ϕCHP are the generated electric and thermal power of CHP units, and are the maximum electric and thermal power output of CHP units, and ηCHP,1 and ηCHP,2 are the coefficients in CHP units. The feasible region of heat pump is expressed as the following:where PHP and ϕHP are the consumed electric power and generated thermal power of heat pump; ηHP is the conversion coefficient of heat pump.
3 Equivalent Thermal Model
As shown in Section 2, the electric load and sources are directly connected through the energy flow in Eq. 1. Therefore, adjusting the source output according to the load distribution is comparatively easier. However, the thermal source and loads are connected through pipelines. The states at loads are obtained using the recursive computation based on Eqs. 6, 7, causing an implicit relationship between the thermal sources and loads. In this section, to formulate the direct expression between the temperatures at thermal sources and nodes, an ETM based on the node method is proposed, so that the model of HS can be aggregated like that of PS for further analysis.
Since the HS studied in this article operates at the constant-mass-flow control strategy, the mbr and mnd in Eqs. 5–16 are fixed. In this condition, Eqs. 8, 9 can be rewritten as the following:
Substituting Eq. 19 into Eqs. 12, 13, we can get the following:
Based on Eq. 12, Eqs. 10, 11 can be simplified as the following:
With
Eqs. 21,
22, the dynamic thermal conductivity equations are transformed into the linear equations that directly relates the pipe inlet temperature series and pipe outlet temperature. Then, we introduce the following incidence matrixes for simplification.
(1) The incidence matrix that relates the nodes and the corresponding pipelines leaving from the nodes is defined as A+. The dimension of A+ is Nd×Np, where Nd and Np denote the number of nodes and pipelines in HS. The element in A+ is expressed as the following:
(2) The incidence matrix that relates the nodes and the corresponding pipelines leaving from the nodes is defined as A−. The dimension of A− is Nd×Np. The element in A− is expressed as the following:
(3) The incidence matrix that relates the nodes temperature and the pipeline inlet temperature is defined as Atp. The dimension of Atp is Np×Nd. The element in Atp is expressed as the following:
It should be noted that the mentioned incidence matrixes A+, A−, and Atp are constant in HS with constant-mass-flow strategy. However, all these matrixes demonstrate different values in supply and return network. Thus, in this study, As,+ and Ar,+, As,− and Ar,−, and As,tp and Ar,tp are different constant matrixes.
With the incidence matrixes As,+ and Ar,+, the mass flow leaving from the nodes can be reformulated as Eq. 27 in matrix form.
The mass flow injecting into the nodes can be reformulated as Eq. 28 in matrix form.where diag in the above equations refers to the operation that transforms a vector into a diagonal matrix. Reformulating the temperature equation with Eqs. 27, 28, we can get the following:
Besides, Eqs. 21, 22 can be rewritten as the following:
Substituting Eqs. 30, 32 into Eq. 29, we can get the following:
Defining Hs1=Ds,−β1As,tp, Hs2=Ds,−β2As,tp, Hr1=Dr,−β1Ar,tp, Hr2=Dr,−β2Ar,tp, Eqs. 33, 35 can be expanded as the following:where the subscripts g, d, and l denote the source nodes, branch nodes, and load nodes in HS, respectively; , , and are the node temperature vectors at source, branch, and load nodes, respectively.
According to the topology of HS shown in Figure 1, the mass flow leaving from sources must equal to its injecting mass flow. Thus, in Eq. 35 must be 0. Besides, the mass flow cannot leave from the branch nodes and inject into the source nodes nor leave from the load nodes and inject into branch nodes through the pipelines. Therefore, and must be 0. Since the source nodes are equivalent loads and the load nodes are equivalent sources in the return network, , , and are also 0. On this basis, the latter two rows in Eq. 35 can be rewritten as the following:
Also, similarly, the former two rows in Eq. 36 can be rewritten as the following:
Eqs. 37–40 are the equivalent aggregation of the thermal model in HS, which combine the states at source nodes and the other nodes. As a result, the influence of adjustments at the sources on the other nodes can be directly reflected.
4 Security Region of Integrated Heat and Electricity System
In the IHES, the electric and thermal states are determined by the output of generators and coupling units. To ensure the operational security, the operators need to adjust the controllable states to restrict the controlled states within a feasible range. Defining x as the controllable states, y as the controlled states, f as the equality equations that determines the SRB, g as the inequality equations that determines the SRB, the SR of IHES is constructed below.
4.1 Model of Security Region
In the PS, the controllable states refer to the active power output of the generators, while the controlled states refer to the active power consumption of electric loads, the active power output of PVs, the active branch power flow, and the bus voltage phase angle (Chen et al., 2017). The SR in PS with DC power flow model is expressed as the following:
The equality equation fe contains Eqs. 1–3. The inequality equation ge contains the constraints on the active power output of generators and PVs, the active power flow on the branches, and the phase angles, as shown below.
In the HS, the controllable states refer to the thermal power output of the heat pumps and CHPs, while the controlled states refer to the node supply and return temperature. The SR in HS with ETM is expressed as the following:
The equality equation fh contains Eqs. 5, 37–40. The inequality equation gh contains three parts: 1) thermal comfort constraints of load supply temperature; 2) thermal security constraints of return temperature and source supply temperature; 3) thermal power constraints of source output; the ramping rate constraints of CHP units, which are shown in Eqs. 44–47, respectively.where and denote the minimum and maximum output of thermal source; and denote the minimum and maximum supply temperature at the load/branch/source nodes; Tr,nd,min and Tr,nd,max denote the minimum and maximum return temperature; δ denote the ramping rate of CHP units, which is 0.05 in this article. The SR for IHES is the intersection of the SRs of PS and HS with the constraints on the coupling units considered. The model of SR for IHES is expressed as the following:where fcp contains the equality constraints in Eq. 18, and gcp contains inequality constraints in Eq. 17.
4.2 Formulation of Security Region Boundary
The SRB corresponds to a set of critical operation points where one of the inequality constraints becomes equality constraints, while the other inequality constraints are satisfied. Since the constraints in (47) are linear, the SRB can be obtained by solving the upper and lower boundaries with linear programming. In this article, Matlab 2018b is used for programming, and Cplex 12.9 is used for problem solving.
5 Case Studies
To verify the effectiveness of the proposed method, a modified system is studied to investigate the SR of IHES. The IHES contains a modified IEEE 30-bus system and four independent HSs. Three PVs are integrated into the PS at buses 3, 9, and 10. The four HSs and PSs are coupled with 2 CHP units and 2 heat pumps. The four HSs demonstrate the same structure but different parameters. The diagram of the IHES is shown in Figure 3 and all the parameters are given in (Baidu, 1234). The curves of ambient temperature, PV output, the upper and lower boundaries of node temperature in HS are shown in Figure 4. The simulation contains two aspects: 1) verify the accuracy of the proposed ETM and 2) analyze the influence of thermal dynamics on SR of HS. Next, to verify the accuracy of ETM, the recursion-based node method (NM) in (Li et al., 2016) is used as reference in Section 5.1.
FIGURE 3
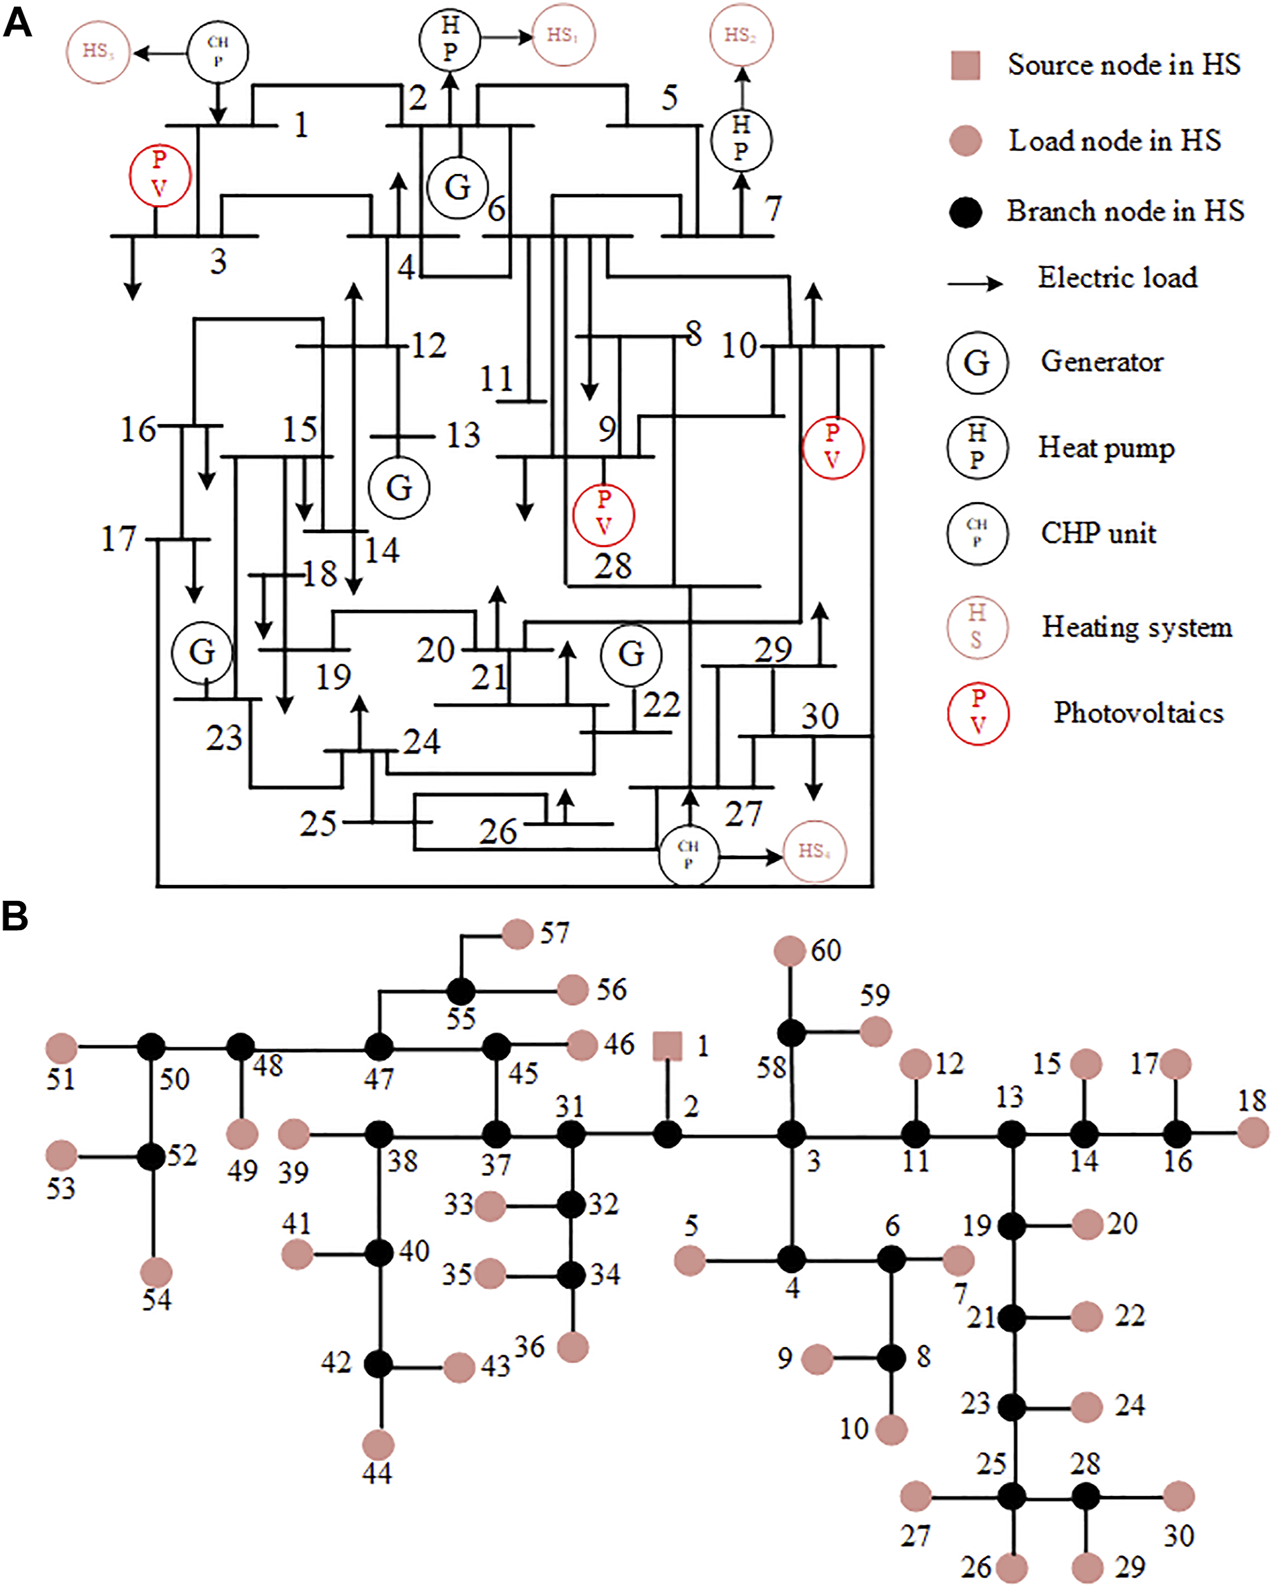
Structure of integrated heat and electricity systems in case study. (A) Structure of power system. (B) Structure of heating system.
FIGURE 4
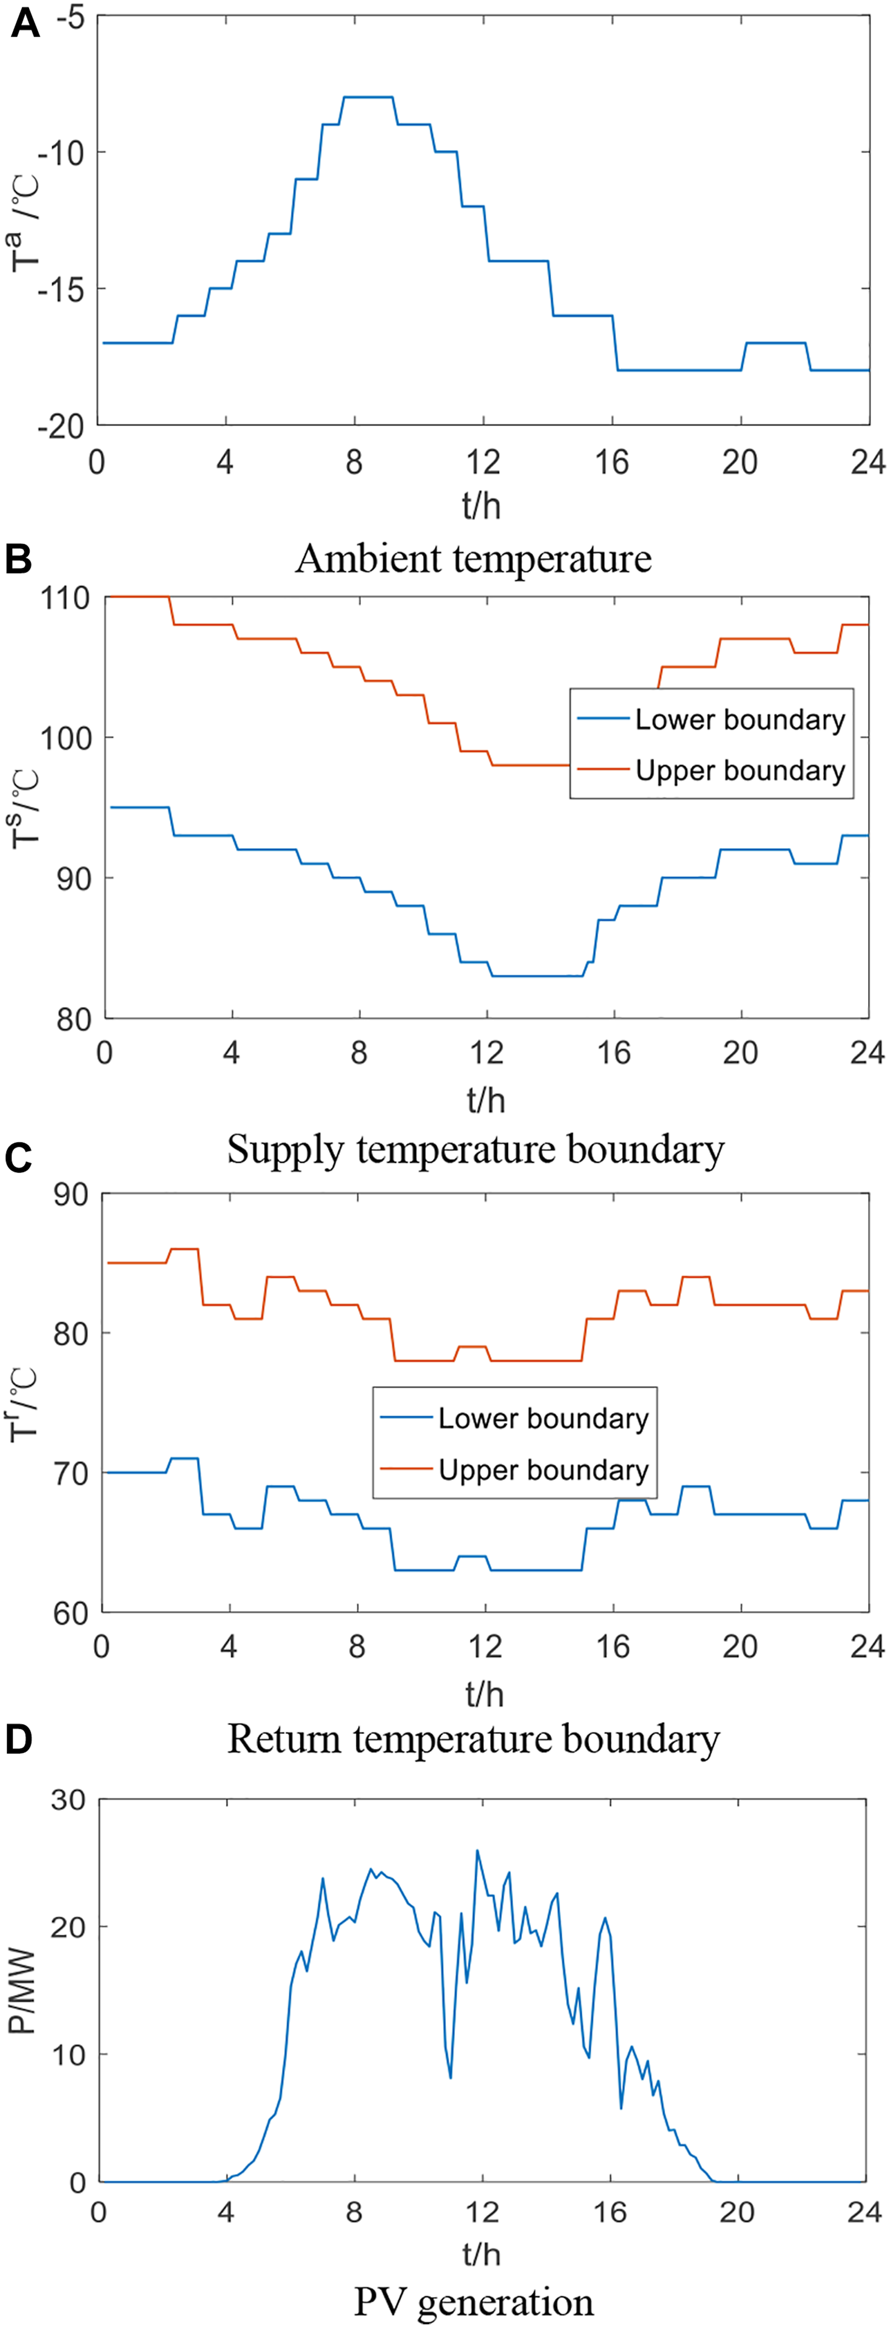
Parameters in heating system.
5.1 Accuracy of the Equivalent Thermal Model
In this section, the proposed ETM is compared with the recursion-based NM to verify the effectiveness. Two systems (HS1 and HS2) are simulated in two scenarios, including the following: scenario 1) ∆t = 10 min; scenarios and 2) ∆t = 5 min. The results are shown in Figure 5. As shown the figures, with the given boundary conditions, the results by ETM and NM are the same regardless of different simulation steps. This is understandable because the ETM is derived from NM without any simplification. However, to obtain the explicit expression of the load temperature, the ETM directly relates all the node temperature. As a consequence, the recursion is no longer needed during computation. The comparison regarding the computation time is given in Table 1, which further indicates the superiority of the ETM in efficiency.
FIGURE 5
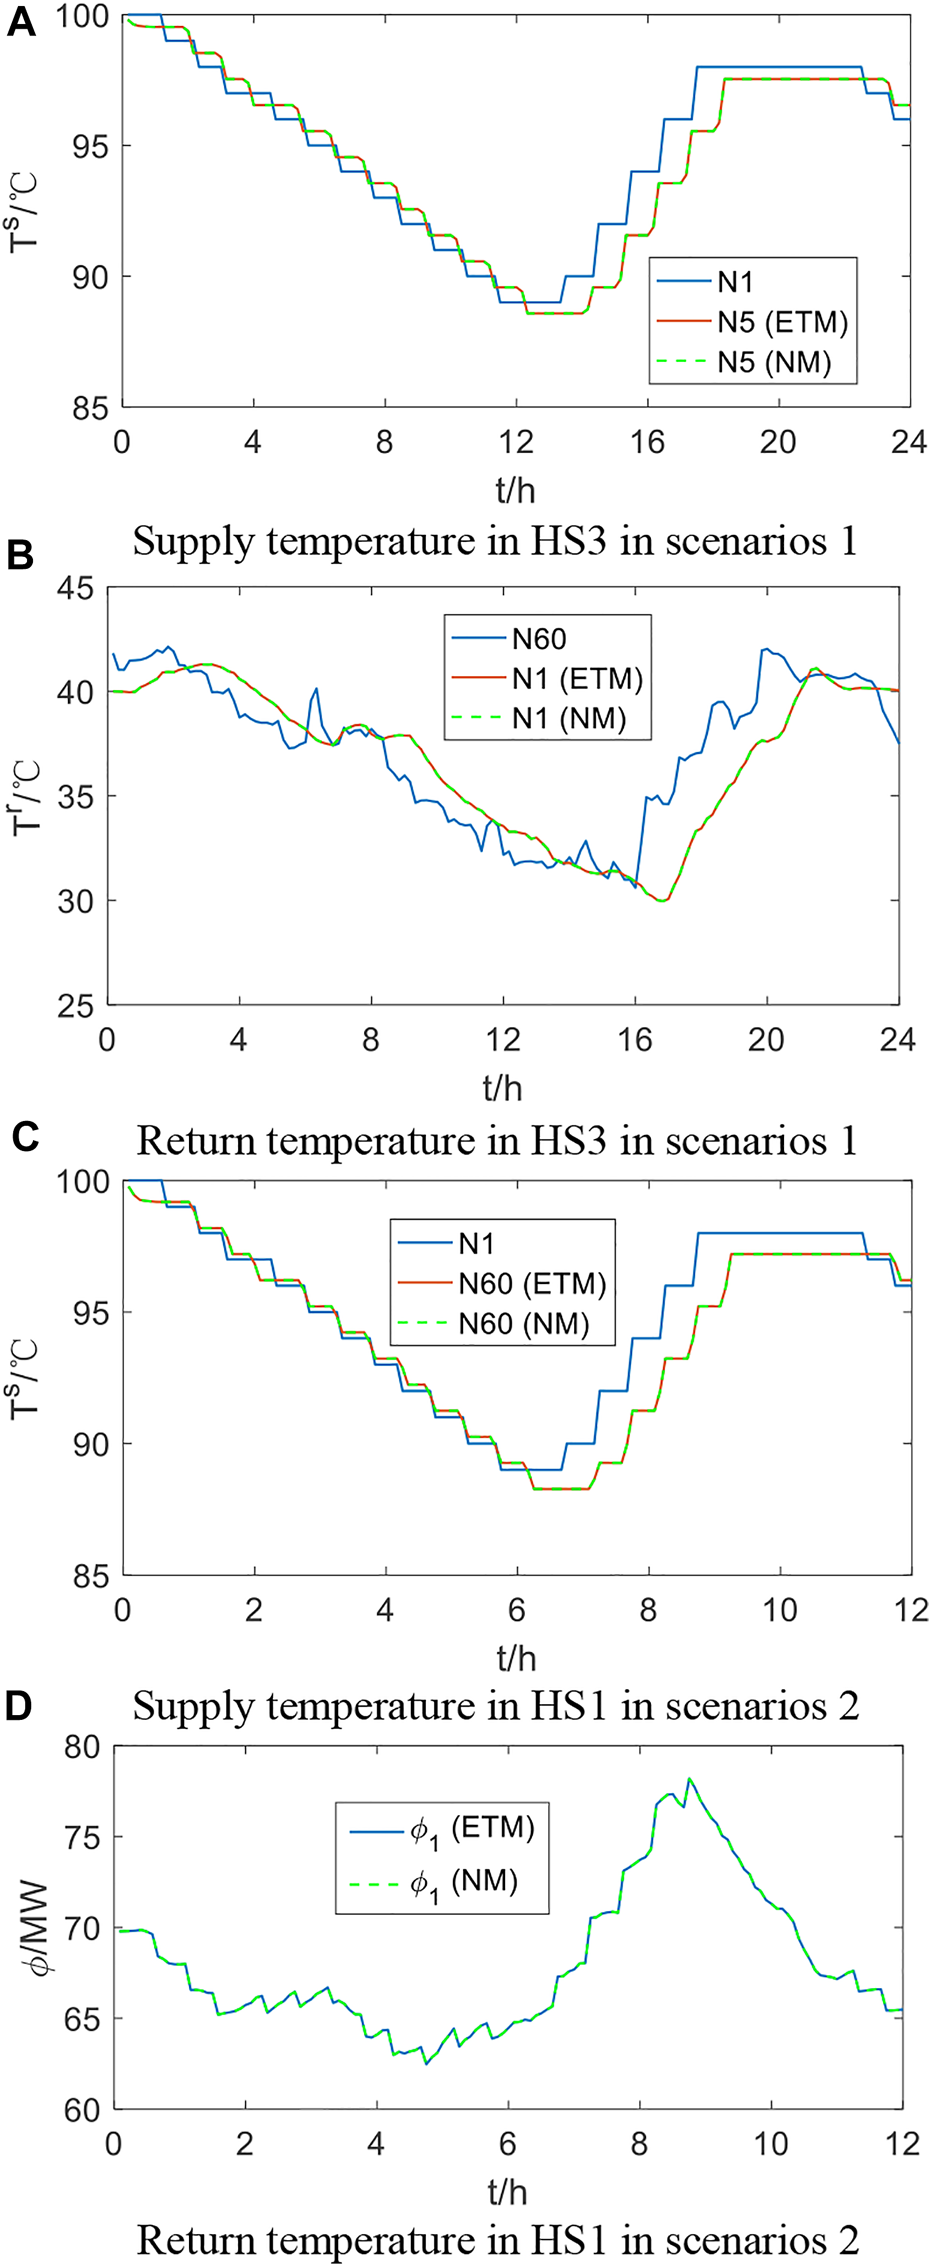
Simulation results in heating system.
TABLE 1
| Scenario | HS1-ETM (s) | HS1-NM (s) | HS3-ETM (s) | HS3-NM (s) |
|---|---|---|---|---|
| 1 | 0.0047 | 0.012 | 0.0049 | 0.010 |
| 2 | 0.0056 | 0.010 | 0.0054 | 0.0098 |
Computation time comparison.
5.2 Influence of Thermal Dynamics on Security Region of Power System
This section aims to verify the accuracy of the proposed SR model and analyze the influence of thermal dynamics on SR of PS. First, we compare the calculated SR with the hyperplane method proposed in (Li et al., 2020). The results are shown in Figure 6. As shown in the figures, the results by the proposed method and hyperplane method are almost the same. The area of SR for generator 1 and 2 and generator 1 and 13 by two methods is 2,149 MW2 and 1,189 MW2, respectively. This is understandable because the proposed method is completely linear. With the proposed method, no approximation or simplification occurs during the SR construction. Thus, the SR boundary governed by Eq. 47 is essentially a set of multivariate linear equations, which is the same with the traditional hyperplane method.
FIGURE 6
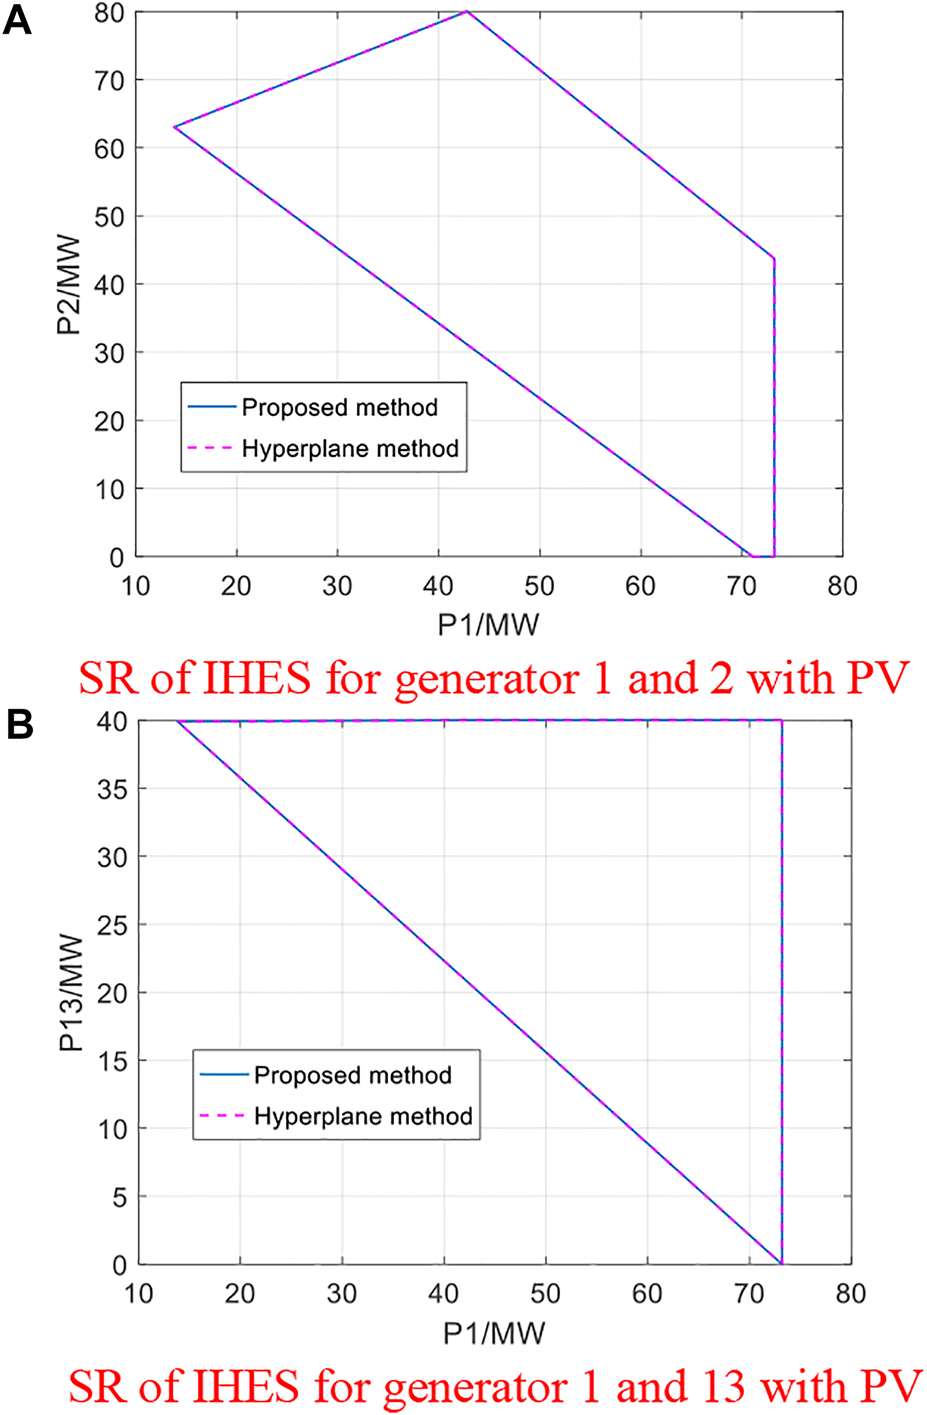
Security region comparison between the proposed method and hyperplane method.
Then, we performed the analysis to investigate the SR in IHES. The analysis contains two aspects: 1) analyze the influence of thermal dynamics, as shown in the comparison of Figures 7A–D; 2) analyze the influence of PV integration, as shown in the comparison of Figures 7C–F. From the figures, it is obvious that the combined operation shrinks the size of the SR in PS, since additional constraints from HS are added into the SR formulation. To ensure that the node temperature in HS satisfies the thermal comfort, the PS is required to increase the minimum active power generation and decrease the maximum active power generation. The size of SR in PS shrinks up to 15.6% in average. From Figures 7C–F, the observation exists that significant changes occur on the SR of IHES when the system is integrated with PV. The uncertain generation of PV is usually considered as an equivalent PQ bus with negative active power consumption. Next, the PV integration decreases the active power consumption in the whole system so that the generators can provide the active power in a wider range. As a consequence, the SR of IHES expands in both 2-dimensional and 3-dimensional space.
FIGURE 7
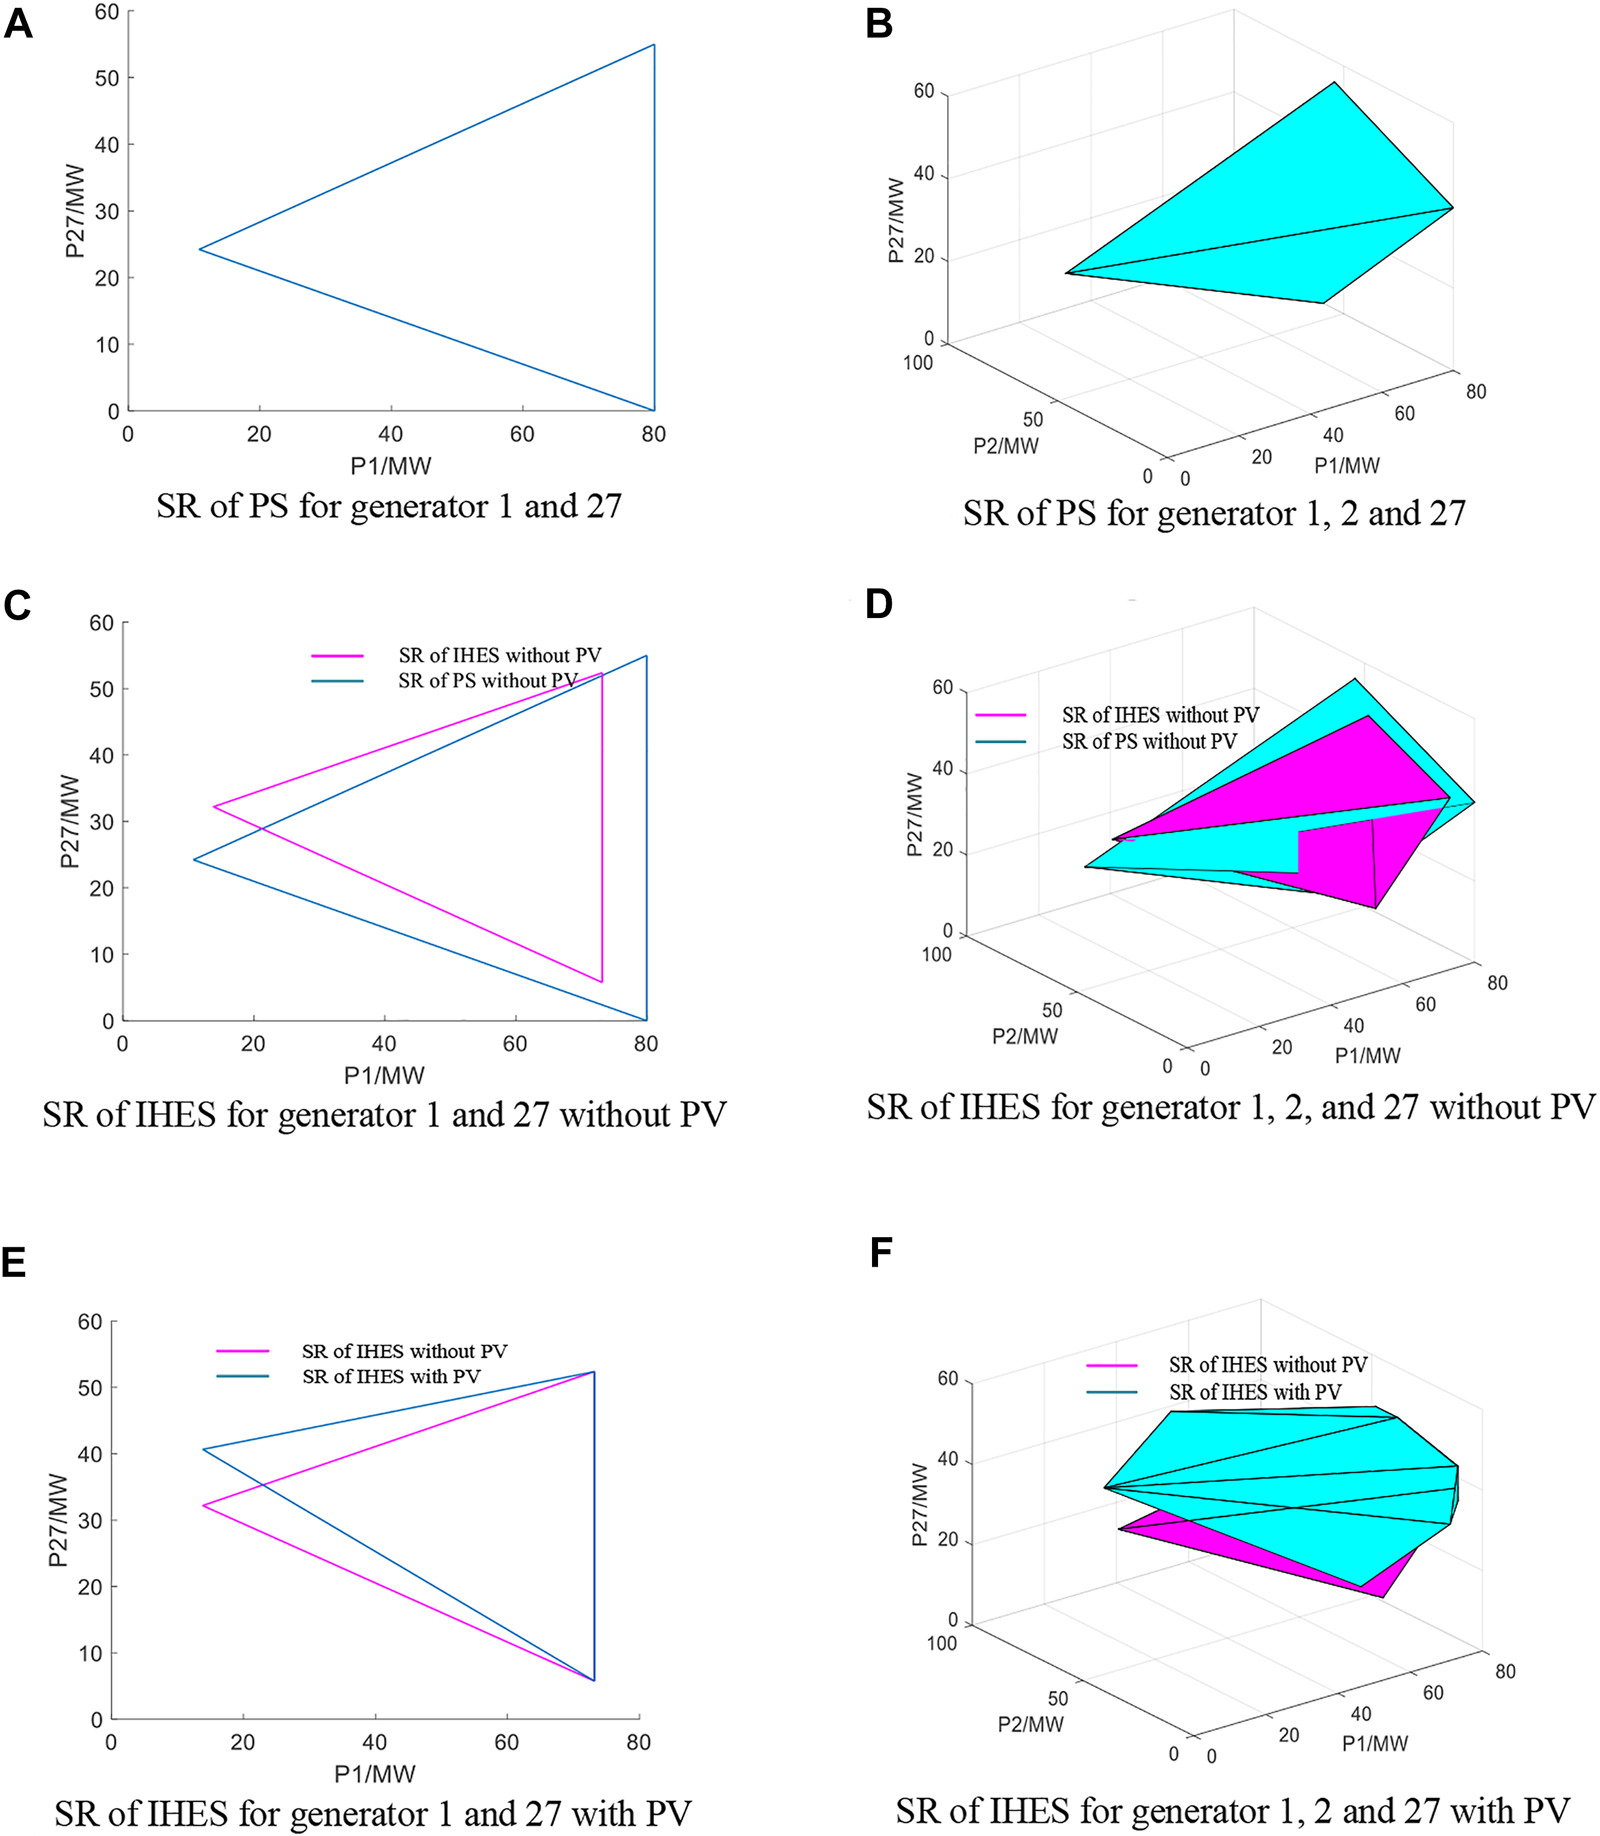
Security region in power system and integrated heat and electricity systems.
6 Conclusion
In order to explore the combined analysis of PS and HS integration, this study studies the operational security of the IHES based on SR. First, an ETM is proposed to build the direct relationship between the source states and load states in HS, with which the response to load fluctuation can be constructed at generators. On this basis, the SR of IHES, considering the thermal dynamics, is constructed, including the recognition of controlled/controllable variables and the formulation of the SRB. Next, finally, the influence of PV uncertainty on the SR of IHES is further analyzed. Case studies indicate that the proposed ETM is efficient for heating system analysis, and the combined operation of PS and HS will shrink the size of SR due to the additional constraints from HS side. Besides, the PV uncertainty demonstrates significant influence of the SR of IHES and is likely to increase the size of SR by providing extra generation capacity. The integration of large-scale heating systems and the dynamics from coupling equipment side will be the future research focus to explore the influence of the thermal dynamics on the PS.
Statements
Data availability statement
The original contributions presented in the study are included in the article/Supplementary Material, and further inquiries can be directed to the corresponding author.
Author contributions
Zhuhua Wang: Conceptualization, methodology and writing; Wencheng Huang: Paper revision; Xiaowei Cai: Response and proofreading.
Funding
This work was supported by Regional Development Project of Fujian Provincial Department of Science and Technology (Grant. 2021H4025).
Conflict of interest
The authors declare that the research was conducted in the absence of any commercial or financial relationships that could be construed as a potential conflict of interest.
Publisher’s note
All claims expressed in this article are solely those of the authors and do not necessarily represent those of their affiliated organizations, or those of the publisher, the editors, and the reviewers. Any product that may be evaluated in this article, or claim that may be made by its manufacturer, is not guaranteed or endorsed by the publisher.
Abbreviations
- IHES
Integrated heating and electricity system
- PS
Power system
- HS
Heating system
- ETM
Equivalent thermal model
- CHP
Combined heat and power
- PV
Photovoltaic
- SR
Security region
- DC
Direct current
- NM
Node method
Nomenclature
Abbreviations
- IHES
Integrated heating and electricity system
- PS
Power system
- HS
Heating system
- ETM
Equivalent thermal model
- CHP
Combined heat and power
- PV
Photovoltaic
- SR
Security region
- DC
Direct current
- NM
Node method
Indices
- L/V/G
Subscript of load/photovoltaic/generator in PS
- nd/br
Superscript of node/pipeline in HS
- s/r
Superscript of supply/return network
- b/e
Superscript of beginning/end of the pipeline
- Lv/In
Set of leaving/injecting pipelines
- e/h/cp
Subscript of variables in PS/HS/coupling units
- g/d/l
Subscript of source/branch/load node in HS
Parameters and Variables
- P
Active power
- θ
Voltage phase angle
- Pij
Active/reactive power at electric branch
- T’/T
Absolute/relative temperature
- Tamb
Ambient temperature
- m
Mass flow rate
- ϕ
Thermal power
- A/L/λ
Cross-section area/length of pipeline
- C/ρ
Specific heat capacity/density of water
- φ/γ
Time labels in node method
- Rt
Injected mass flow between t and t-γt
- St
Injected mass flow between t and t-φt+1
- Δt
Time interval
- K
Transfer coefficient in node method
- η
Coefficients in CHP and heat pump model
- β
Coefficients in ETM
- A+/−/tp
Topological incidence matrix in ETM
- D+/−
Mass flow matrix leaving from/injecting into nodes in ETM
- H+/−
Mass flow matrix leaving from/injecting into nodes in ETM
Coefficient matrixes in ETM
- x/y
Controllable/controlled state
- f/g
Equality/inequality equations in IEHS
- δ
Rampling rate of CHP unit
References
1
Baidu Case Data Online. Available at: https://pan.baidu.com/s/1BZJ-VoWz931gWRECKP9l3w (The secret is 1234.
2
Bitar E. Khargonekar P. P. Poolla K. (2011). Systems and Control Opportunities in the Integration of Renewable Energy into the Smart Grid. IFAC Proc. Vol.44, 4927–4932. 10.3182/20110828-6-it-1002.01244
3
Chen H. Shao J. Jiang T. Zhang R. Li X. Li G. (2020). Security Control Measures for Integrated Energy System Based on Sensitivity Analysis. Proc. CSEE15.
4
Chen S. Wei Z. Sun G. Wei W. Wang D. (2017). Convex Hull Based Robust Security Region for Electricity-Gas Integrated Energy Systems. IEEE Trans. Power Syst.34 (3), 1740–1748. 10.1109/TPWRS.2018.2888605
5
Chiang H.-D. Jiang C.-Y. (2018). Feasible Region of Optimal Power Flow: Characterization and Applications. IEEE Trans. Power Syst.33 (1), 236–244. 10.1109/tpwrs.2017.2692268
6
Cruz M. R. M. Fitiwi D. Z. Santos S. F. Catalão J. P. S. (2018). A Comprehensive Survey of Flexibility Options for Supporting the Low-Carbon Energy Future. Renew. Sustain. Energy Rev.97, 338–353. 10.1016/j.rser.2018.08.028
7
He C Wu L. Liu T. Bie Z. (2018). Robust Co-Optimization Planning of Interdependent Electricity and Natural Gas Systems with a Joint N-1 and Probabilistic Reliability Criterion. IEEE Trans. Power Syst.33 (2), 2140–2154. 10.1109/TPWRS.2017.2727859
8
Jahromi A. A. Bouffard F. (2017). On the Loadability Sets of Power Systems-Part I: Characterization. IEEE Trans. Power Syst.32 (1), 137–145. 10.1109/tpwrs.2016.2547945
9
Jiang X. S. Jing Z. X. Li Y. Z. Wu Q. H. Tang W. H. (2014). Modelling and Operation Optimization of an Integrated Energy Based Direct District Water-Heating System. Energy64, 375–388. 10.1016/j.energy.2013.10.067
10
Li X. Tian G. Shi Q. Jiang T. Li F. Jia H. (2020). Security Region of Natural Gas Network in Electricity-Gas Integrated Energy System. Int. J. Electr. Power & Energy Syst.117, 105601. 10.1016/j.ijepes.2019.105601
11
Li Z. Wu W. Shahidehpour M. Wang J. Zhang B. (2016). Combined Heat and Power Dispatch Considering Pipeline Energy Storage of District Heating Network. IEEE Trans. Sustain. Energy7 (1), 12–22. 10.1109/tste.2015.2467383
12
Li Z. Xu Y. (2019). Temporally-coordinated Optimal Operation of a Multi-Energy Microgrid Under Diverse Uncertainties. Appl. Energy240, 719–729. 10.1016/j.apenergy.2019.02.085
13
Liu C.-C. (1986). A New Method for the Construction of Maximal Steady-State Security Regions of Power Systems. IEEE Trans. Power Syst.1 (4), 19–26. 10.1109/tpwrs.1986.4335009
14
Liu L. Wang D. Hou K. Jia H. Li S. (2020). Region Model and Application of Regional Integrated Energy System Security Analysis. Appl. Energy280, 115072. 10.1016/j.apenergy.2019.114268
15
Ma H. Wang B. Gao W. Liu D. Sun Y. Liu Z. (2018). Optimal Scheduling of a Regional Integrated Energy System with Energy Storage Systems for Service Regulation. Energies11, 195. 10.3390/en11010195
16
Mancarella P. (2014). MES (Multi-energy Systems): An Overview of Concepts and Evaluation Models. Energy65, 1–17. 10.1016/j.energy.2013.10.041
17
Nan L. Wu L. Liu T. Liu Y. He C. (2020). Vulnerability Identification and Evaluation of Interdependent Natural Gas-Electricity Systems. IEEE Trans. Smart Grid11 (4), 3558–3569. 10.1109/tsg.2020.2968178
18
Sanjari M. J. Karami H. Gooi H. B. (2016). Micro-generation Dispatch in a Smart Residential Multi-Carrier Energy System Considering Demand Forecast Error. Energy Convers. Manag.120, 90–99. 10.1016/j.enconman.2016.04.092
19
Sina (2009). Electric and Thermal Power Failure in Harbin. Available at: http://news.sina.com.cn/o/2009-11-15/060816609684s.shtml
20
Wei W. Liu F. Mei S. (2015). Dispatchable Region of the Variable Wind Generation. IEEE Trans. Power Syst.30 (5), 2755–2765. 10.1109/tpwrs.2014.2365555
21
Wei X. Zhao J. Huang T. Bompard E. (2018). A Novel Cascading Faults Graph Based Transmission Network Vulnerability Assessment Method. IEEE Trans. Power Syst.33 (3), 2995–3000. 10.1109/tpwrs.2017.2759782
22
Xiao J. Guo W. Wang C. Li F. (2012). Distribution System Security Region: Definition, Model and Security Assessment. IET Gene. Trans. Dis.6 (12), 1029–1035. 10.1049/iet-gtd.2011.0767
23
Xiao J. Zu G. Gong X. Li F. (2017). Observation of Security Region Boundary for Smart Distribution Grid. IEEE Trans. Smart Grid8 (4), 1731–1738. 10.1109/tsg.2015.2505325
24
Yan J. He H. Sun Y. (2014). Integrated Security Analysis on Cascading Failure in Complex Networks. IEEE Trans.Inform.Forensic Secur.9 (3), 451–463. 10.1109/tifs.2014.2299404
25
Zhang S. Gu W. Lu S. Yao S. Zhou S. Chen X. (2021). Dynamic Security Control in Heat and Electricity Integrated Energy System with an Equivalent Heating Network Model. IEEE Trans. Smart Grid12 (6), 4788–4798. 10.1109/TSG.2021.3102057
26
Zhang S. Gu W. Yao S. Lu S. Zhou S. Wu Z. (2021). Partitional Decoupling Method for Fast Calculation of Energy Flow in a Large-Scale Heat and Electricity Integrated Energy System. IEEE Trans. Sustain. Energy12 (1), 501–513. 10.1109/tste.2020.3008189
Summary
Keywords
integrated heat and electricity system, security region, thermal dynamics, equivalent thermal model, security region boundary (SRB)
Citation
Wang Z, Huang W and Cai X (2022) Security Region of Integrated Heat and Electricity System Considering Thermal Dynamics. Front. Energy Res. 10:945231. doi: 10.3389/fenrg.2022.945231
Received
16 May 2022
Accepted
20 June 2022
Published
04 August 2022
Volume
10 - 2022
Edited by
Wei Hu, Zhejiang University, China
Reviewed by
Solomon Giwa, Olabisi Onabanjo University, Nigeria
Angel Barragan Cervera, University of Jaume I, Spain
Updates
Copyright
© 2022 Wang, Huang and Cai.
This is an open-access article distributed under the terms of the Creative Commons Attribution License (CC BY). The use, distribution or reproduction in other forums is permitted, provided the original author(s) and the copyright owner(s) are credited and that the original publication in this journal is cited, in accordance with accepted academic practice. No use, distribution or reproduction is permitted which does not comply with these terms.
*Correspondence: Zhuhua Wang, 81988003@lyun.edu.cn
This article was submitted to Smart Grids, a section of the journal Frontiers in Energy Research
Disclaimer
All claims expressed in this article are solely those of the authors and do not necessarily represent those of their affiliated organizations, or those of the publisher, the editors and the reviewers. Any product that may be evaluated in this article or claim that may be made by its manufacturer is not guaranteed or endorsed by the publisher.