 Adriana Carillo
 Giovanna Pisacane
 Maria Vittoria Struglia
- Climate Modeling Laboratory, Division Model and Technologies for Risk Reduction, Department for Sustainability, ENEA, Rome, Italy
Ocean Energy is now emerging as a viable long-term form of renewable energy, which might contribute around 10% of EU power demand by 2050, if sufficient support is guaranteed along its road to full commercialization, allowing to further demonstrate the reliability, robustness and overall economic competitiveness of technologies. Although wave energy is still less developed than other marine renewables, its high density, great potential and minimal environmental impact have renewed the interest of developers, investors and governments globally, also in view of the increasing awareness of climate change and of the necessity to reduce carbon emissions. In parallel with technological development, the reliable characterization of wave climate and of the associated energy resource is crucial to the design of efficient Wave Energy Converters and to an effective site-technology matching, especially in low-energy seas. The preliminary scrutiny of suitable technologies and the identification of promising sites for their deployment often rely on wave climatological atlases, yet a more detailed characterization of the local resource is needed to account for high-frequency spatial and temporal variability that significantly impact power generation and the economic viability of WEC farms. We present a high-resolution assessment of the wave energy resource at specific locations in the Mediterranean Sea, based on a 7-years dataset derived from the operative wave forecast system that has been developed at ENEA and has been running since 2013. The selected areas correspond to the target regions of the Blue Deal project, where energy resource estimates were combined with technical and environmental considerations, so as to identify optimal sites for Blue Energy exploitation, from a Maritime Spatial Planning perspective. The available resource at selected sites is analysed together with site theoretical productivity for three state-of-the art WECs, showing interesting potential for future deployment.
1 Introduction
Except for the years of the pandemic, global energy demand has been steadily increasing in the last decades, still mainly relying on fossil fuels, which are currently responsible for around three-quarters of the global greenhouse gas emissions, while renewables appear to only meet around half the increase through 2022 (IEA 2021a). On the other hand, the political consensus has been growing on the necessity to reduce global carbon dioxide emissions to net zero by 2050, consistently with the Paris Agreement resolution to limit the long-term increase in average global temperatures below 2°C, and to pursue efforts to limit it to 1.5°C. Nevertheless, although pledges to achieve such goal have been made by countries that are responsible for around 70% of global emissions, such commitments are not yet accompanied by the necessary near-term policies and measures, and fail to envisage a radical and effective transformation of how we produce, transport and consume energy (IEA 2021b). As a matter of fact, production from renewable sources is indeed projected to meet most of the increase in global electricity demand in the near future (up to 2024), yet such positive trend would only result in a plateauing of emissions (IEA 2022).
In June 2021, the EU adopted a European Climate Law, establishing the aim of reaching net zero greenhouse gas emissions in the EU by 2050, thus committing itself to achieve the goal set out in the European Green Deal (EU Commission, 2019) for Europe’s economy and society to become climate-neutral to that date. Intermediate targets are set, namely that of reducing net greenhouse gas emissions by at least 55% by 2030, compared to 1990 levels (EU Regulation, 2021). In this context, the Renewables Directive 2018/2001/EU (EU Directive, 2018) established a binding renewable energy target for the EU of at least 32% of renewable energy sources in the overall energy mix, to be reached by 2030. Such limit is currently being revised to at least 40% by 2030, which means doubling the current renewables share in just a decade, with the aim to also boost an economic sector with remarkable potential to create jobs, growth and trade (EU Proposal, 2021). In November 2020, the EU issued its Strategy to harness the potential of offshore renewable energy (EU Commission, 2020), recognizing the maturity that offshore wind technologies have reached since the first installation of an offshore wind farm off the southern coast of Denmark in 1991, as well as the ongoing rapid development of a range of promising energy converters, such as wave or tidal, floating photovoltaic installations and the use of algae to produce biofuels. The European Commission has committed to support the value chain of this now fully emerged sector, supporting the creation of industrial opportunities and green jobs across the continent, as the marine renewables industry is required to scale up 5 times by 2030 and 25 times by 2050 to support the Green Deal’s objectives, at the same time meeting its environmental constraints.
Among marine renewables, ocean waves are recognized as one of the most promising sources of clean, reliable, and renewable energy, with an estimated potential that is theoretically equivalent to more than double the world’s current electricity demand (IRENA 2020). Nevertheless, the full exploitation of Wave Energy Converters (WECs) is still hindered by deficiencies in wave resource assessments, often overlooking relevant non-linear processes that affect the reliability of theoretical estimates (Hong et al., 2021; Tran et al., 2021), as well as by the need to better characterize their performance in complex multi-device configurations and to develop efficient control systems (Gallutia et al., 2022). In general, WECs have yet to reach the level of commercial viability that would guarantee their competitiveness with alternative energy sources, especially in the absence of synergetic technologies with the potential for hybridization and/or co-location (Foteinis and Tsoutsos, 2017; Clemente et al., 2021; Petracca et al., 2022). Moreover, despite the considerable efforts in research and development, technological convergence (i.e., a shift towards a common “optimal” design on which to concentrate future research) is yet to be achieved (Hannon et al., 2017; Guo and Ringwood, 2021). One of the reasons for such diversity of WEC concepts is the significant temporal variability of wave energy, ranging from seconds to decades, and making it difficult to focus on a limited range of sea states for WEC optimization, in terms of PTO (Power Take Off), control, survivability, and power prediction and management (Guo and Ringwood, 2021). The current variety of technological options has in fact contributed to delaying the operative exploitation of WECs, through the resulting (i) lack of an adaptable taxonomy that is both analytical and capable of accommodating future technologies, (ii) absence of an agreed coherent and flexible cross-scale method to select optimal locations, from the initial large scale studies for generic feasibility assessments to the effective identification and quantification of costs and trade-offs across the installation, operativity and dismissal phases of a WEC farm, and (iii) difficulty to define a systematic site-technology matching procedure that allows the identification of the best devices to be deployed in a specific location (Bertram et al., 2020).
It should be underlined that filling each such gap represents a step towards the realistic implementation of wave energy farms, and should be considered to all effects as part of the value chain, from the initial concept all the way through its delivery to the market, and to the constant upgrade of technological solutions. In particular, alongside the development of device-scaling roadmaps and energy-maximizing control systems, enhancing optimal site-technology matching would considerably help shifting the paradigm for wave energy exploitation from the current focus on higher density areas (>25 kW/m) to the due consideration of the so far undervalued milder environments (Lavidas and Blok, 2021).
Despite its mild climate, the Mediterranean Sea in fact offers substantial opportunities for wave energy production, provided the technologies are effectively downscaled to meet the local comparatively low-energy wave conditions (Dialyna and Tsoutsos, 2021). The latter also allow the affordable testing of scale devices designed for harsher environments, and stimulate solutions to increase device efficiency for optimal energy harvesting. (Pisacane et al., 2018). The accentuated vulnerability of the Mediterranean environment indeed demands that the effort be undertaken to pursue the transition towards higher shares of renewable energy, by implementing multi-purpose solutions that simultaneously address greenhouse-gas-emission reduction and climate adaptation. Here, marine energy solutions can in fact prove effective to both generate utility scale grid electricity and increase the value of climate-adaptive infrastructures, such as breakwaters, where WECs can be incorporated with the advantage of combining a limited increase in construction costs with ease of maintenance and coastal protection (Silva et al., 2018; Vicinanza et al., 2019). Besides its cost-effectiveness and low environmental impact, the combination of WECs with other technologies and across different economic sectors would also allow to reduce anthropic pressures on a heavily exploited marine space, for example, through the implementation of multi-functional offshore farms (Wan et al., 2016; Leira, 2017; Foteinis, 2022) that harmonize the needs of the tourism industry and of maritime transport, the exploitation of fisheries and aquaculture (Menicou and Vassiliou, 2010), and the emerging opportunities offered by marine renewables.
This work has been carried out within the Blue Deal Project (https://blue-deal.interreg-med.eu), which addressed many of the highlighted criticalities of WEC deployment in the environmentally sensitive Mediterranean region, by connecting experts from the different fields of engineering and environmental sciences, administrative bodies and citizen organizations, with the aim to both design viable pathways for marine energy exploitation and increase social awareness as to the opportunities offered by the sector. Specifically, the project designed a methodology to coherently address site-technology matching through (i) technology classification and assessment and (ii) preliminary site selection based on energy resource availability, also accounting for the issues posed by environmental protection and by the necessary governance of inter-sectorial competition (Pulselli et al., 2022). Together with the ongoing developmental assessment of devices, these constitute the complementary building blocks of the successful evaluation, selection and implementation of WEC systems, as schematically represented in Figure 1.
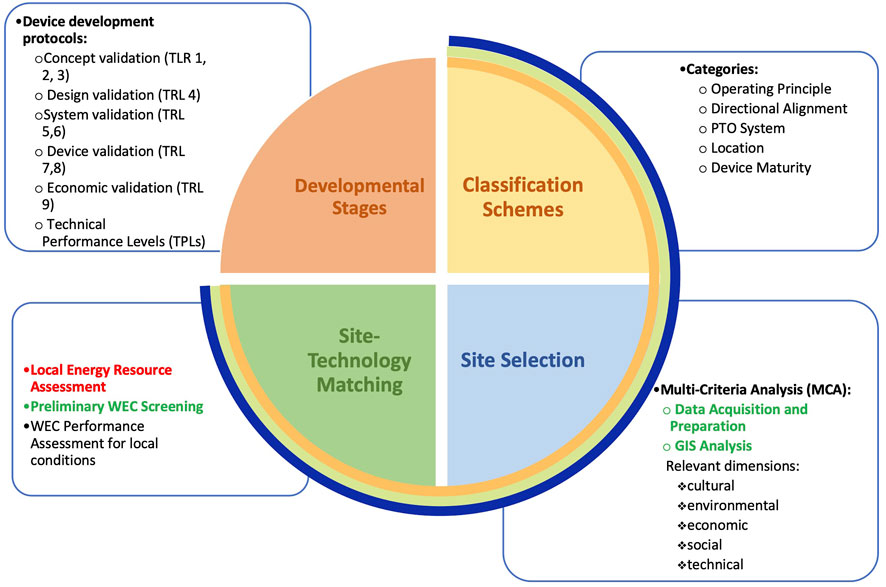
FIGURE 1. Schematic representation of the recommended systematic approach to the deployment of WECs in marine areas. Developmental stages are defined according to functional readiness, as established by the International Structured Development Plan of the International Energy Agency–Ocean Energy Systems (IEA–OES) group (Holmes and Nielsen, 2010). The complementary Technical Performance Levels (TPLs - Weber, 2012) are included in the list, despite their limited applicability, due to the difficulty of generally assessing supplementary cost drivers which are better evaluated in the context of site-specific implementation and are, in fact, usually covered within the site selection and site-technology matching components (e.g., environmental, social and legal acceptability, efficiency, survivability, capital expenditure and lifecycle operational costs). An alternative classification of WEC TRLs can be found in Fitzgerald and Bolund (2012), who also recommend accounting for lifecycle readiness. Classification schemes are based on the categories defined by Lehmann et al. (2017). The three bands in the Blue Deal logo colours encompass the components that have been addressed during the project lifetime, following the indications of the Blue Deal Methodology (Pulselli et al., 2022). The local resource assessment activities that are the object of this paper fall into the site-technology matching component, and are highlighted in red. They rely on results obtained in parallel project tasks (in green). Preliminary WEC screening made in its turn use of the device classification that was carried out during the project, allowing to narrow the number of promising technologies to those that can be effectively deployed in the Mediterranean environment.
In Pulselli et al. (2022), the preliminary selection of the promising sites has mainly relied on monthly wave climatology maps, which were then confronted with the specific requirements of different technologies suitable for the Mediterranean conditions, and overlapped with the spatial distribution of protected areas and critical ecosystems (e.g., Posidonia Oceanica meadows), as well as of the areas reserved for marine traffic. Historical hindcast data are often used to quantify the wave energy resource. Nevertheless, while offering longer time coverage with respect to observations, they are often affected by biases in the estimation of climatological means, and fail to capture the high natural inter-annual variability that characterizes wave climate, as well as climate-change induced variations, due to both insufficient resolution and to the inadequate representation of relevant processes (Mackay et al., 2010a; Mackay et al., 2010b). However, for the Mediterranean Sea, sufficiently long reanalysis hourly time series of wave parameters are now available at a spatial resolution of 1/24° (Korres et al., 2021), which would further allow to characterize wave statistics, so as to better evaluate the projected omnidirectional wave power (Pw) and the expected productivity of a farm, via the performance metrics generally used to compare and rank the prospective operative devices (e.g., average power output, PE, Capture Width Ratio, CWR, and capacity factor, Cf), ultimately allowing the assessment of their economic performance via the Levelised Cost of Energy (LCoE) (Astariz and Iglesias, 2015). Yet historical data, are not sufficient to support the operativity of offshore devices that need real-time calibration, such as the ISWEC (Inertial Sea Wave Energy Converter), a WEC developed at the Politecnico di Torino (Italy), which underwent full-scale testing offshore Pantelleria Island (Sicily, Italy) (Cagninei et al., 2015). Indeed, the conversion from wave energy to electricity can be affected by variations in the wave spectrum at the sub-daily to daily scales, affecting the efficiency of the power management system, which necessitates accurate high-resolution sea-state predictions up to a few days ahead (Widén et al., 2015). Wave forecasts are in fact crucial across all stages of WEC development, from the design and planning of the wave farm, to its commissioning, operation, maintenance and decommissioning (Mérigaud et al., 2017), and should be considered a permanent element of the industrial process. In addition, by being forced by atmospheric forecasts starting from a data-constrained initial condition, on the long run short-term operative wave forecasts also constitute an ever-expanding dataset, capable of capturing the long-term trends of wave climate that impact WEC optimization and commercial development (Atan et al., 2016; Ulazia et al., 2020). Similarly to historical hindcasts and reanalyses, long time series of operative forecasts can in fact allow the back-testing of climate variability and near-future extrapolations, yet with the competitive advantages of early availability and higher-resolution atmospheric forcing [for example, the Korres et al. (2021) reanalysis is forced by 0.25° horizontal-resolution ERA5 data, while ECMWF atmospheric forecasts are released at 0.1°]. On the other hand, mid- to long-term future variations in wave fields characteristics under climate change should be ideally projected via future climate scenario simulations (Reeve et al., 2011), which, however, still retain too large uncertainties from a variety of sources (Wolf et al., 2020) and entail high computational costs, as multiple realizations are needed to adequately sample the phase space of the climate system (Morim et al., 2019). Nevertheless, although this surely represents a critical issue for the sustainability of the energetic transition towards greater shares of marine renewables (Harrison and Wallace, 2005), its treatment is beyond the scope of this work, which only focuses on the present opportunities for WEC deployment in the Mediterranean Sea.
The wave forecast system developed at ENEA has been operatively running since 2014, and it has been extensively employed to provide the ISWEC developers with the necessary forecast for the device calibration (Mattiazzo, 2019). It is used here as a source of wave data over the period 2014–2020, to illustrate the added value of high spatial (1/32°) and time (hourly) resolution for the purpose of site-technology matching. To this end, detailed wave-energy spectra were constructed at selected locations, providing valuable information on the available resource and, after combination with illustrative device power matrices, allow the preliminary assessment of potential site productivity.
Following the description of the data and methods used (Section 2), the results obtained for test sites in Malta, Crete and Cyprus are presented in Section 3, covering mean wave climate indicators, wave roses, and wave spectra. Section 4 summarizes the integral parameters that characterize wave energy availability at the test sites, as well as standard productivity indices for three state-of-the-art wave converters, allowing direct island inter-comparison; a preliminary analysis of the impact of seasonality on the wave energy resource is also presented. In Section 5, conclusions are drawn and future perspectives outlined.
2 Materials and methods
The presented results generally cover the two bottom sectors of Figure 1, from the preliminary large-scale characterization of the test case area, based on the climatological average of local wave height and period, to the interaction with local authorities aimed at narrowing site selection, to the joint analysis of wave parameters at specific sites and WEC requirements.
The reference framework for the analysis is the ongoing normative process for the wave energy sector synthesized in the International Electrotechnical Commission (IEC) Technical Specifications (TS) for marine energy, namely part IEC-62600-101, that has been specifically dedicated to the wave energy resource across three classes of assessment: reconnaissance (Class 1), feasibility (Class 2), and design (Class 3) (IEC 2015). IEC-62600-101 has been verified to constitute a robust and coherent methodology, providing a set of recommendations and rules that allow accurate wave resource characterization (Ramos and Ringwood, 2016). Nevertheless, the minimum requirements needed for the validation of classes 2 and 3 might prove excessively demanding and, therefore, could be subject to future change (Ramos and Ringwood 2016). The present study mainly focuses on Class 1 assessments for the deployment of offshore wave energy, by exploiting 7 years of projections from the operative wave forecast system for the Mediterranean Sea developed at ENEA (MED-ENEA - https://giotto.casaccia.enea.it/waves/), which has been continuously running since June 2013. The system is based on the WAM model, a third-generation wave model that numerically integrates the basic transport equation for the evolution of a 2D ocean wave spectrum, without resorting to any specific assumption as to the spectral shape (WAMDI-group, 1988). The Cycle 4.5.3 configuration (C4.5.3) was implemented, which improved that of WAM cycle 4 (Günther et al., 1992), by including a new semi-implicit integration scheme for the source function (Herbach and Janssen, 1996), the revised wave dissipation presented in (Bidlot et al., 2007), the wind generation function and dissipation terms described in (Janssen, 1982; Janssen, 1989; Janssen, 1991), and the evaluation of nonlinear interaction source functions through a discrete interaction approximation (Janssen, 2008). The detailed characteristics of WAM C4.5.3 are summarized in Günther and Behrens (2011), who also conducted a thorough validation exercise.
The model configuration meets almost all the TS101 requirements as to the physical processes that need to be explicitly accounted for in Class 1 assessments1, while it also includes wave breaking and bottom friction (only recommended for Class 2 and 3), and it is even more stringent as to numerical specifications. However, the two neglected components, namely diffraction and wave-current interaction, appear to be especially important near-shore and in shallow waters, or when the interaction between the waves and the devices (possibly aligned in large farms) is to be modelled (Folley, 2017), and they are not critical for the present analysis. Indeed, in such cases the spatial scale of the assessment would need to be much more refined, of the order of tens, or at least hundreds, of meters, and the choice of devices to have already been restricted to a limited number of specific candidates. On the other hand, the temporal, directional and spectral characterization offered by MED-ENEA data is expected to be appropriate for offshore application (Folley, 2017). With respect to low- or intermediate-resolution climatologies based on historical data, the use of high-resolution operative forecasts offers an improved spatial and temporal characterization of wave fields for the preliminary screening of promising sites, and allows the real-time calibration and operability optimization of devices that are being tested at sea, providing effective support for the assessment of their productivity and, ultimately, of their economic sustainability.
The MED-ENEA operative system covers the whole Mediterranean Sea at a spatial resolution of 1/32° (approximately 3.5 km). Starting every day at 00 h from the +24 h sea state forecast from the previous run, hourly time series of wave parameters are predicted for the following 5 days. The system is forced with the wind fields predicted by the atmospheric circulation model SKIRON over the forecast time interval [00 h ÷ 00 h + 120 h], at a resolution of 0.05° × 0.05°, i.e. close to that of the wave model and considerably higher than that of standard reanalyses. SKIRON has been developed by the Atmospheric Modelling and Weather Forecasting Group of the National University of Athens, where it has been operatively running for over 20 years (Kallos, 1997; Papadopoulos et al., 2001).
Over its operating life, MED_ENEA has been validated against in situ-measurements (buoy data), satellite data and reanalyses products, with good results (Carillo et al., 2015a; Carillo et al., 2015b; Memè et al., 2020). The dataset used for this study is constituted by the +24 h forecast from each 5-days simulation, and covers the period 2014–2020. It includes significant wave height,
3 Results
Basin-wide, climatological wave energy resource maps have been presented in Pulselli et al. (2022), who also describe the overall methodology of the Blue Deal systematic approach to marine energy exploitation in the Mediterranean. Here we will focus on the high-resolution results at locations where the feasibility of WEC deployment has emerged, for which the stakeholders manifested interest in exploring realistic viability during the Blue Deal Labs. These are Malta, Crete and Cyprus, which are all located in the least sheltered area of the Mediterranean Sea and are therefore exposed to both the waves generated by the local prevailing winds and to the longer period swell generated by distant weather systems. The following analyses will make use of the minimum Hs threshold for devices to efficiently operate (0.5 m), as indicated by the preliminary device screening exercise. The specific candidate sites have been identified through the multi-criteria analysis for site selection that has been applied to all potentially interesting marine renewable technologies, by jointly considering device requirements in terms of resource availability and depth installation range, environmental constraints, and exclusion zones (e.g., areas reserved for navigation routes). It should be noted that a major constraint for the deployment of marine renewables in the Mediterranean is its steep bathymetry, which causes the costs of WEC mooring systems to increase and forces wind energy technologies to also resort to costly floating structures, as the competing interests of landscape preservation and alternative sea-space use push prospective farms further offshore (Pisacane et al., 2018; Ghigo et al., 2020; Petracca et al., 2022). Together with wind data, accurate wave characterization is therefore also crucial in the design phase of floating platforms for offshore wind deployment at specific locations, also in combination with WECs, in order to optimize the stability of the platform and guarantee low inclination angles in any weather, without excessively inflating the costs (Fenu et al., 2020; Ghigo et al., 2020).
The impact of time-resolution on wave characterization was preliminarily tested, by computing the Probability Density Functions of Hs for different data aggregations (hourly, daily, monthly) over the analyzed period, and verifying that indeed the shape of the distributions significantly changes, in particular as to tail population, while using monthly data also affects the estimate of the mean expected values.
For the three selected islands, the following quantities have been analyzed, using hourly data:
1) Hs mean, standard deviation, and maximum over the entire analyzed period, as indicators of the mean expected productivity of a site (independent of seasonal fluctuations), of its variability, of the expected intermittent productivity peaks and of the possible occurrence of events when the operability threshold of the WEC is exceeded (i.e., when the device must be set in survivability mode, a configuration in which no power can be extracted), or when Operation & Maintenance activities might be impaired;
2) the percentage of time over which Hs exceeds the critical 0.5 m threshold, as an indicator of the overall time the device can be expected productive;
3) the distribution of wave direction
4) omnidirectional wave power
3.1 Malta
Figure 2 shows the maps of significant-height time average (panel A), standard deviation (panel B) and maximum value achieved over the simulation period (panel C). It is worth noting that panel C is in fact a composite map, as maxima are not contemporarily attained at different locations. Due to its position in the middle of the Sicily Channel, Malta is subject to the channeling of the synoptic-scale Mediterranean winds—i.e., the Mistral and Tramontane from the north, the Sirocco from the south and the Bora from the northeast (Burlando, 2009; Omrani et al., 2016)—and it is exposed to waves propagating in either direction along a north-west/south-east axis. As a consequence, mean wave height is everywhere above the levels required for WEC exploitation, and characterized by significant variability, peaking up to
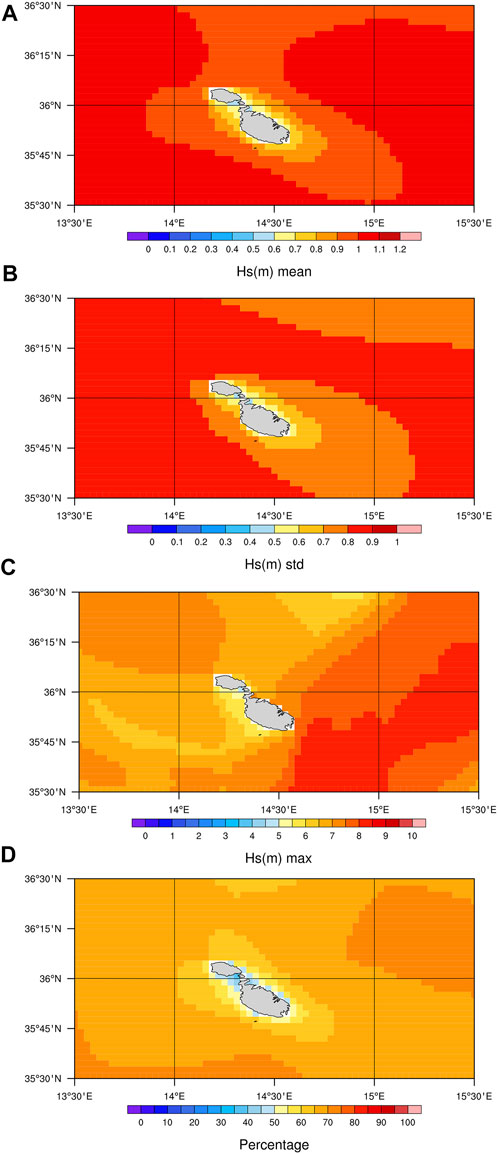
FIGURE 2. Malta Island—Hs average (A), Hs SD (B), and max of Hs over the period 2014–2020 (C); all values are expressed in meters. Panel (D): percentage of time spent over the threshold Hs = 0.5 m.
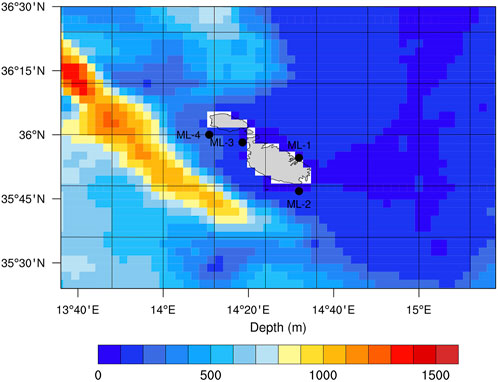
FIGURE 3. Wave model bathymetry for the area around Malta. Locations used for the specific analysis are also shown.
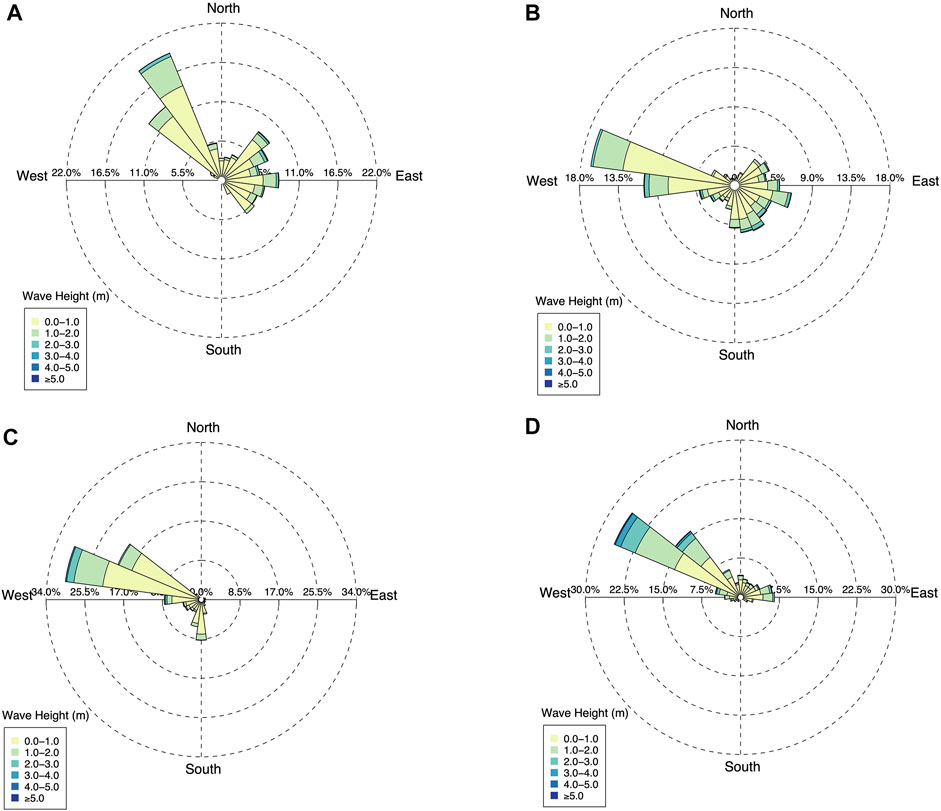
FIGURE 4. Rose plots of significant wave height distribution over wave incoming direction, for sites ML-1 (A), ML-2 (B), ML-3 (C), ML-4 (D) of Figure 3.
Figure 3 shows the candidate locations (ML-n) for this island and the surrounding bathymetry. A preliminary selection of sites was performed through the application of a GIS-based procedure, which allowed (i) to jointly assess the availability of promising wave energy resource (from climatology) and the fulfillment of basic WEC requirements (e.g., maximum installation depth, minimum wave height, wind-speed range if the combined exploitation of waves and offshore wind is foreseen), (ii) to account for environmentally sensitive, protected and/or restricted marine and coastal areas (e.g., for the presence of vulnerable ecosystems, valuable landscapes and cultural heritage, or maritime traffic hubs), and (iii) to map coastal infrastructures and human settlements and activities that can support the installation of devices, compete for the use of maritime space, and/or benefit from the energy produced.
In the case of Malta, the selection criteria for offshore WEC deployment limited site location to within 12 marine miles from the coastline (for operational affordability), and depth range to within the intervals
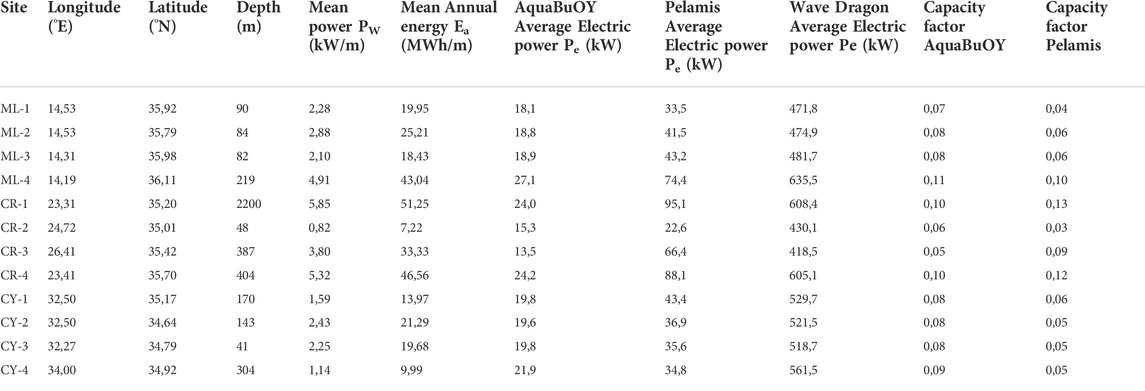
TABLE 1. Synthesis of the relevant parameters that characterize the locations considered in this study.
The characterization of wave height across the different incoming directions is illustrated in Figure 4, for the differently exposed locations. Results are consistent with the overall dominance of northwesterly winds and with the wider spread of easterly winds, which are more evenly distributed among the two right-hand quadrants (Omrani et al., 2016).
The sheltering effect of topography is apparent, and was found to condition the sampling adequacy of the energy distribution shown in Figure 5, where the four scatter plots represent the distribution of the annual mean omnidirectional wave energy as a function of
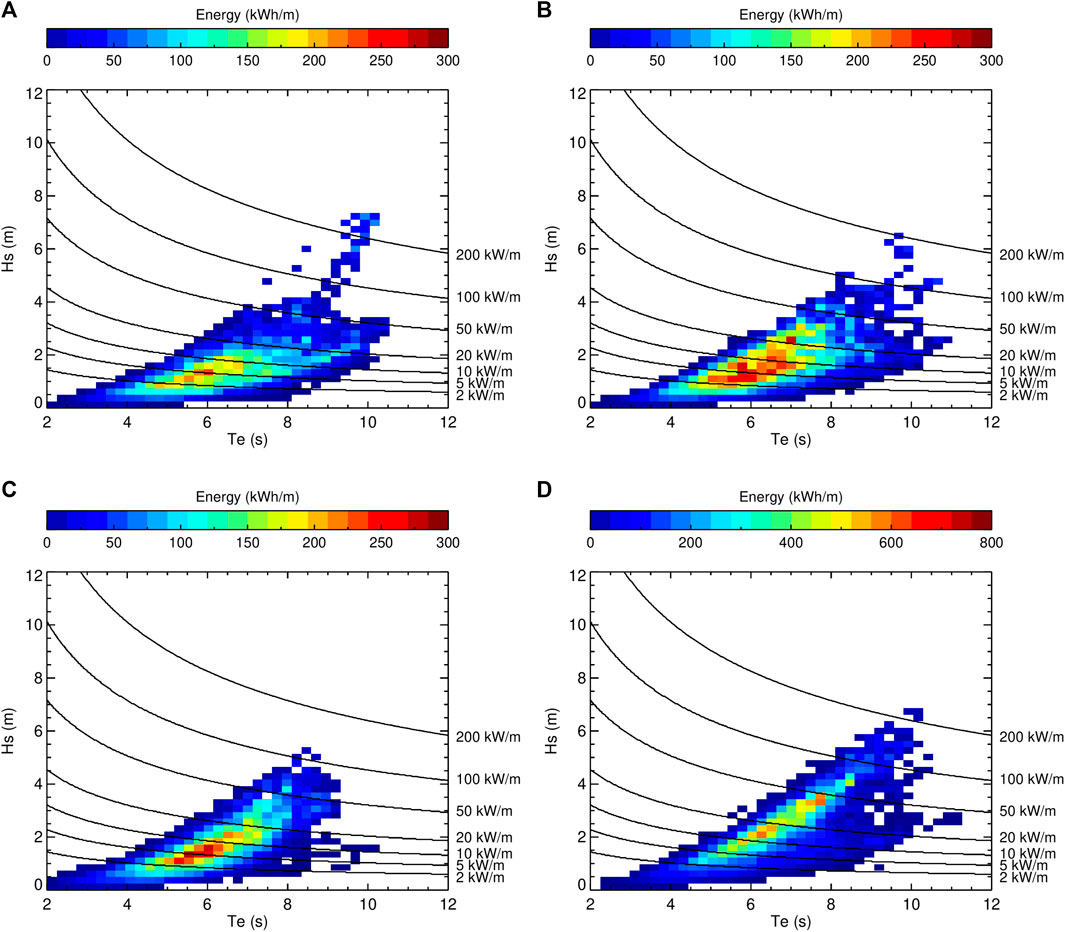
FIGURE 5. Distribution of average annual wave energy as a function of significant wave period and significant wave height, for sites ML-1 (A), ML-2 (B), ML-3 (C), ML-4 (D) of Figure 3. Dotted lines mark reference power levels.
Contributions to wave power are obtained from the energy-flux formula for deep water
where
where
(Folley, 2017).
Reference curves of constant energy flux
At ML-1 (A) and ML-3 (C), the right-leaning elongated core of the energy distribution (roughly corresponding to energy values exceeding
3.2 Crete
Figure 6 shows the maps of Hs time averages (A), SD (B) and maximum value (C) in the area surrounding Crete, which extends from 23.21°E to 26.6°E in longitude and from 34.6°N to 36°N in latitude. Hs mean values range from 0.5 to 1.0 m, and are characterized by comparable variability. The most intense events range from 3 to 8 m. All patterns are consistent with the documented prevalence of the north-northwesterly Etesian winds in the southern Aegean Sea, across all seasons except winter (Zecchetto and De Biasio, 2007). In particular, panel A and B retain the signature of the intensification and increased variability of the Etesian flow over the west and east edges of Crete, as a result of the interaction between the flow and the topography, which also determines the wind deceleration upstream of the island (Koletsis et al., 2009). The Southern coast of the island is thus generally shielded, although an alternation of cyclones and anticyclones is produced in the lee of the island by the wind funneling through the mountain gaps and through the strait between Crete and Karpathos. The strong anti-cyclonic circulation south of the strait extends and intensifies in summer and autumn, following the seasonal cycle of Etesian winds, while the effects on the coast appear to be more moderate and fairly stable throughout the year (Zecchetto and De Biasio, 2007). Overall, the westernmost zone appears to be the most productive, as it is exposed to both the waves propagating from the Ionian Sea and to those locally generated by the prevailing northwesterly winds, but offshore location are above the minimum threshold for WEC deployment all around the island. The percentage of above-threshold time (Figure 6D) indicates that the most productive regions are also quite stable, peaking up to 70%–80% at the western edge, and exceeding 50% at the northeastern tip, while wave energy exploitation might be critical in other coastal regions.
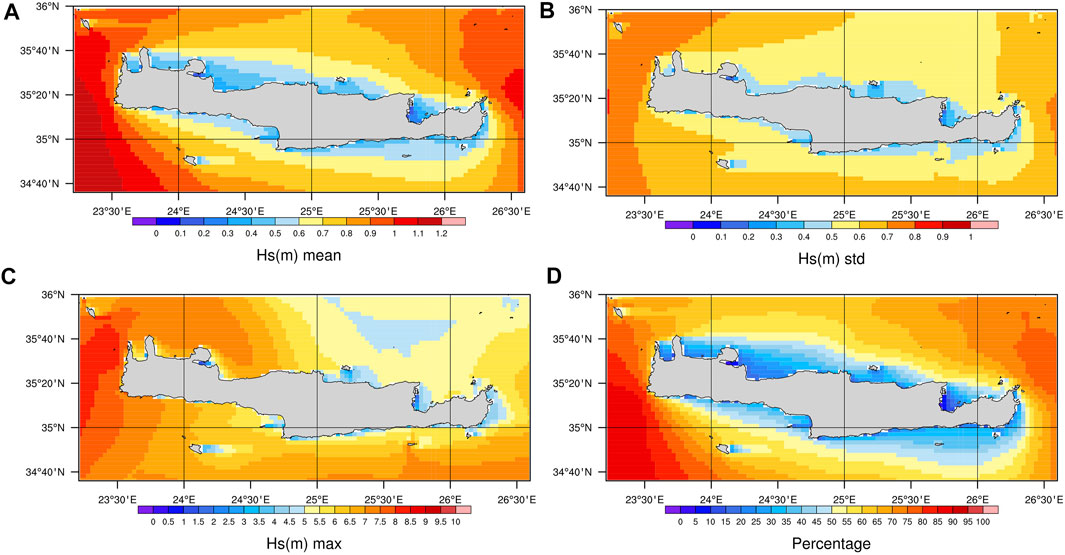
FIGURE 6. Crete Island – Hs average (A), Hs SD (B), and max of Hs over the period 2014–2020 (C); all values are expressed in meters. Panel (D): percentage of time spent over the threshold Hs = 0.5 m.
Candidate sites (CR-n) are shown in Figure 7, together with the bathymetry of the area. Site selection followed the same procedure described for the Malta test-case, and identified CR-2 as a potentially suitable area for the installation of seabed-based and/or oscillating buoy technologies, while CR-3 and CR-4 offered good opportunities for the deployment of wave converters in association with offshore wind farms. According to the parameters reported in Table 1 and from the inspection of Figure 8, CR-1 is situated in a potentially more energetic open-sea region where blue energy exploitation is however impaired by excessive depth, and it only serves as a term of comparison for CR-3 and CR-4, to illustrate the trade-offs between the magnitude of high-energy events and their frequency and/or duration.
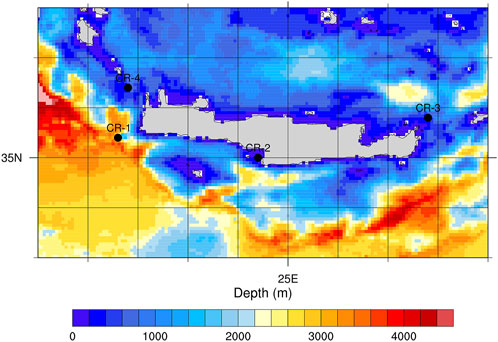
FIGURE 7. Wave model bathymetry for the area around Crete. Locations used for the specific analysis are also shown.
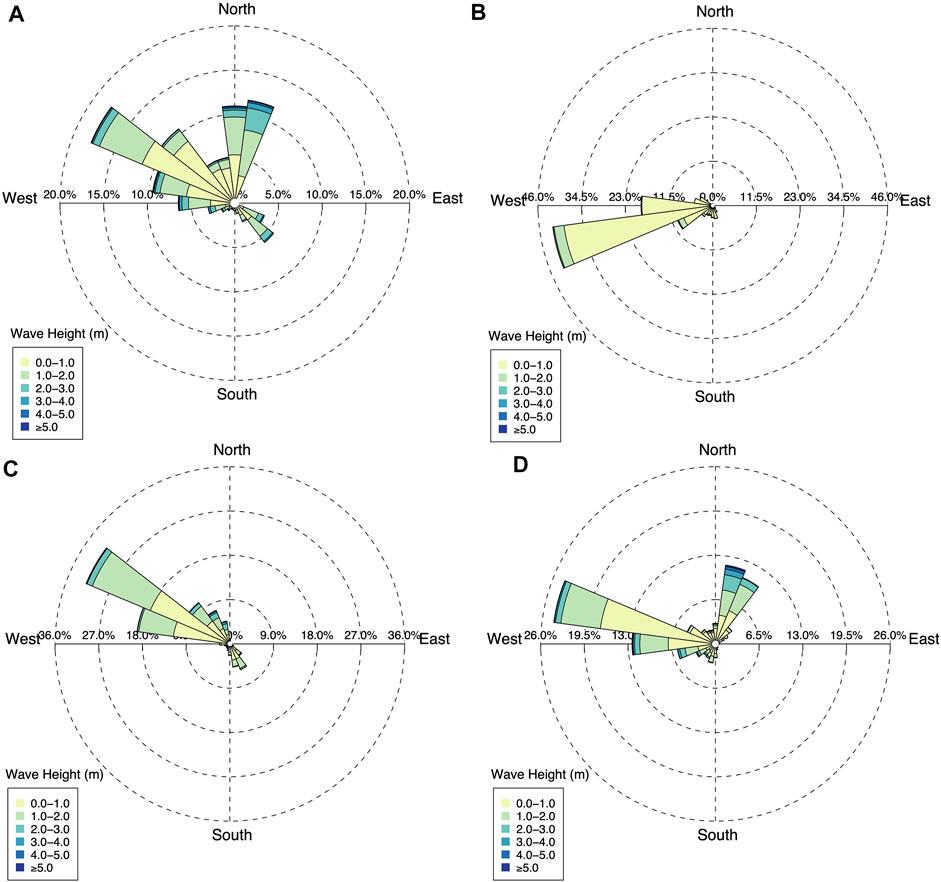
FIGURE 8. Rose plots of significant wave height distribution over wave incoming direction, for sites CR-1 (A), CR-2 (B), CR-3 (C), CR-4 (D) of Figure 7.
For each site, Figure 8 shows the significant wave height distribution over wave incoming direction. The predominance of northwesterly winds is apparent at all sites except CR-2, which is located on the southern coast of the island and therefore characterized by lower wave heights, mainly propagating from the west-southwest.
Figure 9 shows the scatter plots of average annual wave energy at the different locations, as a function of wave period and significant wave height. The average characteristics of each site can be found in Table 1. The distribution of energy differs across sites. The shallower, more sheltered and less energetic CR-2 (note the different energy scale used) attains its maximum values at wave heights lower than 1
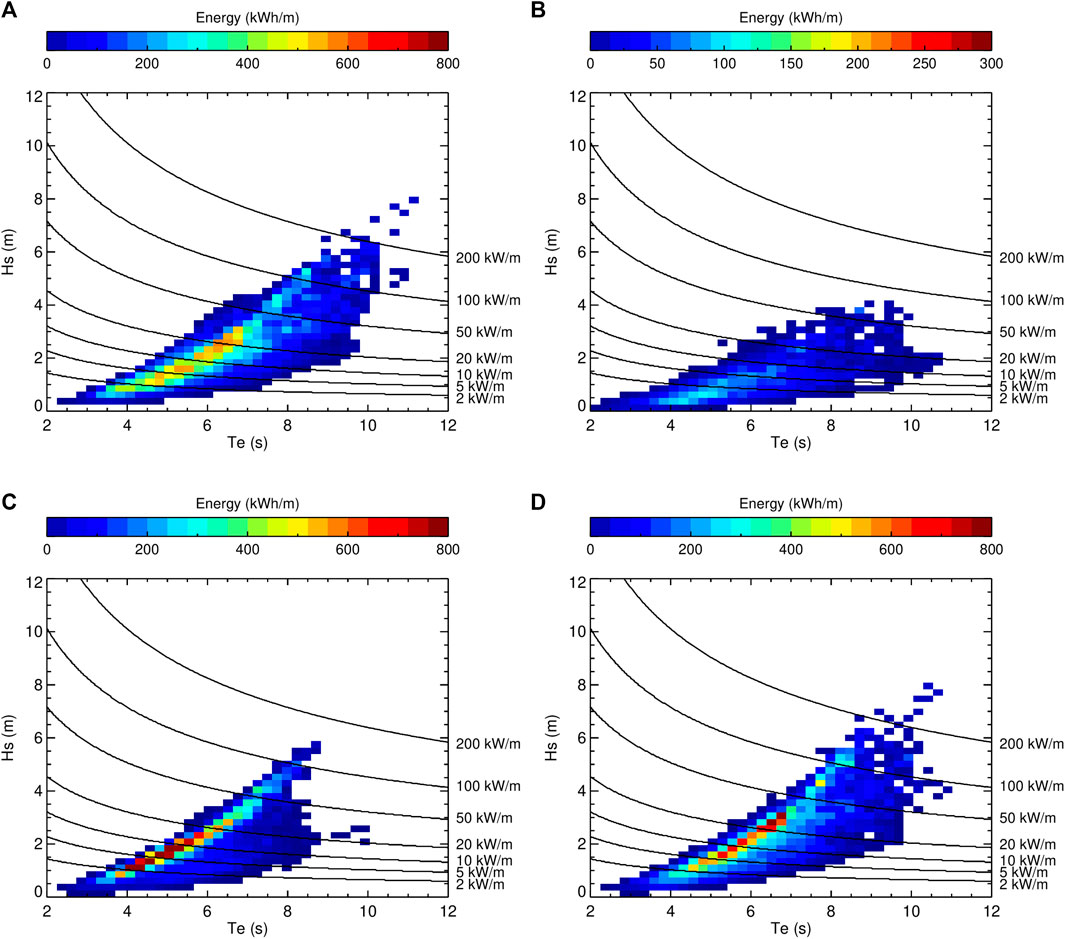
FIGURE 9. Distribution of average annual wave energy as a function of significant wave period and significant wave height, for sites CR-1 (A), CR-2 (B), CR-3 (C), CR-4 (D) of Figure 7. Dotted lines mark reference power levels.
In terms of theoretical mean power, CR-1 is apparently the most energetic site (mean energy above
3.3 Cyprus
If compared to other areas of the Mediterranean basin, wave potential in the Levantine Sea appears to be lower, yet it still deserves attention as local wave height is quite stably above the critical 0.5 m threshold all year round. For Cyprus in particular, maps of the mean (A), the standard deviation (B) and the maximum (C) of Hs, computed over the period 2014–2020, are shown in Figure 10. Consistently with the steady influence of Etesian winds over the eastern Mediterranean, which in this region rotate further counter-clockwise with respect to the southern Aegean, to generally blow from the west (Zecchetto and De Biasio, 2007), the west and south coast are the most energetic, with average Hs equal to 0.8 m, its standard deviation close to 0.6 m, and a maximum of 7 m. The percentage of time spent above the critical threshold of 0.5 m (D) is above 50% for the southwestern shores of the island, locally reaching 70% close to the Limassol region.
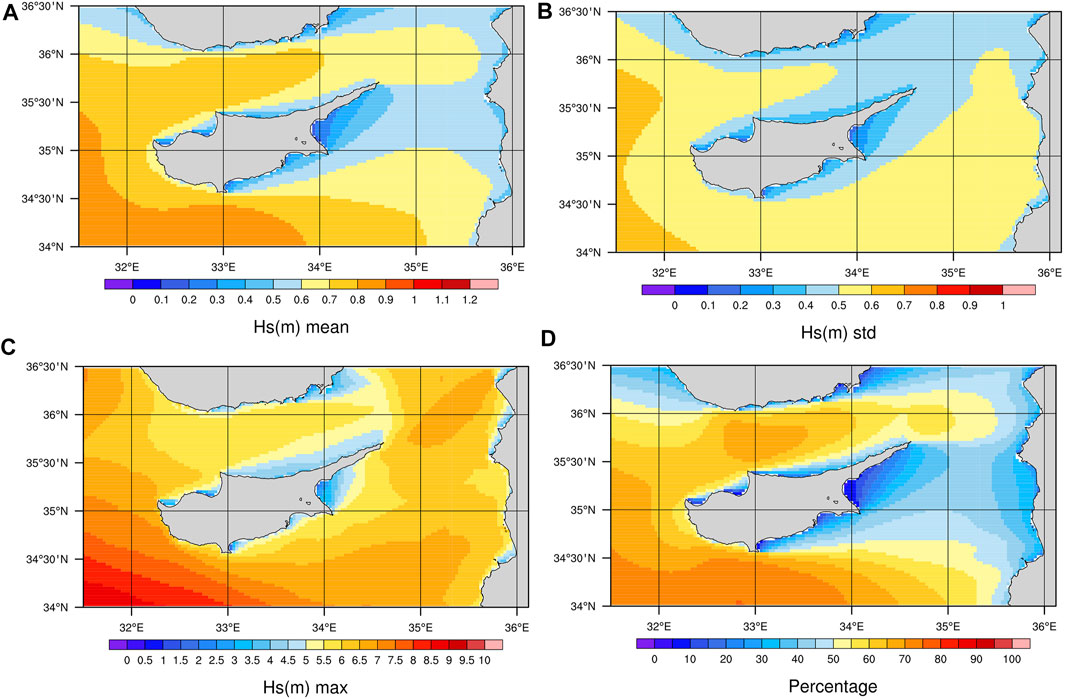
FIGURE 10. Cyprus Island—Hs average (A), Hs SD (B), and max of Hs over the period 2014–2020 (C); all values are expressed in meters. Panel (D): percentage of time spent over the threshold Hs = 0.5 m.
The BE planning activities carried out in collaboration with local stakeholders highlighted several possible pilot areas for the deployment of WECs in Cyprus. Figure 11 shows the most promising ones, resulting from the selection procedure already described and guided by a primary interest from the stakeholders for the deployment of oscillating and/or seabed-based buoys (at CY-1 and CY-2) and of onshore floaters (at CY-3 and CY-4).
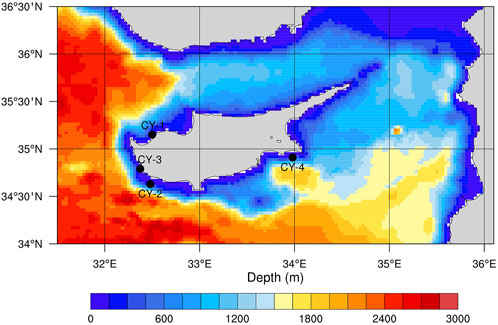
FIGURE 11. Wave model bathymetry for the area around Cyprus. Locations used for the specific analysis are also shown.
As might be expected, candidate sites (CY-n) are all exposed to westerly waves, which rotate southward at CY-4 due to the shielding effect of the island (Figure 12).
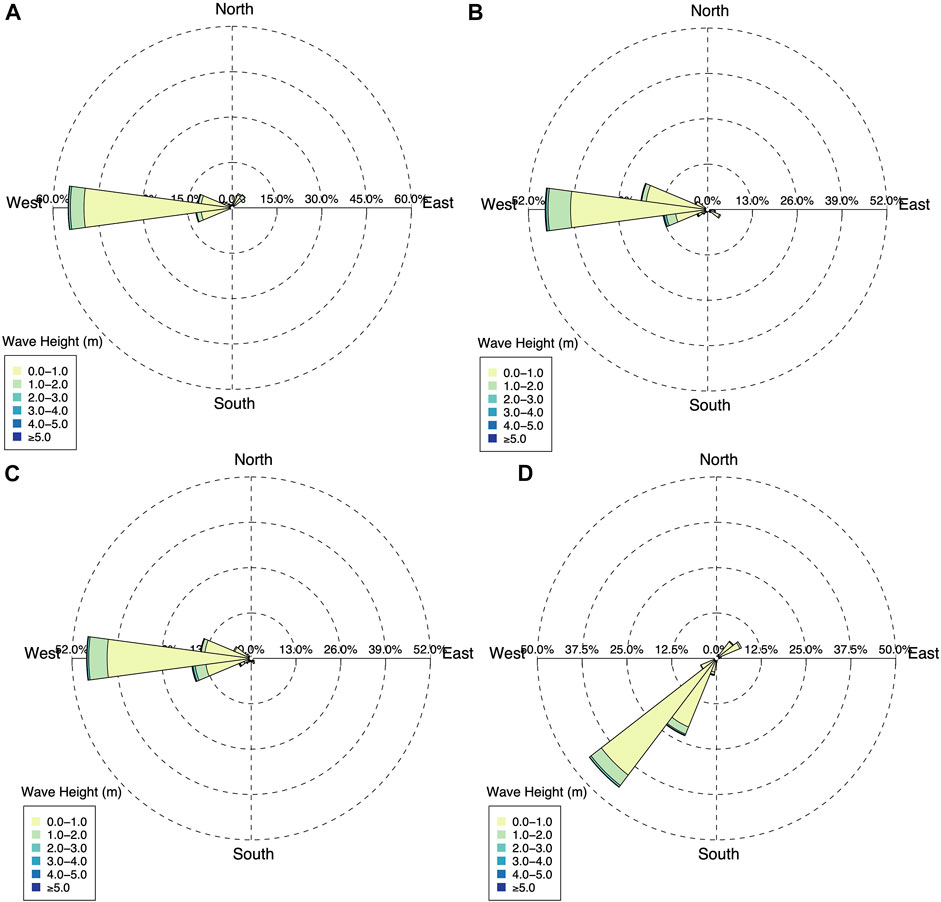
FIGURE 12. Rose plots of significant wave height distribution over wave incoming direction, for sites CY-1 (A), CY-2 (B), CY-3 (C), CY-4 (D), of Figure 11.
The corresponding wave-energy scatterplots are shown in Figure 13, indicating moderate yet interesting potential for WEC deployment, mainly concentrated in persistent low-energy sea states. The high-end tail of the distribution appears to be generally well sampled, although coverage might still be improved.
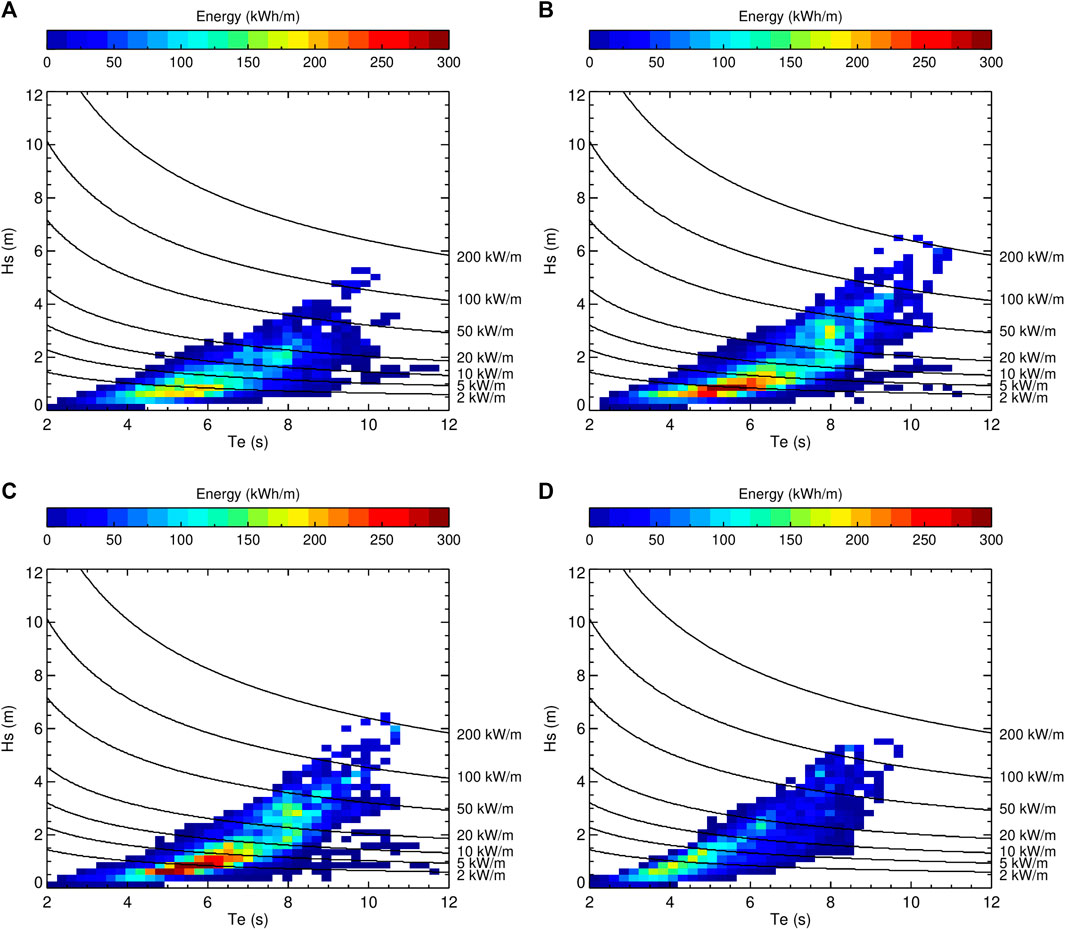
FIGURE 13. Distribution of average annual wave energy as a function of significant wave period and significant wave height, for sites CY-1 (A), CY-2 (B), CY-3 (C), CY-4 (D), of Figure 11. Dotted lines mark reference power levels.
3.4 Summary of site characteristic and theoretical productivity
For each site (column 1), Table 1 summarizes the values of the relevant geographic parameters (columns
where
The three devices selected for the present analysis are the AquaBuOY, the Pelamis and the Wave Dragon. The AquaBuOY is classified as a point absorber, and consist of a floating structure that converts the kinetic energy of the vertical motion of waves into electricity. The cylindrical buoy acts as the displacer, while the large water mass enclosed in the long vertical tube underneath the buoy is the reactor. It has a non-fixed bottom end (i.e., it is moored to the seabed), and it is characterized by small dimensions with respect to the longer wavelengths in which it can operate. A 250 kW buoy has a diameter of 6 m and a draught of 30 m. It has been designed to maximize power output under sustained moderate wave conditions rather than during less frequent extreme events. Its modularity allows deployment in arrays, so as to meet a potentially growing power demand with power plants that are scalable from hundreds of kilowatts to hundreds of megawatts, at the same time guaranteeing a consistent flow of power during maintenance cycles (Poullikkas, 2014).
The Pelamis converter is a floating device classified as an attenuator. It consists of three cylindrical hollow steel segments (diameter of 3.5 m), connected to each other by two degree-of-freedom hinged joints, with the central unit of each joint containing the complete power conversion system. Four hydraulic cylinders resist the wave-induced motion of these joints, both horizontal and vertical, acting as pumps which drive fluid through a hydraulic motor, in its turn driving an electrical generator. Each Pelamis is 120 m long, it is designed to operate in water depths of ∼50 m and each of its three modules is rated at 250 kW power. It is allowed to orient itself to the predominant wave direction by its loose mooring system, while its length contributes to its survivability in harsh sea conditions, by automatically “detuning” from the longer-wavelength high-power waves. Pelamis P-750 machines can produce a total power of 2.25 MW (Drew et al., 2009).
Finally, the Wave Dragon is a floating, offshore Wave Energy Converter (WEC) based on the overtopping mechanism. A doubly-curved ramp conveys oncoming waves, which flow over the top into a reservoir placed above the mean water level, and are then released back to the sea through a set of low-head hydro-turbines. The size and rated energy production of a Wave Dragon unit depend on the wave climate (Soerensen et al., 2003; Parmeggiani et al., 2013).
For each device, theoretical productivity was computed via the formula
where
Overall, the Mediterranean locations considered for this study appear to offer appreciable wave energy resource for the exploitation of currently available devices, whose productivity is still a sizeable fraction of that rated at more energetic Atlantic sites (Rusu, 2014). In particular, the expected electric power ranges between ∼13 and ∼27 kW for the AquaBuOY, between ∼22 and ∼95 kW for the Pelamis, and between ∼418 and ∼635 kW for the Wave Dragon, whereas the corresponding values for North Spain, the Portuguese continental shore, the Canary Islands, and Madeira Archipelago, respectively, are:
• AquaBuOY: [n.a.], [30÷36] kW, [24÷32 kW] and [40÷50 kW];
• Pelamis: [114÷127] kW, [90÷102] kW, [65÷90 kW] and [100÷135 kW];
• Wave Dragon: [2027÷2197] kW, [767÷956] kW, [n.a] and [1147÷1644] kW.
Values are computed for average annual sea states, except for Madeira, where estimates refer to winter conditions (October to March) (Rusu, 2014).
Both Malta and Crete host at least one location (ML-4 and CR-4) that is particularly suitable for wave energy exploitation, due to the comparatively high abundance of the resource, especially if deployment in combination with other marine renewables is envisaged. Nevertheless, also sites where average wave energy is lower are found to offer comparable electric power when the distribution of sea states is combined with device specifications.
The reference nominal power indicated by the manufacturer for the three devices is 0.25 MW (AquaBuOY), 0.75 MW (Pelamis), and 4 MW (Wave Dragon). The Wave dragon appears to be the most effective device, although such result should be weighted in the light of its dimensions, high cost and limited scalability for deployment in low energy sea (Previsic et al., 2004). As a matter of fact, the capacity factor of WECs generally increases with wave power, and their scaling-down is necessary to improve their performance (Guo and Ringwood, 2021; Foteinis, 2022).
In its turn, the relatively small, scalable and manageable AquaBuOY is expected to give a near-optimal economic value of electricity for
As to the Pelamis, its scalability for low energy conditions is still to be fully assessed, despite its high tuneability to wave climate and conversion efficiency. Tests at sea have shown power output to scale to the power of 3.5 of the linear dimension, resulting in a power output at 1:7 scale of roughly 0.1% of the full-scale device (Previsic et al., 2004).
If appropriately scaled-down to between 1/4 and 1/3 of the full WEC size, the two latter devices have been theoretically estimated to reach capacity factors higher than 0.2 along 40% of the Mediterranean coastline, and higher than 0.3 at 8% of the scrutinized locations, including the Sicily Channel, Crete and Cyprus, with rated power ranging between 10 and 30 kW (Bozzi et al., 2018). Capacity factors higher than 0.2 should be regarded as encouraging, in consideration of the relative weight of the other factors that determine WEC viability (i.e. resource variability and device survivability), as well as of the smaller size, which is expected to potentially lower CapEx (Lavidas, 2020). The question remains open as to the opportunity of sub-optimal deployment of devices in the Mediterranean, in view of its extreme vulnerability and of the hidden costs of environmental hazards.
Theoretical productivity is anyway affected by a non-negligible degree of uncertainty, arising from deficiencies in the characterization of the wave climate and/or in the modeling of wave-device interactions, from the misrepresentation of possible external perturbations or from the involuntary omission of relevant dynamics (Guo and Ringwood, 2021). In particular, beside possible model deficiencies, the characterization of the resource only in terms of climatological annual averages cannot account for the inter- and intra-annual variability of wave climate, which has been found to affect the performance of devices, although the generated power appears to be less intermittent than the available wave energy flux, due to the filtering action of device power matrices (Folley, 2017; Guillou and Chapalain, 2018). Variability can indeed result in significantly different power generation across locations for the same annual average incident wave power, and in higher power generation in winter than in summer, ending up with being a strong cost driver in both capital and operational expenditures (Ringwood and Brandle, 2015). After first selecting prospective deployment sites based on their annual average characteristics, further analysis is therefore needed to assess the stability of the resource over time, possibly offsetting adverse short- to mid-term variations through technological improvement, i.e., by enhancing real-time control and power management systems (Guo and Ringwood, 2021).
As a first step in this direction, the most promising locations—one for each island—are compared in Figure 14, as to the overall annual amount of resource and its seasonality. Cyprus lags behind, while the two sites in Crete and Malta, although indeed similar as to average wave power, differ as to its seasonal distribution, with Crete exhibiting higher variability and larger differences between winter and spring with respect to Malta, where the resource is more consistent over the year. As might be expected, summer is the least energetic season in all three islands, as opposed to the increase in energy demand potentially induced by tourism fluxes.
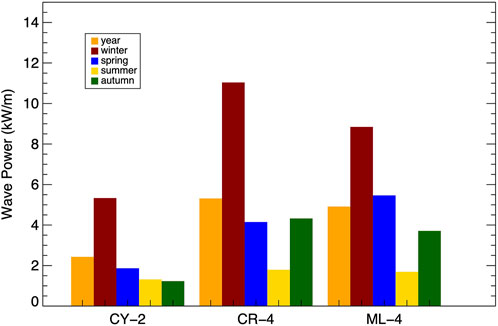
FIGURE 14. Comparison between average annual and seasonal wave power for three of the selected sites.
4 Conclusion and outlook
In the context of the Blue Deal Project, this work represents a first step towards a systematic site-WEC technology matching in the Mediterranean Sea, where, notwithstanding the comparatively limited resource abundance with respect to the world oceans, wave energy deployment can effectively sustain the ongoing transition towards higher shares of renewables, at the same time reconciling the competing interests in the use of marine space and the necessary environmental protection.
For the specific sites selected during the Blue Deal Labs organized in Malta, Crete and Cyprus, the general characterization of the local wave climate via standard average parameters has been significantly improved by the use of the full time-series from high-resolution wave forecasts. Local wave characteristics have been described in terms of spatial and temporal averages and variability, and theoretical power generation has been estimated, highlighting the so far not fully explored potentialities of the Mediterranean region.
In particular, for each island:
• the local prevailing wave regimes have been analyzed;
• the rationale for preliminary site selection has been presented, based on multi-criteria analyses;
• at the selected sites, the distribution of the annual mean omnidirectional wave energy was described, as a function of
• the theoretical productivity of three WECs, the AquaBuOY, the Pelamis and the Wave Dragon, has been computed, as representative of the developmental stage of state-of-the-art technologies;
• opportunities for WEC deployment have been demonstrated.
Future developments critically depend on the definition of effective procedures to scale-down devices that have been designed for harsher sea conditions, as well as on the development of control strategies capable of maximizing power output in moderate-energy seas. Among these, the Mediterranean can indeed offer competitive advantages in terms of lower CapEx and OpEx, mainly due to local resource persistence and to the expected higher survivability of devices. Nevertheless, in order to assess the medium- to long-term economic performance of a wave energy project, the uncertainties in future resource availability should be reduced, inter- and intra-annual variability should be further characterized, and crucial external factors, such as the investment environment, market data and national incentives, should be soundly evaluated.
Data availability statement
The raw data supporting the conclusions of this article will be made available by the authors, without undue reservation.
Author Contributions
AC performed the numerical simulations used and collaborated to the analysis of data and to the writing of the manuscript. GP collaborated to the analysis of data and to the writing of the manuscript. MS coordinated the activities and collaborated to the analysis of the data and to the writing of the manuscript.
Funding
This study has been developed in the framework of the Interreg Med BLUE-DEAL (2019–2022) project co-financed by the European Regional Development Fund. Website: https://blue-deal.interreg-med.eu.
Conflict of interest
The authors declare that the research was conducted in the absence of any commercial or financial relationships that could be construed as a potential conflict of interest.
Publisher’s note
All claims expressed in this article are solely those of the authors and do not necessarily represent those of their affiliated organizations, or those of the publisher, the editors and the reviewers. Any product that may be evaluated in this article, or claim that may be made by its manufacturer, is not guaranteed or endorsed by the publisher.
Abbreviations
CapEx, capital expenditure; Cf, capacity factor; CR-n, nth candidate site at Crete island; CY-n, nth candidate site at Cyprus island; CWR, capture width ratio; Ea, mean available wave energy; Hs, significant wave height; IEC, international electrotechnical commission; IRENA, international renewable energy agency; ISWEC, inertial sea wave converter; J, energy flux per meter of wave crest; LCOE, levelized cost of energy; ML-n, nth candidate site at Malta island; OpEx, operating expenditure; P, power matrix of WEC device; PTO, power take off; PE, average power output; Pn, nominal power; Pw, omnidirectional mean wave power; Te, energy period; Tp, peak period; TS, technical specifications; WAM, wave model; WEC, wave energy converter.
Footnotes
1Namely: a) wind-wave growth; b) whitecapping; c) quadruplet interactions; d) triad interactions; e) diffraction; f) refraction; g) wave reflections; h) wave-current interactions.
References
Astariz, S., and Iglesias, G. (2015). The economics of wave energy: A review,. Renew. Sustain. Energy Rev. 45, 397–408. doi:10.1016/j.rser.2015.01.061ISSN 1364-0321
Atan, R., Goggins, J., and Nash, S. (2016). A detailed assessment of the wave energy resource at the atlantic marine energy test site,. Energies 9, 967. doi:10.3390/en9110967
Bertram, D. V., Tarighaleslami, A. H., Walmsley, M. R. W., Atkins, M. J., and Glasgow, G. D. E. (2020). A systematic approach for selecting suitable wave energy converters for potential wave energy farm sites,. Renew. Sustain. Energy Rev. Vol. 132–110011, 0321. doi:10.1016/j.rser.2020.110011
Bidlot, J. R., Janssen, P. A. E. M., and Abdalla, S. A. (2007). Revised formulation of ocean wave dissipation and its model impact; tech. Rep. Memorandum 509. Reading, UK: ECMWF.
Bozzi, S., Besio, G., and Passoni, G. (2018). Wave power technologies for the Mediterranean offshore: Scaling and performance analysis. Coast. Eng. 136, 130–146. doi:10.1016/j.coastaleng.2018.03.001ISSN 0378-3839
Burlando, M. (2009). The synoptic-scale surface wind climate regimes of the Mediterranean Sea according to the cluster analysis of ERA-40 wind fields,. Theor. Appl. Climatol. 96, 69–83. doi:10.1007/s00704-008-0033-5
Cagninei, A., Raffero, M., Bracco, G., Giorcelli, E., Mattiazzo, G., and Poggi, D. (2015). Productivity analysis of the full scale Inertial Sea wave energy converter prototype: A test case in Pantelleria island. J. Renew. Sustain. Energy. 7, 061703. doi:10.1063/1.4936343
Carillo, A., Lombardi, E., and Sannino, G. (2015a). Validazione del sistema operativo per la previsione del moto ondoso nel Mediterraneo. Available at: https://www.enea.it/it/Ricerca_sviluppo/documenti/ricerca-di-sistema-elettrico/energia-dal-mare/2014/rds-par2014-238.pdf.RdS/PAR2014/238.
Carillo, A., Sannino, G., and Lombardi, E. (2015b). Wave energy potential: A forecasting system for the Mediterranean basin,. Energ. Ambiente Innov. 61 (2), 16–21. doi:10.12910/EAI2015-05
Castro-Santos, L., Silva, D., Bento, A. R., Salvação, N., and Guedes Soares, C. (2018). Economic feasibility of wave energy farms in Portugal. Energies 11, 3149. doi:10.3390/en11113149
Clemente, D., Rosa-Santos, P., and Taveira-Pinto, F. (2021). On the potential synergies and applications of wave energy converters: A review,. Renew. Sustain. Energy Rev. Vol. 135, 110162–110321. doi:10.1016/j.rser.2020.110162110162
Dialyna, E., and Tsoutsos, T. (2021). Wave energy in the Mediterranean Sea: Resource assessment, deployed WECs and prospects. Energies 14, 4764. doi:10.3390/en14164764
Drew, B., Plummer, A., and Sahinkaya, M. (2009). A review of wave energy converter technology. Proceedings of the Institution of Mechanical Engineers, Part A:. Proc. Institution Mech. Eng. Part A J. Power Energy 223 (8), 887–902. doi:10.1243/09576509jpe782
EU Commission (2020). Communication from the commission to the European parliament, the council, the European economic and social committee and the committee of the regions: An EU Strategy to harness the potential of offshore renewable energy for a climate neutral future. Available at: https://eur-lex.europa.eu/legal-content/EN/TXT/?uri=CELEX:52020DC0741 (COM/2020/741 final.
EU Commission (2019). Communication from the commission: The European green deal, COM(2019) 640 final. Available at: https://eur-lex.europa.eu/legal-content/EN/TXT/?uri=CELEX%3A52019DC0640.
EU Directive (2018). Directive (EU) 2018/2001 of the European Parliament and of the Council of 11 December 2018 on the promotion of the use of energy from renewable sources, PE/48/2018/REV/1. Available at: https://eur-lex.europa.eu/legal-content/EN/TXT/?uri=uriserv:OJ.L_.2018.328.01.0082.01.ENG&toc=OJ: L:2018:328:TOC.
EU Proposal (2021). Proposal for a directive of the European parliament and of the council amending directive (EU) 2018/2001 of the European parliament and of the council, regulation (EU) 2018/1999 of the European parliament and of the council and directive 98/70/EC of the European parliament and of the council as regards the promotion of energy from renewable sources, and repealing council directive (EU) 2015/652, COM/2021/557 final Available at: https://eur-lex.europa.eu/legal-content/EN/TXT/?uri=CELEX:52021PC0557.
EU Regulation (2021). Regulation (EU) 2021/1119 of the European parliament and of the council of 30 June 2021: Establishing the framework for achieving climate neutrality and amending regulations (EC) No 401/2009 and (EU) 2018/1999 (‘European climate Law’), PE/27/2021/REV/1. Available at: https://eur-lex.europa.eu/legal-content/EN/TXT/?uri=CELEX:32021R1119.
Fenu, B., Attanasio, V., Casalone, P., Novo, R., Cervelli, G., Bonfanti, M., et al. (2020). Analysis of a gyroscopic-stabilized floating offshore hybrid wind-wave platform. J. Mar. Sci. Eng. 8, 439. doi:10.3390/jmse8060439
Fitzgerald, J., and Bolund, B. (2012). “Technology readiness for wave energy projects; ESB and Vattenfall classification system,” in Proceedings of the 4th International Conference on Ocean Energy (Dublin: Ireland), 17–19.
Folley, M. (2017). “The wave energy resource,” in Handbook of ocean wave energy. Editors A. Pecher, and J. Kofoed (Cham: Springer), Ocean engineering & oceanography, Vol. 7. doi:10.1007/978-3-319-39889-1_3
Foteinis, S. (2022). Wave energy converters in low energy seas: Current state and opportunities. Renew. Sustain. Energy Rev. 162 (112448), 1364–0321. doi:10.1016/j.rser.2022.112448
Foteinis, S., and Tsoutsos, T. (2017). Strategies to improve sustainability and offset the initial high capital expenditure of wave energy converters (WECs). Renew. Sustain. Energy Rev. 70, 775–785. doi:10.1016/j.rser.2016.11.258ISSN 1364-0321
Gallutia, D., Tahmasbi Fard, M., Gutierrez Soto, M., and He, J. (2022). Recent advances in wave energy conversion systems: From wave theory to devices and control strategies. Ocean Eng. 252. doi:10.1016/j.oceaneng.2022.111105
Ghigo, A., Cottura, L., Caradonna, R., Bracco, G., and Mattiazzo, G. (2020). Platform optimization and cost analysis in a floating offshore wind farm. J. Mar. Sci. Eng. 8, 835. doi:10.3390/jmse8110835
Guillou, N., and Chapalain, G. (2018). Annual and seasonal variabilities in the performances of wave energy converters. Energy 165 (B), 812–823. doi:10.1016/j.energy.2018.10.001ISSN 0360-5442
Guo, B., and Ringwood, J. V. (2021). A review of wave energy technology from a research and commercial perspective. IET Renew. Power Gen. 15, 3065–3090. doi:10.1049/rpg2.12302
Günther, H., and Behrens, A. (2011). The WAM model validation document version 4.5.3, tech. Rep. Institute of coastal research helmholtz-zentrum geesthacht (HZG)
Günther, H., Hasselmann, S., and Janssen, P. A. E. M. (1992). The WAM model cycle 4.0, user manual; Deutsches Klimarechenzentrum Hamburg: Hamburg, Germany, Vol. 4, 102pp
Hannon, M., van Diemen, R., and Skea, J. (2017). Examining the effectiveness of support for UK wave energy innovation since 2000: Lost at sea or a new wave of innovation? Glasgow: University of Strathclyde, International Public Policy Institute. doi:10.17868/62210
Harrison, G. P., and Wallace, A. R. (2005). Sensitivity of wave energy to climate change. IEEE Trans. Energy Convers. 4, 870–877. doi:10.1109/tec.2005.853753 2005.853753
Herbach, H., and Janssen, P. A. E. M. (1996). Improvement of the short-fetch behavior in the wave ocean model (WAM). J. Atmos. Ocean. Technol. 16, 884–892.
Holmes, B., and Nielsen, K. (2010). Guidelines for the development & testing of wave energy systems. OES-IA Annex II Task, 2.
Hong, J.-S., Moon, J.-H., Kim, T., Cho, I.-H., Choi, J., and Park, J. Y. (2021). Response of wave energy to tidal currents in the western sea of Jeju Island, Korea. Renew. Energy 172, 564–573. doi:10.1016/j.renene.2021.03.052
IEA (2022). Electricity market report january 2022. Available online at. https://www.iea.org/reports/electricity-market-report-january-2022.
IEA (2021a). Electricity market report july 2021. Available at: https://www.iea.org/reports/electricity-market-report-july-2021.
IEA (2021b). Net zero by 2050: A roadmap for the global energy sector. Available at: https://www.iea.org/reports/net-zero-by-2050.
IEC (2015). Marine Energy: Wave, tidal and other water current converters – Part 101: Tidal energy resource assessment and characterization (IEC TS 62600-101:2015). International Electrotechnical Commission.
IRENA (2020). Innovation outlook: Ocean energy technologies, ISBN 978-92-9260-287-1. Available online at. https://www.irena.org/publications/2020/Dec/Innovation-Outlook-Ocean-Energy-Technologies.
Janssen, P. A. E. M. (2008). Progress in ocean wave forecasting. J. Comput. Phys. 227, 3572–3594. doi:10.1016/j.jcp.2007.04.029
Janssen, P. A. E. M. (1991). Quasi-linear theory of wind-wave generation applied to wave forecasting. J. Phys. Oceanogr. 21, 1631–1642. doi:10.1175/1520-0485(1991)021<1631:qltoww>2.0.co;2
Janssen, P. A. E. M. (1982). Quasilinear approximation for the spectrum of wind-generated water waves. J. Fluid Mech. 117, 493–506. doi:10.1017/s0022112082001736
Janssen, P. A. E. M. (1989). Wave-induced stress and the drag of air flow over sea waves. J. Phys. Oceanogr. 19, 745–754. doi:10.1175/1520-0485(1989)019<0745:wisatd>2.0.co;2
Kallos, G. (1997). “The regional weather forecasting system SKIRON,” in Proceedings, symposium on regional weather prediction on parallel computer environments, October 1997, 15–17. Athens p. 9.
Koletsis, I., Lagouvardos, K., Kotroni, V., and Bartzokas, A. (2009). The interaction of northern wind flow with the complex topography of Crete Island – Part 1: Observational study. Nat. Hazards Earth Syst. Sci. 9, 1845–1855. doi:10.5194/nhess-9-1845-2009
Korres, G., Ravdas, M., Zacharioudaki, A., Denaxa, D., and Sotiropoulou, M. (2021). Mediterranean Sea waves reanalysis (CMEMS med-waves, MedWAM3 system) (version 1) [data set]. Copernicus monitoring environment marine service (CMEMS). doi:10.25423/CMCC/MEDSEA_MULTIYEAR_WAV_006_012
Lavidas, G. (2020). Selection index for wave energy deployments (siwed): A near-deterministic index for wave energy converters,. Energy 196 (117131), 0360–5442. doi:10.1016/j.energy.2020.117131
Lavidas, G., and Blok, K. (2021). Shifting wave energy perceptions: The case for wave energy converter (WEC) feasibility at milder resources,. Renew. Energy 170, 1143–1155. doi:10.1016/j.renene.2021.02.041ISSN 0960-1481
Lehmann, M., Karimpour, F., Goudey, C. A., Jacobson, P. T., and Alam, M. R. (2017). Ocean wave energy in the United States: Current status and future perspectives. Renew. Sustain. Energy Rev. 74, 1300–1313. doi:10.1016/j.rser.2016.11.101
Leira, B. J. (2017). “Multi-purpose offshore-platforms: Past, present and future research and developments,” in Proceedings of the 36th International Conference on Offshore Mechanics and Arctic Engineering OMAE2017.
Mackay, E. B. L., Bahaj, A. S., and Challenor P. G., (2010a). Uncertainty in wave energy resource assessment. Part 1: Historic data. Renew. Energy 35 (8), 1792–1808. doi:10.1016/j.renene.2009.10.026ISSN 0960-1481
Mackay, E. B. L., Bahaj, A. S., and Challenor P. G., (2010b). Uncertainty in wave energy resource assessment. Part 2: Variability and predictability. Renew. Energy 35 (8), 1809–1819. ISSN 0960–1481. doi:10.1016/j.renene.2009.10.027
Mattiazzo, G. (2019). State of the art and perspectives of wave energy in the Mediterranean Sea: Backstage of ISWEC. Front. Energy Res. 7, 114. doi:10.3389/fenrg.2019.00114
Memè, S., Carillo, A., Antonioli, F., Pisacane, G., Struglia, M. V., Bargagli, A., et al. (2020). Previsioni operative dello stato del mare per il Mediterraneo e per 10 sotto-bacini italiani. Report Report RdS/PTR(2019)/163. Avaialable at: https://www.enea.it/it/Ricerca_sviluppo/documenti/ricerca-di-sistema-elettrico/adp-mise-enea-2019-2021/energia-elettrica-dal-mare/report-rds_ptr2019_163.pdf.
Menicou, M., and Vassiliou, V. (2010). Prospective energy needs in Mediterranean offshore aquaculture: Renewable and sustainable energy solutions. Renew. Sustain. Energy Rev. 14 (9), 3084–3091. doi:10.1016/j.rser.2010.06.013
Mérigaud, A., Ramos, V., Paparella, F., and Ringwood, J. (2017). Ocean forecasting for wave energy production. The sea: The science of ocean prediction. Suppl. J. Mar. Res. 75 (17), 459–505. doi:10.1357/002224017821836752
Morim, J., Hemer, M., Wang, X. L., Cartwright, N., Trenham, C., Semedo, A., et al. (2019). Robustness and uncertainties in global multivariate wind-wave climate projections. Nat. Clim. Chang. 9, 711–718. doi:10.1038/s41558-019-0542-5
Mottershead, D. N., Soar, P. J., Bray, M. J., and Hastewell, L. J. (2020). Reconstructing boulder deposition histories: Extreme wave signatures on a complex rocky shoreline of Malta. Geosciences 10, 400. doi:10.3390/geosciences10100400
Omrani, H., Arsouze, T., Béranger, K., Boukthir, M., Drobinski, P., Lebeaupin-Brossier, C., et al. (2016). Sensitivity of the sea circulation to the atmospheric forcing in the Sicily Channel. Prog. Oceanogr. 140, 54–68. doi:10.1016/j.pocean.2015.10.007ISSN 0079-6611
Papadopoulos, A., Katsafados, P., and Kallos, G. (2001). Regional weather forecasting for marine application. Glob. Atmos. Ocean. Syst. 8 (2–3), 219–237.
Parmeggiani, S., Kofoed, J. P., and Friis-Madsen, E. (2013). Experimental study related to the mooring design for the 1.5 MW Wave Dragon WEC demonstrator at DanWEC. Energies 6 (4), 1863–1886.
Petracca, E., Faraggiana, E., Ghigo, A., Sirigu, M., Bracco, G., and Mattiazzo, G. (2022). Design and techno-economic analysis of a novel hybrid offshore wind and wave energy system. Energies 15, 2739. doi:10.3390/en15082739
Pisacane, G., Sannino, G., Carillo, A., Struglia, M. V., and Bastianoni, S. (2018). Marine energy exploitation in the mediterranean region: Steps forward and challenges, Frontiers in energy research. https://www.frontiersin.org/article/10.3389/fenrg.2018.00109.6, DOI=10.3389/fenrg.2018.00109,
Poullikkas, A. (2014). Technology prospects of wave power systems. Electron. J. Energy environ. https://repositoriodigital.uct.cl/bitstream/handle/10925/1653/wave_power_ejee.pdf?sequence=3.24769DOI 10.7770/ejee-V2N1-art662.
Previsic, M., Bedard, R., and Hagerman, G. (2004). E2I EPRI assessment offshore wave energy conversion devices. E2I EPRI WP–004–US–Rev 1, 1–52.
Pulselli, R. M., Struglia, M. V., Maccanti, M., Bruno, M., Patrizi, N., Neri, E., et al. (2022). Integrating blue energy in maritime spatial planning of mediterranean regions. Front. Energy Res. Sec.. Sustainable Energy Systems and Policies. doi:10.3389/fenrg.2022.939961
Ramos, V., and Ringwood, J. V. (2016). Exploring the utility and effectiveness of the IEC (international electrotechnical commission) wave energy resource assessment and characterisation standard: A case study,. Energy 107, 668–682. doi:10.1016/j.energy.2016.04.053ISSN 0360-5442
Reeve, D. E., Chen, Y., Pan, S., Magar, V., Simmonds, D. J., and Zacharioudaki, A. (2011). An investigation of the impacts of climate change on wave energy generation: The Wave Hub, Cornwall, UK,. Renew. Energy 36 (9), 2404–2413. doi:10.1016/j.renene.2011.02.020ISSN 0960-1481
Ringwood, J., and Brandle, G. (2015). A new world map for wave power with a focus on variability, in: European wave and tidal energy conference, pp. 1–8. Nantes, France, rusu, E. (2014). Evaluation of the wave energy conversion efficiency in various coastal environments. Energies 7, 4002–4018. doi:10.3390/en7064002
Silva, D., Rusu, E., and Guedes Soares, C. (2018). The effect of a wave energy farm protecting an aquaculture installation,. Energies 11 (8), 2109. doi:10.3390/en11082109
Soerensen, H. C., Friis-Madsen, E., Panhauser, W., Dunce, D., Nedkvintne, J., Frigaard, P. B., et al. (2003). Dev. Wave Dragon Scale 1:50 to Prototype. In Proceedings from the fifth European wave energy conference: Cork, Ireland, 2003 (vol. Session 11)
Tran, N., Sergiienko, N. Y., Cazzolato, B. S., Ding, B., Wuillaume, P.-Y., Ghayesh, M. H., et al. (2021). On the importance of nonlinear hydrodynamics and resonance frequencies on power production in multi-mode WECs. Appl. Ocean Res. 117 (102924), 102924. 0141-1187. doi:10.1016/j.apor.2021.102924
Ulazia, A., Esnaola, G., Serras, P., and Penalba, M. (2020). On the impact of long-term wave trends on the geometry optimisation of oscillating water column wave energy converters. Energy 206 (118146). 0360-5442. doi:10.1016/j.energy.2020.118146
Vicinanza, D., Di Lauro, E., Contestabile, P., Gisonni, C., Lara, J., and Losada, I. J. (2019). Review of innovative harbor breakwaters for wave-energy conversion. J. Waterw. Port. Coast. Ocean. Eng. 145, 10. .1061/(ASCE)WW.1943-5460.0000519. doi:10.1061/(asce)ww.1943-5460.0000519
WAMDI-group (1988). The WAM model—a third generation ocean wave prediction ModelThe WAM model - a third generation ocean wave prediction model, in J. J. Phys. Oceanogr. 18, 1775–1810. doi:10.1175/1520-0485(1988)018<1775:twmtgo>2.0.co;2
Wan, L., Gao, Z., Moan, T., and Lugni, C. (2016). Comparative experimental study of the survivability of a combined wind and wave energy converter in two testing facilities. Ocean. Eng. 111, 82–94. doi:10.1016/j.oceaneng.2015.10.045
Weber, J. (2012)., WEC Technology Readiness and Performance Matrix–finding the best research technology development trajectoryProc. 4th Int. Conf. Ocean Energy, Ireland (Vol. 17). Dublin.
Widén, J., Carpman, N., Castellucci, V., Lingfors, D., Olauson, J., Remouit, F., et al. (2015). Variability assessment and forecasting of renewables: A review for solar, wind, wave and tidal resources,. Renew. Sustain. Energy Rev. 44, 356–375. doi:10.1016/j.rser.2014.12.019ISSN 1364-0321
Wolf, J., Woolf, D., and Bricheno, L. (2020). Impacts of climate change on storms and waves relevant to the coastal and marine environment around the UK10.14465/2020.arc07.saw. MCCIP Sci. Rev. 2020, 132–157.
Keywords: wave energy, energy resource assessment, Mediterranean sea, wave forecast system, marine spatial planning
Citation: Carillo A, Pisacane G and Struglia MV (2022) Exploitation of an operative wave forecast system for energy resource assessment in the Mediterranean Sea. Front. Energy Res. 10:944417. doi: 10.3389/fenrg.2022.944417
Received: 15 May 2022; Accepted: 27 July 2022;
Published: 29 August 2022.
Edited by:
Siamak Hoseinzadeh, Sapienza University of Rome, ItalyReviewed by:
Mamdouh El Haj Assad, University of Sharjah, United Arab EmiratesShahin Shoeibi, Islamic Azad University Semnan, Iran
Hamed Kariman, Shahid Beheshti University, Iran
Farbod Esmaeilion, K. N. Toosi University of Technology, Iran
Copyright © 2022 Carillo, Pisacane and Struglia. This is an open-access article distributed under the terms of the Creative Commons Attribution License (CC BY). The use, distribution or reproduction in other forums is permitted, provided the original author(s) and the copyright owner(s) are credited and that the original publication in this journal is cited, in accordance with accepted academic practice. No use, distribution or reproduction is permitted which does not comply with these terms.
*Correspondence: Giovanna Pisacane, Z2lvdmFubmEucGlzYWNhbmVAZW5lYS5pdA==