- 1The Wang Yanan Institute for Studies in Economics, Xiamen University, Xiamen, China
- 2School of Business, Gachon University, Sujeong-gu, SouthKorea
- 3Queen’s Management School,Queen’s University Belfast, Belfast, GB-NIR, United Kingdom
- 4School of Sociology, University of Chinese Academy of Social Sciences, Beijing, China
Energy poverty is a crucial issue faced by countries all around the world, as the largest developing country in the world, China is also experiencing energy poverty problems. In order to explore the health effect of energy poverty in China, this paper first uses the principal component analysis (PCA) to construct a comprehensive index to measure energy poverty, and then adopts the ordinary least square method (OLS), fixed effect model (FE), instrumental variable two-stage least squares (IV-2SLS) regression to study the impact of energy poverty on the physical and mental health of Chinese people based on China Family Panel Studies 2018 (CFPS 2018). The study discovers that energy poverty significantly hampers the mental and physical health of Chinese people, an increase in energy poverty might cause 28.74%、18.69% decrease in mental and physical health respectively. Moreover, this paper further explores the influencing paths of energy poverty by intermediary effect and regulatory effect. It is revealed that in addition to directly affecting physical and mental health, energy poverty also have a negative impact on physical and mental health by affecting the accessibility of a series of resources, such as water and food, reducing the opportunities for physical exercise and increasing medical expenses. However, the impact is restricted by age and family income. Finally, under the national strategy of China, this paper further discusses how to give consideration to the joint implementation of heath and emission reduction strategies, then gives specific policy suggestions based on the results.
1 Introduction
Although China has built a well-off society in 2020 and completed the feat of eliminating absolute poverty (Wan et al., 2021),China’s relative poverty still exists and will be an urgent problem for the country in the future. Nowadays, with the rapid economic development, energy poverty in China refers more to a kind of relative poverty. For people living in energy poverty, energy poverty deprives them of their basic rights and seriously affects their quality of life, for the country, energy poverty in China is manifested in unfair energy distribution, unsustainable energy consumption structure and high energy cost. These manifestations may hinder the process of improving people’s livelihood as well as sustainable development, and also have a negative effect on the realization of China’s long-term economic development goals (Wang et al., 2015). Therefore, in the contemporary China, energy poverty is still a relevant topic that needs to be discussed.
Energy poverty is often defined as the inability to access or afford clean energy for cooking or indoor heating (Thomson et al., 2019). In developed countries, energy poverty usually refers to unaffordable energy consumption, while in developing countries, it also includes the unavailability of energy. However, in the past decade, scholars have found that the meaning of energy poverty is expanding, which means energy poverty has become a multi-dimensional concept, containing the satisfaction of obtaining modern energy or electrical appliances closely related to life, such as refrigeration, entertainment, education and machinery (Okushima, 2017). Hence, Nussbaumer et al. (2012) (Nussbaumer et al., 2012) first proposed the concept of Multidimensional Energy Poverty Index (MEPI) to comprehensively describe energy poverty. But China’s research in energy poverty started relatively late, there are relatively little literature measuring China’s energy poverty and studying its impact from micro-level.
By definition, energy-poor households can only use traditional biomass due to the difficulty in accessing or affording clean energy, and the combustion of these incomplete energy sources can lead to indoor air pollution, and long-term exposure of family members to it is likely to induce asthma, cardiovascular and respiratory diseases (Oum, 2019). At the same time, the lack of access or affordability to clean energy can lead to poor living conditions, such as sweltering heat without cooling energy in summer and cold and dampness in winter, which not only makes people feel physically discomfort, it may also lead to indoor fungal growth and damage to individual health (Boch et al., 2020). Therefore, there are much literature that focus on the relationship between energy poverty and physical health or energy poverty and mental health problems such as depression (Primc et al., 2021).
Early in 1983, Bradshaw and Hutton (1983) (Bradshaw and Hutton, 1983) proposed the concept of fuel poverty, and then Boardman in 1991 pioneered a refinement of the definition of fuel poverty, defining it as a household unable to get adequate energy services less than 10% of its income. In 2013, Hill proposed the low-income-high-cost (LHIC) method definition, also known as the Hills method, which pointed out that an energy-poor household is defined as a household whose reported energy costs are higher than the median level while the household’s average income after deducting energy-related expenditures is lower than official poverty standard. In a subsequent development, an improvement leading to the 10% index emerged, with energy poverty defined based on a minimum income measure of income in replacement of the fuzzy threshold of 10% (Baker et al., 2018). In addition to these indicators for understanding energy poverty at the micro-household level, many studies in recent years have begun to describe energy poverty from a multidimensional perspective. For example, Rafi et al. (2021) (Rafi et al., 2021) constructed a multi-dimensional energy poverty indicator to describe India’s energy poverty by assigning different weights to multiple indicators such as communication, entertainment, lighting, cooking, and household appliances. The MEPI is a comprehensive indicator that takes all aspects of energy poverty into account, especially those based on technological thresholds and those access to modern energy services. The measurement of energy poverty in China can be divided into two categories: micro and macro levels. At the micro level, scholars use indicators in micro-databases such as the Chinese General Social Survey (CGSS) and China Family Panel Studies (CFPS) to measure energy poverty; at the macro level, researchers like Dong et al. (2021) (Dong et al., 2021), utilize provincial panel data in China to construct a multi-faceted energy poverty index by entropy method.
Regarding the multi-faceted impact of energy poverty, scholars mainly focus on the impact of energy poverty on the economic issues such as economic growth (Acharya and Sadath, 2019), income inequality (Nguyen and Ali Nasir, 2021), and entrepreneurship (Cheng et al., 2021); the impact on environmental pollution (Calvo et al., 2022) and public health (Pan et al., 2021); and on other social issues such as education (Apergis et al., 2022). The impact of energy poverty on public health, the topic discussed in this paper, has always been one of the focuses of energy poverty research. Extensive literature confirmed that energy poverty had a significant negative impact on health. Hailemariam et al. (2021) (Hailemariam et al., 2021) used the HILDA (Household, Income and Labour Dynamics in Australia) survey and found that energy poverty increases the likelihood of suffering physical injury using methods such as the instrumental variable method. Similarly, Churchill and Smyth (2021) (Churchill and Smyth, 2021) also used the HILDA survey to confirm the negative impact of energy poverty on the health of Australian residents. In addition, Nawaz (2021) (Nawaz, 2021) used the multi-dimensional energy poverty index and health poverty index constructed by the Alkire-Foster method, and concluded that energy poverty in Pakistan had a significant negative impact on public health through IV-2SLS. In addition to affecting mortality and objective disease indicators, energy poverty also has a significant negative impact on subjective feelings such as self-perceived health, subjective well-being, and depression (Churchill et al., 2020). It is worth mentioning that Zhang et al. (2021) (Zhang et al., 2021) used the entropy method to construct a MEPI from CGSS data, and used the methods of OLS and IV-2SLS to conduct the research and found that MEPI has an negative impact on physical health and subjective health, which is most similar to the research that will be carried out in this paper. In addition, the theoretical basis for the impact of energy poverty on health is also very solid. A lack of adequate warmth or adequate cooling in houses under extreme weather conditions can have devastating health effects that endanger human lives, the use of solid fuels in households due to energy poverty also emits carbon monoxide and carbon monoxide, solid particulate matter caused by solid fuels pollutes indoor air, which leads to mental health and physical illness. Moreover, household air pollution is likely to induce a series of chronic diseases such as high blood pressure and reduced lung function; lack of electricity can lead to stress, anxiety, and the use of lighting alternatives such as candles may lead to vision diseases, house fires, and casualties; insufficient refrigeration can cause food to spoil and possibly lead to food poisoning, increasing anxiety among family members, and also affects household disposable income (Abbas et al., 2021). Therefore, the research of this paper has a profound theoretical basis.
However, most of these literature ignore the interaction and relationship between physical health and mental health, there is very little literature that studies physical and mental health together, and there is a lack of mechanistic research, also, it is a challenge to estimate energy poverty in China at the household level. That is, the measurement of energy poverty in Chinese households should be improved, the joint investigation of the impact as well as influencing path of energy poverty on physical and mental health should be addressed. Thus, this paper focus on the household microscopic level estimation of energy poverty and studying the impact of energy poverty on individual physical and mental health as well as its impact path.
The remaining structure of this paper is as follows: Firstly, the meterials and methods of this study are explained in section 2, after which the empirical results are displayed in section3. Finally, the discussion is given in section 4 in order to give policy recommendations in section 5. The main contributions of this paper are: 1. using PCA to build a new energy poverty measurement system; 2. Researching and explaining the impact of energy poverty on physical and mental health in China; 3. Exploring the influencing path of energy poverty on health, and giving policy recommendations based on the conclusions.
2 Materials and methods
2.1 Data sources
The data come from the China Household Tracking Survey (CFPS), which is one of the most widely used Chinese micro-datasets collected and maintained by the China Social Science Survey Center of Peking University. CFPS was started in 2010 and currently includes five phases: 2010, 2012, 2014, 2016 and 2018. It covers 25 out of China’s 34 provinces and accounts for 95% of China’s population, so it is generally considered nationally representative. This study chooses the data of CFPS 2018. After data cleaning by deducing the missing data, 14,218 households were selected as samples, and the household samples were matched with 36,735 individual samples to obtain the dataset for empirical analysis.
2.2 Measurement of energy poverty
Among the many indicators on energy poverty in this paper, MEPI is the core explanatory variable used for benchmark regression and mechanism research, the rest of EP1-5 are used for robustness test and comparative research.
2.2.1 10% indicator (energy poverty 1)
The first measurement of energy poverty (EP1) in this paper is the earliest and most commonly used measurement of energy poverty, the 10% indicator proposed by Boardman (1991) (Boardman, 1991). The index assigns a value of one to households where the ratio of total household energy consumption to total household income is greater than 10%, indicating energy poverty, while the remaining households are assigned a value of 0. This paper calculates the total household energy consumption (EC) through the related issues in CFPS, such as electricity bills, fuel bills, heating bills, etc. However, simply considering the ratio of household energy consumption to income is inevitably biased, which is likely to include some high-income households with large energy needs in the energy poor group by mistake. Therefore, we propose the next revised 10% indicator.
2.2.2 Revised 10% index (energy poverty 2)
Kahouli (2020) (Kahouli, 2020) believes that it is inappropriate to use the 10% index, and it is likely that some households with high income and high energy consumption are mistakenly assigned to the category of energy poverty, so the 10% index should be revised to a certain extent, that is, it is not considered that energy consumption accounts for Middle-income and above households with a total household income of more than 10% are energy poor, and only low-income households are likely to be considered energy poor. Therefore, referring to the practice of Lin et al. (2021) (Lin and Zhao, 2021), the second measure of energy poverty in this paper is based on the data in the China Statistical Yearbook 2019 that the per capita disposable income of Chinese middle-income households in 2018 was 23,188.9 yuan. Improve the 10% indicator, that is, in the data of CFPS 2018, households with per capita disposable income greater than 23,188.9 yuan are not considered energy poverty even if the ratio of energy consumption (EC) to total household income (Income) is greater than 10%, the revised 10% index (EP2) is a dummy variable, specifically, if EP2 satisfies the following conditions, it is taken as 1, otherwise, it is taken as 0.
where the per capita household income is divided by the total household income by the number of family members, and the per capita disposable income of middle-income households in 2018 was 23,188.9 yuan respectively.
2.2.3 Low income high cost (energy poverty 3)
Low income high cost (LIHC) was proposed by Hill (2011) (Hills, 2011) and is widely used by scholars to describe energy poverty (Kang et al., 2014). In this paper, the specific method of using the LIHC method to construct EP3 is to find the average income and energy consumption of all samples, and assign a value of one to households whose income is lower than the average and whose consumption is higher than the average to define energy poverty, and the remaining households are 0.
2.2.4 Solid fuel use (energy poverty 4)
Solid fuel use is used as a proxy for energy accessibility in most of the literature, but it is also used as a measurement of energy poverty in Nie et al. (2021) (Peng et al., 2021) as a core explanatory variable for robustness check. Therefore, this paper lists it as EP4 and uses it as a representation of energy accessibility to construct the subsequent energy poverty index. The specific compute method is that, if the household uses any fuels other than electricity, liquefied petroleum gas, kerosene, natural gas, or biogas, such as coal, for cooking, then EP4 is assigned as one to indicate energy poverty, and EP4 is 0 for the rest.
2.2.5 Multidimensional energy poverty index (MEPI)
Currently, there are two widely used methods for constructing MEPI: the entropy method (Zhao et al., 2021) and the principal component analysis (PCA) (Gupta et al., 2020). Principal component analysis is a classical method of mathematical dimensionality reduction, which is often used to synthesize a comprehensive index based on the principal components extracted from multiple different index data (Metsalu et al., 2015). PCA uses orthogonal transformation to convert multiple possibly linearly correlated variables into a set of linearly uncorrelated new variables, namely principal components, and uses the extracted principal components to display the characteristics of the data in a smaller dimension (Ringnér, 2008). Referring to Jayasinghe et al. (2021) (Jayasinghe et al., 2021) and Lin and Zhao (2021) (Lin and Zhao, 2021), this paper adopts PCA to determine the weight of each indicator and construct the MEPI as follows:
First, we standardize variables that are not 0–1 dummy variables such as energy consumption ratio (EC) according to Eq (3):
where xij is the jth index of the ith family, and max (xj) and min (xj) represent the largest and smallest xj.
After the data is normalized, the correlation matrix of the sample is calculated, and the eigenvalue λi of the matrix is obtained, and then the orthogonalized unit eigenvector ti corresponding to the eigenvalue is obtained, then the ith principal component of x is yi = tix., after the principal components are obtained, m principal components are selected according to the cumulative variance contribution rate:
Calculate the principal component score after selecting the principal components:
where amj is the value of the mth principal component of the jth index in the component matrix, and λm is the initial eigenvalue of the mth principal component of the correlation matrix in the total variance interpretation.
Then calculate the correlation score coefficient
where
Since the sum of the calculated score coefficients is not 1, we need to standardize the weight of each indicator according to its proportion. The final weight calculation method is as follows:
Finally, MEPI is constructed according to the following weights:
Compared with other single energy poverty indicators, MEPI can better capture more dimensions of energy deprivation. Since the datasets used are different from this paper, Mendoza et al. (2019) (Mendoza et al., 2019) and Zhang et al. (2021) (Zhang et al., 2021), as mentioned above, used seven and nine indicators respectively to construct MEPI, but many of the indicators such as “whether the household has a refrigerator, whether there is an air conditioner, whether there is a washing machine, etc.”, are not contained in CFPS. Therefore, this article only uses the indicator of car ownership (Car) from the two literature for reference. In the two articles, culture, entertainment and education are represented by whether there is a computer and whether there is a TV, since there is no such indicator in CFPS, this paper uses the sum of cultural, entertainment and educational expenditures (EEC) in CFPS instead of constructing dummy variables. At the same time, this paper also refers to and extends Lin and Zhaos’ (2021) (Lin and Zhao, 2021) method of constructing MEPI, adding EP2 (modified 10% indicator), EP3 (whether the fuel used in cooking is clean or not), and the proportion of energy consumption (EC) as composing indicators to construct MEPI. In general, the indicators used in this paper can be divided into affordability (including EP2, energy consumption ratio) and availability (including clean cooking, car ownership, whether there is expenditure on entertainment and education), compared with other methods used in other articles on the construction of energy poverty index based on CFPS data, the indicators selected in this paper are more comprehensive and representative, and they can well describe the degree of household energy poverty. The five indicators selected to construct MEPI and the specific compute method are illustrated in Table 1.
After determining the indicators, the premise test of PCA must be carried out to verify whether these indicators can be used for PCA. Kaiser-Meyer-Olkin (KMO) and Bartlett sphericity test are the most commonly used test methods to test whether PCA can be applied. Table 2 shows the results of the two tests, the KMO test result of 0.63 indicates that these indicators can just be applied to PCA for dimensionality reduction, and the significance of the spherical test is 0.000, which means that the null hypothesis that each variable is independent is obviously rejected, so MEPI can be analyzed by PCA.
Figure 1 presents the spatial distribution of the mean energy poverty indices MEPI and EP2 by province of each household.
2.2.6 Energy deprivation score (EP5)
The Energy Deprivation Score (EP5) is an equal-weighted energy poverty index. Referring to and extending the method used by Churchill et al. (2020) (Churchill et al., 2020), this paper uses the following formula to construct EP5 as the final measurement of energy poverty:
where W1 = W2 = W3 = W4 = 0.25, EP1 was not included in the formula because EP2 was derived from and was superior to EP1. Nie et al. (2021) (Peng et al., 2021) used a threshold of 0.5 to assign a value of one to households with an energy deprivation score greater than 0.5 and construct another 0–1 energy poverty index, as this index has the same concept as EP5, it is not repeatedly considered here.
2.3 Mental and physical health
2.3.1 Mental health
Two variables are used to represent mental health: confidence in the future (Hope) and degree of depression (CESD). Confidence in the future is from a questionnaire in CFPS. The higher the value is, the stronger the confidence in the future, that is, the psychology is more positive and healthy. CESD is the score for depression in CFPS. The higher the score, the greater the possibility of depression, that is, we can say mentally unhealthy.
2.3.2 Physical health
There are two questionnaires about physical health in CFPS 2018, both of which are subjective evaluations of one’s own physical health. One of them is to classify the degree of health, which is divided into five levels: extremely healthy, very healthy, relatively healthy, average, and unhealthy. The assignment is 1–5, the higher the assignment, the lower the subjective physical health level. Therefore, the coefficient should be positive if energy poverty significantly reduces physical fitness. We use this variable (Body)as a baseline regressor, representing physical fitness. Another variable (Body-S) is to score physical health status, that is, the higher the score, the healthier the body, so this paper will use it in the robustness test as a replacement regression variable.
2.4 Control variables
To make the regression more convincible, this paper introduces a series of family and individual level control variables in the regression. Including: family income(Income), gender(Gender, male = 1, female = 0), educational background (Education,1 for college and above, 0 for the rest), age, party membership (Party, one for yes, 0 for no), number of family members (Family), and the place of household registration (Urban, one for urban areas, 0 for rural areas), marital status (Marriage, one for cohabiting and married, 0 for others) (Liang et al., 2021).
2.5 Summary statistics
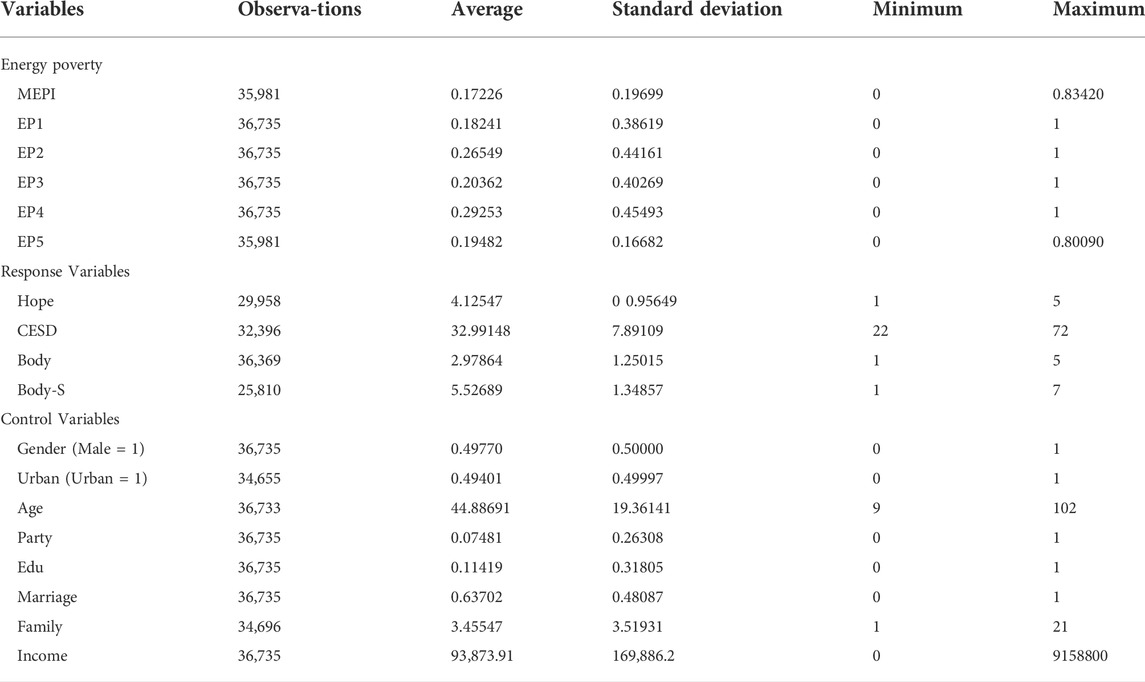
Table 3 presents descriptive statistics for all variables appeared in this paper.
2.6 Empirical models
2.6.1 Baseline regression models
In order to study the impact of energy poverty on physical and mental health, this paper constructs the following benchmark models.
Where
In addition, this paper further introduces a fixed effect model to solve the deviation of the time-invariant disturbance term to the estimated results of this paper. Fixed effects are factors that are difficult to observe and do not change over time or individuals, and are generally used for panel data. The reason for adding fixed effects is that these factors may be related to explanatory variables, and if they are included in the disturbance term, there will be endogeneity problems (Flannery and Rangan, 2006). In fact, many articles adopt fixed effects when using cross-sectional data for differences-in-differences (Tang et al., 2020). Referring to Song and Luo (2021) (Song and Luo, 2021), we add two-way fixed effects of age and province to control the differences between individuals with different ages and provinces.
where
2.6.2 Endogeneity problems
OLS may have endogeneity problems. Before performing IV-2SLS estimation, it is necessary to examine whether benchmark regression using OLS has endogeneity problems. This paper uses the Hausman test to determine whether to use instrumental variables. The Hausman test results show that Prob > Chi2 = 0.000, which significantly rejects the hypothesis that all variables are exogenous. Therefore, we construct the followuing instrumental variable two-stage least squares regression (IV-2SLS) model:
Among them, MEPIi represents the comprehensive energy poverty index, which represents the energy poverty level of the individual; Zi represents the instrumental variable; Xi represents a series of control variables, where the selection of control variables is the same as that in the benchmark regression model (10). The regression model of the second stage is shown in model (13):
Where
Regarding the selection of instrumental variables, the instrumental variables selected in this paper are cooking water and indoor air purification. If the cooking water is tap water, bottled water, pure water, etc., take 0; otherwise, if it is other water sources such as well water, take 1. Indoor air purification indicates whether there is an indoor air purifier. Various feasibility tests in the subsequent IV-2SLS regression demonstrated the validity of the chosen instrumental variables.
2.6.3 Mechanism research
Apart from proving the impact of energy poverty on physical and mental health, this paper also concern about the influencing path of energy poverty on individual physical and mental health, which has not been mentioned in previous literature. Referring to the method used by Jia et al. (2021) (Jia et al., 2022), which used CHARLS2018 to study the impact of energy consumption upgrades on physical health, this paper applies the mediation effect and moderating effect model with fixed effects to explore the impact of energy poverty on physical and mental health. The specific models are as follows, models 14), 15), and 16) are mediating effect models (Xu, 2021), models 17) and 18) are moderating effect models, and model 19) is a mixed model.
Where Mit represents the mediating variable, Const represents the constant term, and
where
Regarding the choice of the mediating variable M, first of all, physical health and mental health affect each other. Physical discomfort is likely to affect mental health, and mental depression and distortion will also manifest in the body. Therefore, we need to combine the influence mechanisms of the two explanatory variables together, as they are mutual intermediary variables, which is one of the reasons why this paper studies the effects of energy poverty on physical and mental health at the same time rather than a single one. Secondly, other material dissatisfaction also has a huge impact on the spirit, so this paper also introduces food expenditure (Food), whether the cooking water source is pure (Water, if the cooking water is tap water, bottled water, pure water, etc.) Take 0, otherwise, if it is other water sources such as well water, take 1) as the mediating variable of MEPI affecting mental health. In addition to mental health, physical exercise (Exercise) is directly related to physical health. People who regularly participate in physical exercise will also have better health. In addition, the expenditure on medical care (Medexp) is also directly related to physical health. Good health of people will spend less on health care, and energy poverty is likely to lead to increased health care spending that affects health. Therefore, this paper selects the above intermediary variables to study the mechanism of energy poverty.
3 Results
3.1 Benchmark regression results
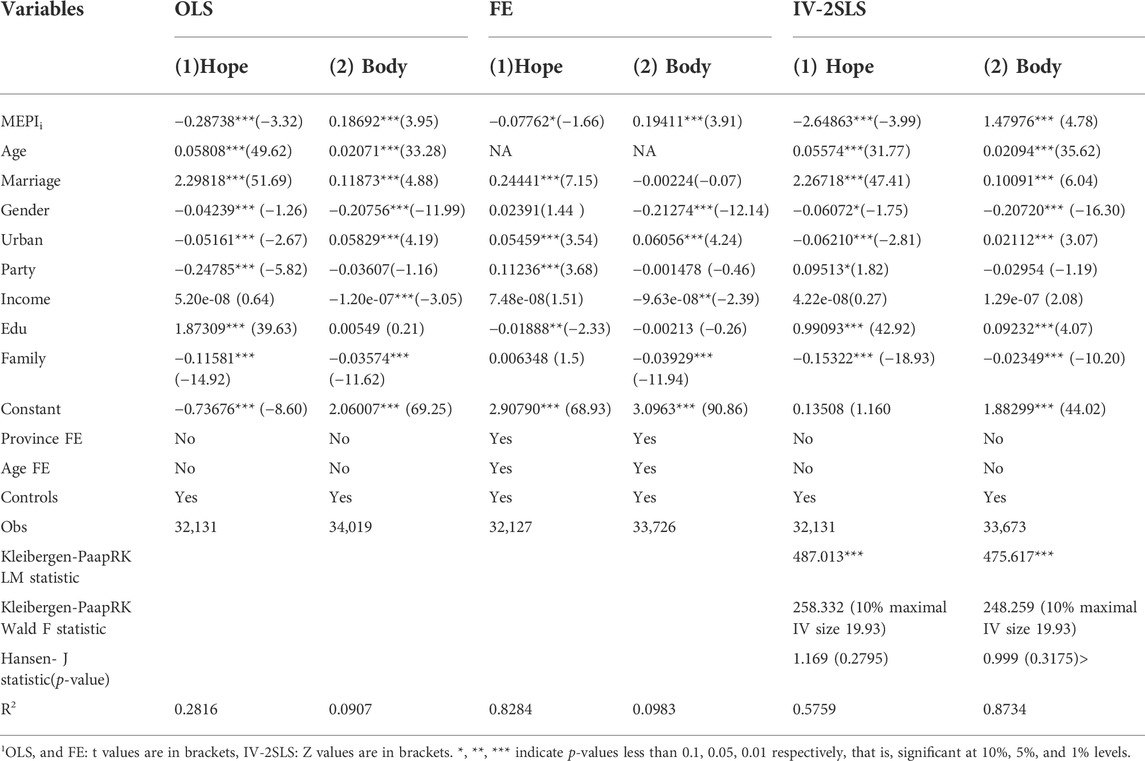
Table 4 presents the results of the benchmark regression, including the regression results of the two main explained variables of mental and physical health using the three methods of OLS, FE, and IV-2SLS, respectively. Since the results are all significant at the 1% level when no control variables were introduced, they are no longer reported here, so all benchmark regression results incorporate control variables. In addition, we only report the regression results of the second stage because it is more crucial than the first stage results.
It can be seen from the coefficient of MEPI in the benchmark regression that no matter which method is used for regression, the negative impact of MEPI on physical health is significant at the 1% level, and MEPI also reduces confidence in the future, except that the fixed effect model is at the 10% level Out-of-significant OLS and IV methods were all significant at the 1% level. Therefore, the negative effects of MEPI on physical and mental health can be preliminarily seen from the coefficients of the benchmark regression.
3.2 Robustness check
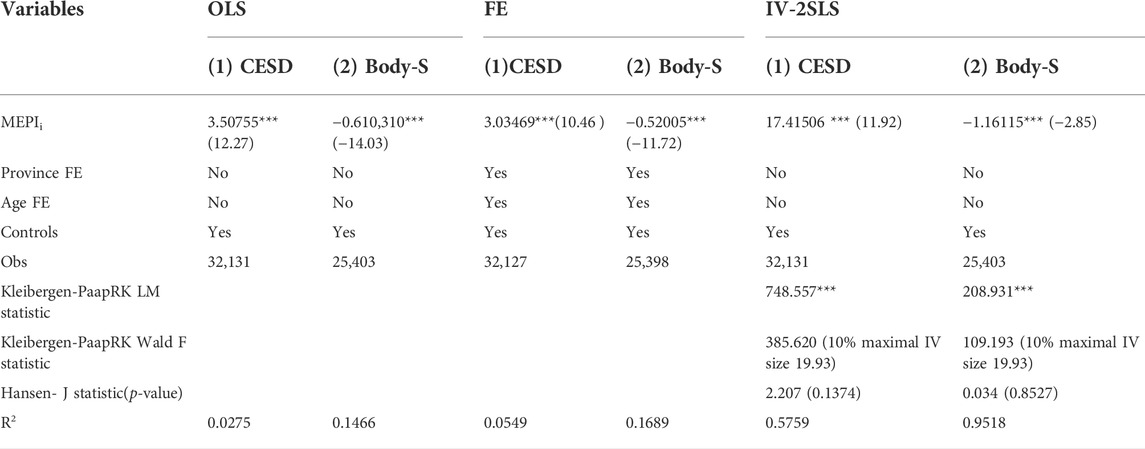
Although three different methods have been used for regression in the previous article, in order to further ensure the robustness of the regression results, a series of robustness tests are also carried out in this paper. First replace the outcome variable, use CESD to describe mental health, and Body-S to describe physical health for regression. Since CESD and Body-S are inverse indicators with Hope and Body, the higher the CESD, the lower the Hope, the less healthy the mind; the higher the Body, the lower the Body-S, the less healthy the body is. Therefore, if the results are consistent with the baseline regression, the MEPI coefficient for CESD should be positive and the Body-S coefficient should be negative. The replacement results are shown in Table 5. The control variables have been introduced, and because it is a robustness test, we only care about the coefficient of the main explanatory variable MEPI, so we will not report the coefficients of other variables.
2 According to the empirical results of Nie et al. (2021) (Peng et al., 2021), when CESD was used as the explained variable, the instrumental variables used in IV-2SLS were changed to food expenditure and cooking water. The OLS and FE brackets are t values, and the IV-2SLS brackets are Z values. *, **, and *** indicate p-values less than 0.1, 0.05, and 0.01, respectively, that is, significant at the 10%, 5%, and 1% levels.
From the coefficients in Table 5, it can be seen that regardless of the use of OLS, FE, and IV-2SLS, energy poverty significantly reduces the physical and mental health represented by CESD and Body at the 1% level, and the results are even more significant than the benchmark regression.
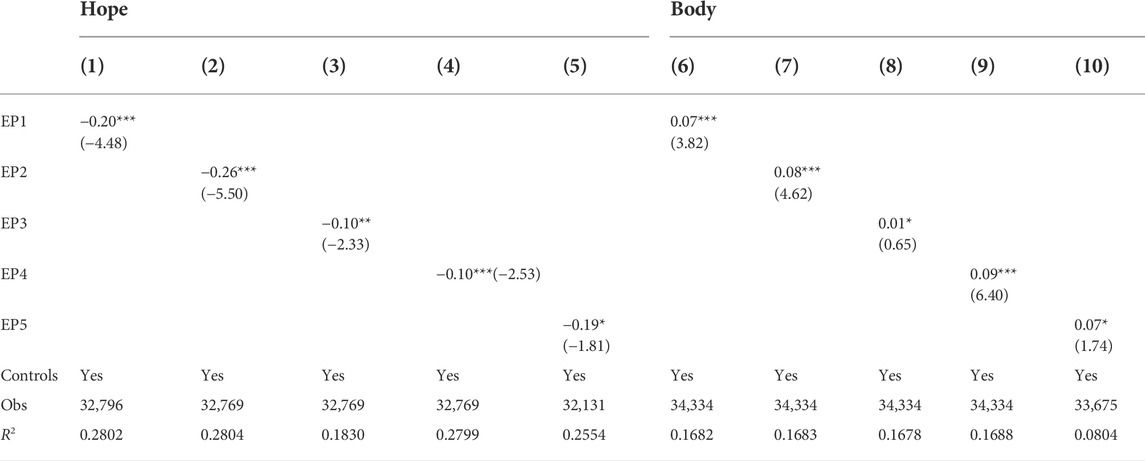
Secondly, we have constructed six energy poverty indices including MEPI in the previous article. Therefore, in order to ensure the robustness of the results, this paper also replaces the main explanatory variables and uses another five energy poverty indices to perform OLS regression to ensure energy efficiency. Poverty does have an impact on physical and mental health, not just the composite energy poverty index MEPI. The results are shown in Table 6.
3The t-values are in parentheses, and the control variables are consistent with the baseline regression. *, **, *** indicate p-values less than 0.1, 0.05.0.01 respectively, that is, significant at 10%, 5%, and 1% levels.
Table 6 shows that no matter what kind of energy poverty index used, the regression results are always significant, once again proves the existence of the negative impact of energy poverty on physical and mental health.
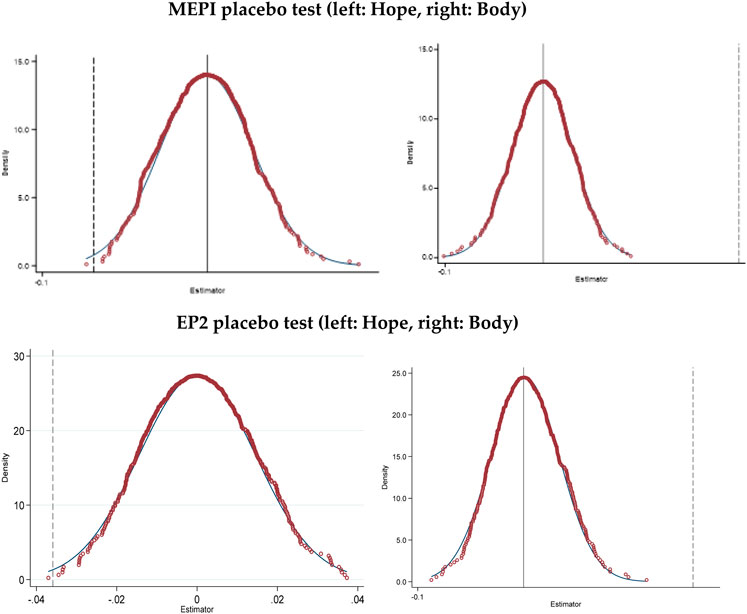
Finally, since EP1-4 are all binary variables of 0–1, this paper selects EP2, which is the most representative and accounts for the largest proportion in MEPI, to conduct a placebo test together with MEPI. Specifically, we assign each individual a random MEPI, EP2 value to generate erroneous estimates, repeat the process 500 times, and regress with Hope and Body as the outcome variables to generate 500 erroneous coefficient estimates. Figure 2 delivers the distribution of MEPI and EP2 coefficient estimates for regression results using bootstrap randomly sampled 500 times.
EP2 placebo test (left: Hope, right: Body).
It can be seen from the results of the placebo test in Figure 2 that the sampling coefficients obey a normal distribution centered at 0, indicating that the test results are credible, and the coefficients in the 500 samplings shown in the two figures are all the same as the original correct MEPI coefficients. -0.06, 0.199, the coefficients of EP2 −0.03, 0.08, that is, the coefficients shown by the dotted line are far from each other, and the placebo test passed, which also shows that the regression results in this paper are more credible, and the results are very likely to be unbiased.
3.3 Mechanism analysis
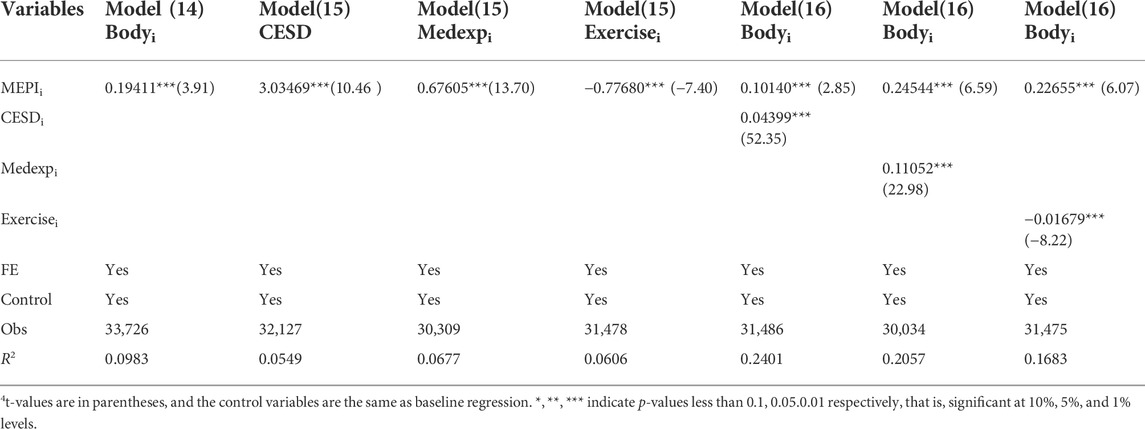
Table 7 report the regression results of the mediating effect of the impact of energy poverty on mental and physical health, respectively.
It can be seen from Table 8 that all mediating variables have passed the mediation effect test, and the results are significant at the 1% level, proving that energy poverty exerts a negative effect on physical and mental health through these mediating variables. At the same time, in terms of coefficients, energy poverty has a negative effect on mental health by reducing food consumption expenditures, reducing physical health, and reducing access to clean water sources, and significantly reducing mental health by reducing mental health, subtracting exercise opportunities, and increasing medical expenses.
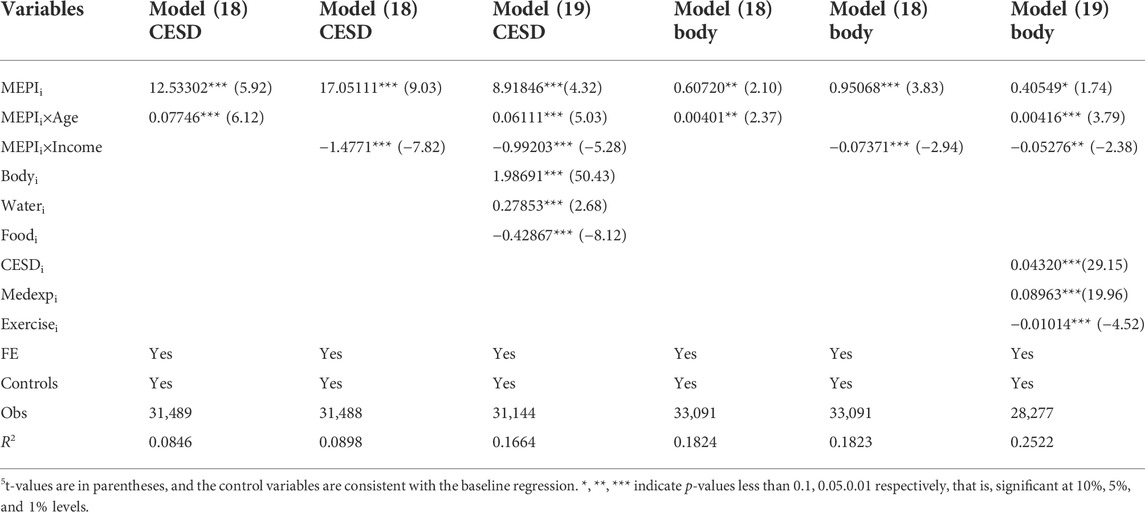
Table 9 reports the results of moderating effects for mental and physical health, respectively. Since the moderating variables “Age” and “Income” were added to the regression as control variables in the previous benchmark regression, we no longer report the results of model (17), and only the results of models 18) and 19) are illustrated in Table 9.
As is shown in Table 9, both the interaction term of the moderating effect and MEPIi are significant, which proves the existence of moderating effect. The sign of the coefficients of age are the same as those of MEPI, but the income is opposite, therefore, age will increase the negative effect of MEPI on physical and mental health, and income significantly reduced the negative effects of MEPI on physical and mental health.
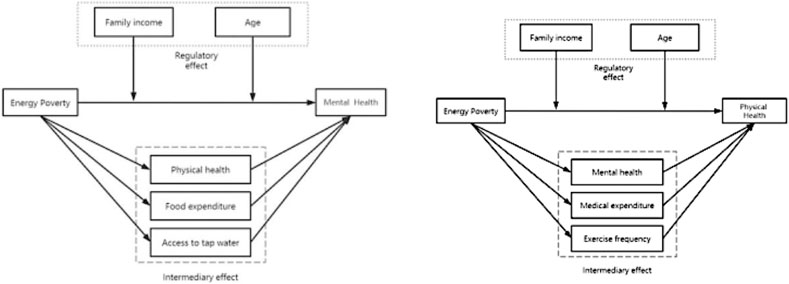
According to the results of mediating effect and moderating effect, the paths of energy poverty affecting physical and mental health can be summarized as in Figure 3.
People in energy poverty need more money for energy, thus, these people spend less money on food and have difficulty meeting their dietary needs. So people in energy poverty have poorer mental health as they’re less satisfied in food acquisition. When a family has difficulty accessing modern clean energy, it is very likely that the family will also have difficulty accessing clean water. Drinking unclean water for a long time will cause damage to the health of family members, because the water may contain Bacteria and viruses, and drinking water is a basic human need, and family members are more likely to be depressed when basic needs are not well met. The gradual deterioration of mental health will also manifest in the body and lead to the emergence of some physical diseases. In addition, people living in energy poverty have less access or affordability to clean energy and therefore have difficulty heating in winter or cooling in summer, which can lead to poorer physical health. In addition, household members in energy poverty may have less time to exercise due to poverty, and problems such as indoor air pollution caused by the use of unclean energy are likely to lead to more diseases and increased medical costs, which is also a sign of poorer physical health. Ultimately, worsening physical and physical health will also lead to worsening mental health, resulting in a vicious cycle of mutual influence. Therefore, energy poverty has a huge impact on the health of family members, both physical and mental health.
4 Discussion
In the previous section, we not only proved that in China energy poverty still exists and demonstrated that energy poverty has a negative impact on people’s physical and mental health, also, part of the influencing pathways were found. The results are of great significant because after announcing a comprehensive well-off society to eliminate absolute poverty in 2020, but China is still facing a long way to go to eliminate relative poverty, and energy poverty is still a serious relative poverty problem in China. The impact and mechanism found in this paper remind us that China needs to carefully tackle the energy poverty problem and protect the health of the public. So, how to deal with energy poverty?
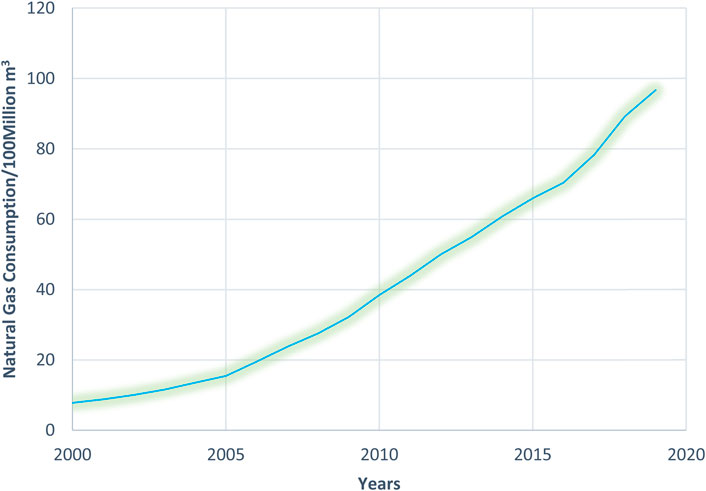
At present China is in the critical year of the “Carbon Peak and Carbon Neutralization Plan” and “Healthy China 2030 strategy”, that is, the realization of 2030 Peak carbon, achieve carbon neutrality by 2060, and be among high-income countries in major health indicators by 2030. Faced with so many severe challenges at the same time, how to grasp and realize the balance of these policies, mutual promotion and common realization? As an important poverty phenomenon, energy poverty may provide the answer. First of all, energy transition can reduce the occurrence of energy poverty (Dong et al., 2021), while energy transformation, energy structure upgrade, especially the use of natural gas can Significantly suppress carbon emissions (Dong et al., 2018) and promote public health (Li et al., 2022a), meanwhile, energy poverty increases carbon emissions (Zhao et al., 2021), so solving or alleviating energy poverty is an essential part of realizing the two plans of China, and achieving the environmental plan by energy transition also greatly alleviate energy poverty. Figure 4 presents the changes in the average natural gas consumption in each province from 2000 to 2019 (data is from China Energy Statistical Yearbook), and Figure 5 demonstrates the provincial average of the MEPI constructed in this paper and the population mortality and natural gas consumption in each province. Figure 6 shows the spatial distribution of these three indicators at the provincial level in 2018. It can also be seen from the rising natural gas consumption that the energy transition also has benefits on energy poverty and public health.
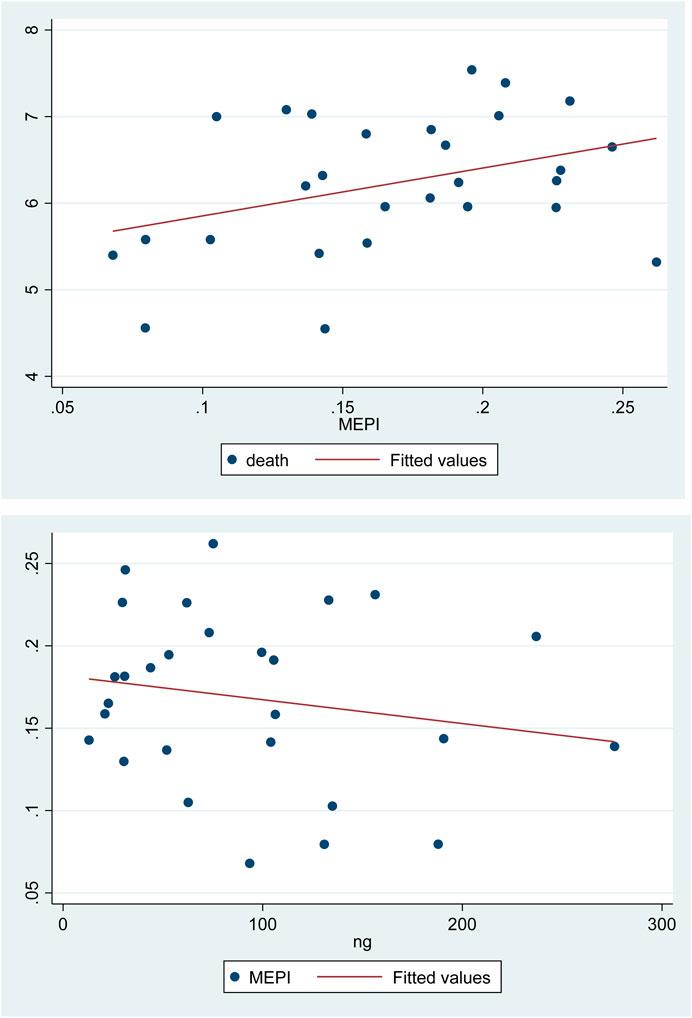
FIGURE 5. Scatter diagram at the provincial level in 2018. Scatter plot of energy poverty on provincial mortality in 2018.
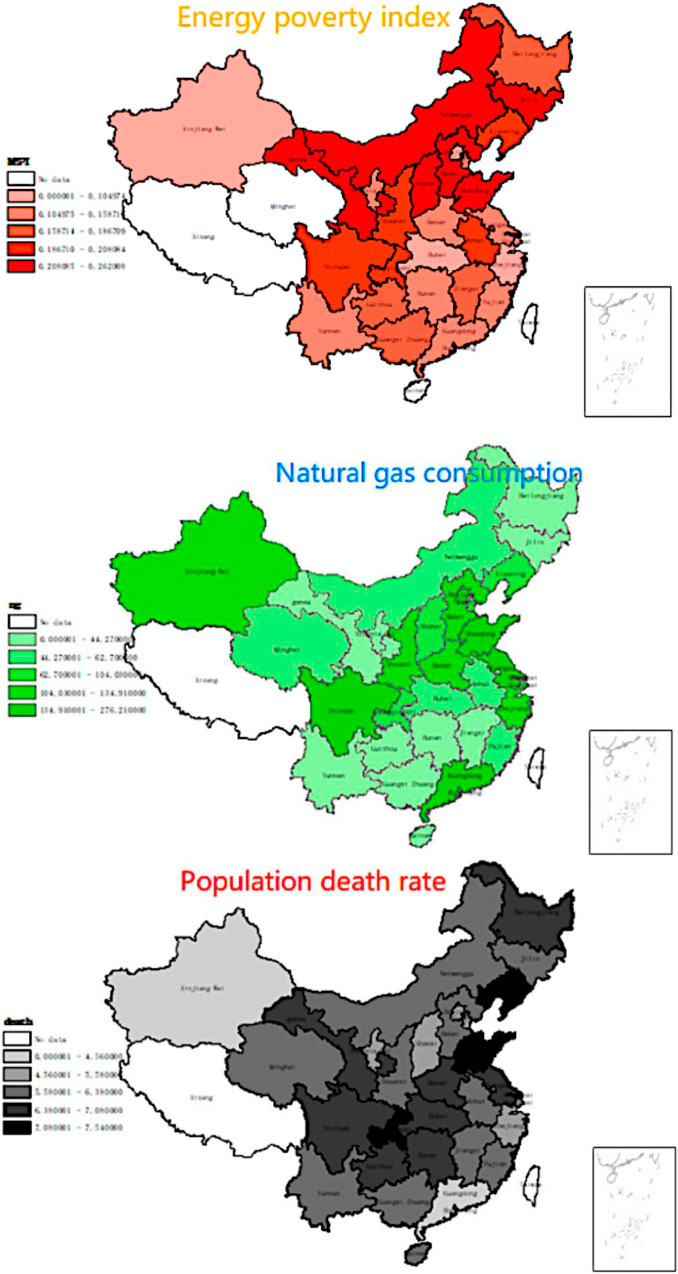
FIGURE 6. Comparison of the spatial distribution of energy poverty, natural gas consumption, and population mortality in 2018.
Scatter plot of natural gas use versus energy poverty in 2018.
Apart from energy transition, the emission reduction in building sector as the vital part of the carbon neutrality transition (Zhang et al.,2022) may be another potential solution to alleviating energy poverty. Energy poverty has mutual effects with carbon emissions (Okushima, 2021), the increasing energy consumption in the operation of commercial buildings results in a large amount of carbon emissions (Li et al., 2022b). Measuring and reducing carbon emissions from buildings (Xiang et al., 2022) can balance the relationship between carbon emissions and energy poverty.
5 Conclusion and policy implication
After empirical analysis, this paper obtains the degree of Chinese household energy poverty measured by micro survey data and studies its impact on people’s physical and mental health, and draws the following conclusions: 1. Energy poverty has significant effects on individual physical and mental health. Negative effects; 2. Energy poverty affects mental health through physical health, food expenditure, and water for cooking, and physical health through effects on mental health, exercise frequency, and medical expenses; 3. Energy poverty also has a certain negative impact on values, the transformation and upgrading of the energy structure can reduce energy poverty.
Therefore, people in the situation of energy poverty will not be stronger and more positive, but will be more unconfident, negative and pessimistic, and physically more distressed, which can be described as poor and short-minded. This result proves the view of most scholars that energy poverty has a negative impact on health. Nowadays, when China vigorously develops public health, protects the environment, implements the “Healthy China 2030 Strategy”, it is clear that the solution of energy poverty is imminent. Chinese president Xi Jinping attaches great importance to the health of the people, and also pays great attention to environmental protection (Xu and Lin, 2022). This paper believes that solving energy poverty is an inescapable issue to achieve a healthy China and the double-carbon plan. Therefore, based on the conclusions of this paper, we give The following policy recommendations are made: 1) Continue to develop, vigorously popularize and popularize clean energy such as natural gas, hydrogen energy and water energy, build infrastructure suitable for clean energy, improve the energy supply service system, and promote the comprehensive transformation of energy; 2) Stabilize energy prices; 3) In addition to physical health, mental health should also be valued, and local people’s governments such as townships and sub-districts should pay special attention to psychological counseling for residents in energy poverty, the government can provide voluntary psychological diagnosis and treatment or provide special medical subsidies, starting from the grassroots level and truly realizing the great vision of a healthy China.
Data availability statement
The original contributions presented in the study are included in the article/supplementary material, further inquiries can be directed to the corresponding author.
Author contributions
WX conceived the concept, designed and conducted the whole empirical analysis, and wrote the paper. BX took part in empirical analysis, constructing econometric models and running codes as well as making figures, writing paper. BL collected data and helped conducting the empirical research, revising and editing the paper as well as making the graphs and tables. WW and YW collected data, helped running codes and making the tables. All the authors read, revised and approved to the submitted the final version of the manuscript. WX, BX, BL share the first authorship.
Conflict of interest
The authors declare that the research was conducted in the absence of any commercial or financial relationships that could be construed as a potential conflict of interest.
Publisher’s note
All claims expressed in this article are solely those of the authors and do not necessarily represent those of their affiliated organizations, or those of the publisher, the editors and the reviewers. Any product that may be evaluated in this article, or claim that may be made by its manufacturer, is not guaranteed or endorsed by the publisher.
References
Abbas, K., Xie, X., Xu, D., and Manzoor Butt, K. (2021). Assessing an empirical relationship between energy poverty and domestic health issues: A multidimensional approach. Energy 221, 119774. doi:10.1016/j.energy.2021.119774
Acharya, R. H., and Sadath, A. C. (2019). Energy poverty and economic development: Household-level evidence from India. Energy Build. 183, 785–791. doi:10.1016/j.enbuild.2018.11.047
Apergis, N., Polemis, M., and Soursou, S.-E. Energy poverty and education:Fresh evidence from a panel of developing countries. Energy Econ. 106, 2022, 105430. doi:10.1016/j.eneco.2021.105430
Baker, K. J., Mould, R., and Restrick, S. (2018). Rethink fuel poverty as a complex problem. Nat. Energy 3, 610–612. doi:10.1038/s41560-018-0204-2
Boch, S. J., Danielle, M., Taylor, M. L. D., Chisolm, D. J., and Kelleher, K. J. (2020). ‘Home is where the health is’: Housing quality and adult health outcomes in the Survey of Income and Program Participation. Prev. Med. 132, 105990. doi:10.1016/j.ypmed.2020.105990
Bradshaw, J., and Hutton, S. (1983). Social policy options and fuel poverty. J. Econ. Psychol. 3, 249–266. Issues 3–4. doi:10.1016/0167-4870(83)90005-3
Calvo, R., Álamos, N., Huneeus, N., and O'Ryan, R. Energy poverty effects on policy-based PM2.5 emissions mitigation in southern and central Chile. Energy Policy 161, 2022, 112762. doi:10.1016/j.enpol.2021.112762
Cheng, Z., Tani, M., and Wang, H. Energy poverty and entrepreneurship. Energy Econ. 102, 2021, 105469. doi:10.1016/j.eneco.2021.105469
Churchill, S. A., and Smyth, R. Energy poverty and health: Panel data evidence from Australia. Energy Econ. 97, 2021, 105219. doi:10.1016/j.eneco.2021.105219
Churchill, S. A., Smyth, R., and Farrell, L. Fuel poverty and subjective wellbeing. Energy Econ. 86, 2020, 104650. doi:10.1016/j.eneco.2019.104650
Dong, K., Ren, X., and Zhao, J. How does low-carbon energy transition alleviate energy poverty in China? A nonparametric panel causality analysis. Energy Econ. 103, 2021, 105620. doi:10.1016/j.eneco.2021.105620
Dong, K., Sun, R., and Dong, X. (2018). CO2 emissions, natural gas and renewables, economic growth: Assessing the evidence from China. Sci. Total Environ. Vols. 640–641, 293–302. doi:10.1016/j.scitotenv.2018.05.322
Flannery, M. J., and Rangan, K. P. (2006). Partial adjustment toward target capital structures. J. Financial Econ. 79, 469–506. doi:10.1016/j.jfineco.2005.03.004
Gupta, S., Gupta, E., and Gopal, K. Household energy poverty index for India: An analysis of inter-state differences. Energy Policy 144, 2020. 111592. doi:10.1016/j.enpol.2020.111592
Hailemariam, A., Sakutukwa, T., and Ling Yew, S. (2021). The impact of energy poverty on physical violence. Energy Econ. 100, 105336. doi:10.1016/j.eneco.2021.105336
Hills, J. (2011). “CASE Reports casereport69,” in Fuel poverty: The problem and its measurement. Interim report of the fuel poverty review (LSE: Centre for Analysis of Social Exclusion).
Jayasinghe, M., Selvanathan, E. A., and Selvanathan, S. Energy poverty in Sri Lanka. Energy Econ. 101, 2021. 105450. doi:10.1016/j.eneco.2021.105450
Jia, P., Zhuang, J., Lucero, A. M. V., and Li, J. (2022)Does the energy consumption revolution improve the health of elderly adults in rural areas? Evidence from China. Sci. Total Environ. 807, 150755. Part 1. doi:10.1016/j.scitotenv.2021.150755
Kahouli, S. (2020). An economic approach to the study of the relationship between housing hazards and health: The case of residential fuel poverty in France. Energy Econ. 85, 104592. doi:10.1016/j.eneco.2019.104592
Kang, L., Lloyd, B., Liang, X.-J., and Wei, Y.-M. (2014). Energy poor or fuel poor: What are the differences? Energy Policy 68, 476–481. doi:10.1016/j.enpol.2013.11.012
Li, H., Zhao, J., Zhang, R., and Hou, B. The natural gas consumption and mortality nexus: A mediation analysis. Energy 248, 2022, 123577. doi:10.1016/j.energy.2022.123577
Li, K., Ma, M., Xiang, X., Feng, W., Ma, Z., Cai, W., et al. (2022). Carbon reduction in commercial building operations: A provincial retrospection in China. Appl. Energy 306. Part B. doi:10.1016/j.apenergy.2021.118098
Liang, J., Zheng, S., Li, X., Xiao, D., and Wang, P. (2021). Associations of community, famliy and early individual factors with body mass index z-scores trajectories among Chinese children and adolescents. Sci. Rep. 11, 14535. doi:10.1038/s41598-021-93949-4
Lin, B., and Zhao, H. Does off-farm work reduce energy poverty? Evidence from rural China. Sustain. Prod. Consum. 27 (2021), 1822–1829. doi:10.1016/j.spc.2021.04.023
Mendoza, C. B., Cayonte, D. D. D., Leabres, M. S., and Manaligod, L. R. A. (2019). Understanding multidimensional energy poverty in the Philippines. Energy Policy 133, 110886. doi:10.1016/j.enpol.2019.110886
Metsalu, T., Vilo, J., and Clust, V. (2015). ClustVis: A web tool for visualizing clustering of multivariate data using principal component analysis and heatmap. Nucleic Acids Res. 43, W566–W570. doi:10.1093/nar/gkv468
Nawaz, S. (2021). Energy poverty, climate shocks, and health deprivations. Energy Econ. 100, 105338. doi:10.1016/j.eneco.2021.105338
Nguyen, C. P., and Ali Nasir, M. (2021). An inquiry into the nexus between energy poverty and income inequality in the light of global evidence. Energy Econ. 99, 105289. doi:10.1016/j.eneco.2021.105289
Nussbaumer, P., Morgan, B., and Modi, V. (2012). Measuring energy poverty: Focusing on what matters. Renew. Sustain. Energy Rev. 16, 231–243. doi:10.1016/j.rser.2011.07.150
Okushima, S. (2021). Energy poor need more energy, but do they need more carbon? Evaluation of people's basic carbon needs. Ecol. Econ. 187, 107081. doi:10.1016/j.ecolecon.2021.107081
Okushima, S. (2017). Gauging energy poverty: A multidimensional approach. Energy 137, 1159–1166. doi:10.1016/j.energy.2017.05.137
Oum, S. (2019). Energy poverty in the Lao PDR and its impacts on education and health. Energy Policy 132, 247–253. doi:10.1016/j.enpol.2019.05.030
Pan, L., Biru, A., and Lettu, S. Energy poverty and public health: Global evidence. Energy Econ. 101, 2021, 105423. doi:10.1016/j.eneco.2021.105423
Peng, N., Li, Q., and Sousa-Poza, A. Energy poverty and subjective well-being in China: New evidence from the China family panel studies. Energy Econ. 103, 2021, 105548. doi:10.1016/j.eneco.2021.105548
Primc, K., Dominko, M., and Slabe-Erker, R. 30 years of energy and fuel poverty research: A retrospective analysis and future trends. J. Clean. Prod. 301, 2021, 127003. doi:10.1016/j.jclepro.2021.127003
Rafi, M., Naseef, M., and Prasad, S. Multidimensional energy poverty and human capital development: Empirical evidence from India. Energy Econ. 101, 2021, 105427. doi:10.1016/j.eneco.2021.105427
Ringnér, M. (2008). What is principal component analysis? Nat. Biotechnol. 26, 303–304. doi:10.1038/nbt0308-303
Song, H., and Luo, C. (2021). The impact of excessive housing price on individual’s value—empirical evidence from CFPS analysis. [J]Economics Q. 21 (05), 1753–1772. doi:10.13821/j.cnki.ceq.2021.05.12
Tang, C., Zhao, L., and Zhao, Z. (2020). Does free education help combat child labor? The effect of a free compulsory education reform in rural China. J. Popul. Econ. 33, 601–631. doi:10.1007/s00148-019-00741-w
Thomson, H., Simcock, N., Bouzarovski, S., and Petrova, S. (2019). Energy poverty and indoor cooling: An overlooked issue in Europe. Energy Build. 196, 21–29. doi:10.1016/j.enbuild.2019.05.014
Wan, G., Hu, X., and Liu, W. China's poverty reduction miracle and relative poverty: Focusing on the roles of growth and inequality. China Econ. Rev. 68, 2021, 101643. doi:10.1016/j.chieco.2021.101643
Wang, K., Wang, Y. -X., Kang, L., and Wei, Y.-M. (2015). Energy poverty in China: An index based comprehensive evaluation. Renew. Sustain. Energy Rev. 47, 308–323. doi:10.1016/j.rser.2015.03.041
Xiang, X., Ma, X., Ma, Z., Ma, M., and Cai, W. (2022). Python-LMDI: A tool for index decomposition analysis of building carbon emissions. Buildings 12, 83. doi:10.3390/buildings12010083
Xu, W., and Lin, J. (2022). Fiscal decentralization, public health expenditure and public health–evidence from China. Front. Public Health 10, 773728. doi:10.3389/fpubh.2022.773728
Xu, W. (2021). The impact and influencing path of the pilot carbon emission trading market--evidence from China. Front. Environ. Sci. 9, 787655. doi:10.3389/fenvs.2021.787655
Zhang, S., Ma, M., Li, K., Ma, Z., Feng, W., and Cai, W. (2022). Historical carbon abatement in the commercial building operation: China versus the US. Energy Econ. 105, 105712. doi:10.1016/j.eneco.2021.105712
Zhang, Z., Shu, H., Yi, H., and Wang, X. Household multidimensional energy poverty and its impacts on physical and mental health. Energy Policy 156, 2021, 112381. doi:10.1016/j.enpol.2021.112381
Keywords: China family panel studies, energy poverty, public health, mechanism research, moderating effect, intermediary effect
Citation: Xu W, Xie B, Lou B, Wang W and Wang Y (2022) Assessing the effect of energy poverty on the mental and physical health in China—Evidence from China family panel studies. Front. Energy Res. 10:944415. doi: 10.3389/fenrg.2022.944415
Received: 15 May 2022; Accepted: 18 August 2022;
Published: 19 September 2022.
Edited by:
Kangyin Dong, University of International Business and Economics, ChinaCopyright © 2022 Xu, Xie, Lou, Wang and Wang. This is an open-access article distributed under the terms of the Creative Commons Attribution License (CC BY). The use, distribution or reproduction in other forums is permitted, provided the original author(s) and the copyright owner(s) are credited and that the original publication in this journal is cited, in accordance with accepted academic practice. No use, distribution or reproduction is permitted which does not comply with these terms.
*Correspondence: Wangzi Xu, eHV3YW5nemkxMDE2QDE2My5jb20=
†These authors share first authorship
 Wangzi Xu
 Baiwei Xie
 Bailu Lou
 Weizheng Wang4
 Yuzi Wang


