 Zongjun Yao1
 Tieyan Zhang
 Yan Zhao
95% of researchers rate our articles as excellent or good
Learn more about the work of our research integrity team to safeguard the quality of each article we publish.
Find out more
ORIGINAL RESEARCH article
Front. Energy Res. , 28 June 2022
Sec. Smart Grids
Volume 10 - 2022 | https://doi.org/10.3389/fenrg.2022.939110
This article is part of the Research Topic Applications of Data-Driven Artificial Intelligence in Integrated Energy Systems View all 10 articles
Aiming at the demand characteristics of “Nearly-zero Carbon Parks" (NZCP) powered by all renewable energy for low-carbon emissions and waste reduction, a NZCP topology and a two-stage robust optimal scheduling model based on the Carbon Capture Gas-fired Power Plant (CCGPP)-Power to Gas(P2G)-Waste Disposal (WD) collaborative model are proposed in this paper. First, the relationship between WD, CCGPP and energy supply and demand that can be generated from renewable energy is studied, and according to the system energy regulation requirements, the energy flexibility of residential loads, small industrial loads and electric vehicles are considered, and the NZCP mathematical model based on the CCGPP-P2G-WD collaborative model is established. Secondly, NZCP energy supply and demand characteristics are studied, and an energy coordination model for NZCP energy conversion and storage powered by 100% renewable energy is established. Then, wind power, photovoltaic power, and combined demand response uncertainties are considered, and the NZCP two-stage robust hybrid optimal dispatch model is established based on second-order cone relaxation and dual theory. Finally, the simulation analysis is carried out based on the operation data of the integrated energy system of a park in a certain area in northern my country. The simulation results show that the proposed two-stage robust optimal scheduling model of NZCP coordinated with WD and CCGPP can effectively improve the economy of the system at a higher energy balance level, improve the absorption capacity of renewable energy, and provide better multi-time scale energy regulation characteristics for NZCP with a larger energy supply scale.
In the context of the zero-carbon strategy and the “dual-carbon” goal under the “14th Five-Year Plan” modern energy system plan, seeking low-carbon, diverse, interactive and sustainable energy coupling and transportation is the key to solving the problems of low-carbon development and transformation of energy in human society (National Development and Reform Commission, 2022).The “China Research Report on Carbon Neutrality Before 2060” pointed out that carbon capture, utilization and storage technology and biomass carbon capture and storage technology are important ways and key means to achieve the goal of carbon neutrality. Carbon capture and storage technology can effectively reduce carbon emissions and achieve zero and negative carbon emissions goals (Cheng et al., 2020; Hu et al., 2021; Wang et al., 2021a). However, most of the carbon capture power plants based on the transformation of traditional coal-fired power plants adopt the split-flow operation mode, and the working process of the absorption tower and the regeneration tower is coupled, resulting in the higher the power output, the greater the energy consumption of carbon capture, and the lack of carbon utilization mechanism. Therefore, considering the negative carbon emission characteristics of biomass waste treatment as a zero-carbon renewable energy and the energy space-time translation characteristics of P2G equipment with both source and load attributes, the establishment of NZCP based on CCGPP-P2G-WD collaborative mode is the key to improve the consumption of renewable energy, reduce carbon emissions and realize carbon recycling.
Carbon capture and storage technology is one of the main low-carbon technologies at the current stage, which can absorb abandoned wind and solar energy and achieve carbon emission reduction. At home and abroad, some researches have been carried out on the flexible operation mode of carbon capture power plants. Cui et al. (2021a) introduces a carbon storage device into the flue gas bypass of a carbon capture coal-fired power plant, shifts the wind power output in time, and proposes a flexible operation mode of coordination between wind power and carbon capture power plants, which improves the wind power consumption capacity; Cui et al. (2021b) introduces price-based demand response into a comprehensive energy system with carbon capture equipment, and adjusts the load to match the output of renewable energy, which reduces the carbon emissions of the system and improves the operating economy of the system; Zhou et al. (2018) proposed a combined operation mode of power-to-gas-carbon capture, which uses CO2 captured by carbon capture equipment as a raw material for methane production in the power-to-gas process, which improves the carbon utilization level on the basis of ensuring economical efficiency.
NZCP fully dispatches zero-carbon resources in the comprehensive energy system of the park, and realizes rapid reduction of carbon emissions and approaches zero through multi-energy coupling and complementation, multi-load demand response, waste treatment and carbon capture and storage technologies. As a typical comprehensive energy application scenario, the park has carried out a lot of researches at home and abroad on the energy balance uncertainty of the park-level comprehensive energy system and the improvement of the energy supply regulation capacity. Zhou et al. (2018) established the topological structure of the integrated energy system of the park, considering the economic indicators of environment and energy efficiency, and proposed an optimization method of the integrated energy system of the park based on the improvement of efficiency and benefit; Fang et al. (2020) analyzes the time-delay characteristics of thermal loads, considers the comprehensive demand response mechanism of various electric heating loads, improves the flexibility of energy supply of the comprehensive energy system in the park, reduces wind and light abandonment, and realizes the coordination and optimization of the comprehensive energy system in the park; Jiang et al. (2021) considers the randomness of renewable energy output and load demand in multi-energy parks, and proposes an optimal scheduling method based on an improved deep deterministic policy gradient algorithm, which reduces the impact of source and load uncertainty on scheduling; According to fuzzy theory, Zhong et al. (2020) expresses wind power and load with fuzzy parameters, and transforms deterministic system constraints into fuzzy chance constraints to solve the source and load uncertainty problem in the optimal dispatch of carbon capture virtual power plants.
Biomass energy is also an important zero-carbon energy source, and a lot of efforts have been made at home and abroad in terms of WD energy supply characteristics and optimized operation. Wang et al. (2021b) studied the energy supply characteristics of waste incineration and sewage gas production, considering the processing capacity and waste output of waste treatment facilities, and proposed an operation strategy for waste treatment facilities to participate in power grid peak regulation; Yang et al. (2021) considers the low-carbon characteristics of waste treatment units and introduces a carbon quota trading mechanism, which improves the consumption capacity of renewable energy while taking into account the waste treatment; Zhou et al. (2019) considered the high energy consumption characteristics of flue gas treatment in waste incineration power plants, decoupled the power generation process from the flue gas treatment process, and used abandoned wind for flue gas treatment, which improved the operation flexibility of waste incineration power plants with a high proportion of wind power connected.
From the above analysis, it can be seen that the current domestic and foreign research on the energy balance characteristics and adjustment capacity of the integrated energy system under the low-carbon constraints mainly focus on the carbon capture technology of coal-fired power plants and the low-carbon economic dispatch considering the carbon quota trading mechanism. On the other hand, there are few studies on the collaborative optimization of CCGPP and WD and the improvement of power grid, heat grid, and gas grid regulation capacity.
Therefore, the NZCP structure based on the CCGPP-P2G-WD synergy model is proposed in this paper, which adopts a fully renewable energy supply method and makes full use of zero-carbon resources such as waste incineration, biogas treatment and multi-load demand response in the park. In addition, the energy supply and demand characteristics of NZCP are deeply analyzed. Firstly, the energy production and conversion model of each equipment is established based on the CCGPP-P2G-WD collaborative model. Secondly, an energy coordination model of NZCP energy conversion and storage is established by using the energy coupling matrix to map the multi-energy coupling method. Then, the NZCP two-stage robust optimal scheduling method is proposed, and the two-stage robust optimal scheduling model is processed based on the second-order cone relaxation and dual theory. Finally, the NZCP simulation model is established, and four scenes are proposed for simulation comparison analysis. The validity and economy of the model proposed in this paper are verified.
The proposed NZCP considering the synergy of waste treatment and carbon capture gas-fired power plants is aimed at the zero-carbon demand and waste treatment demand of the integrated energy system of the park, and considers the energy transfer characteristics of waste incineration flue gas treatment and carbon capture gas-fired power plants carbon storage, which is sufficient. Coordinate zero-carbon resources such as waste treatment and demand-side response in the park, based on the coordinated coupling system between carbon capture, storage and utilization, energy storage medium material flow and energy flow. The CCGPP-P2G-WD collaborative method with multi-temporal scale and multi-energy regulation ability constructed in this paper and the NZCP energy coupling mode and connection relationship it serves are shown in Figure 1. NZCP includes renewable energy supply systems such as wind power generation, photovoltaic power generation, waste incineration and manure treatment, and the entire energy interaction network is composed of power grid, heat network, gas network and transportation network. NZCP realizes the recycling of carbon flow in the energy coupling link through the synergy of CCGPP, WD and P2G.
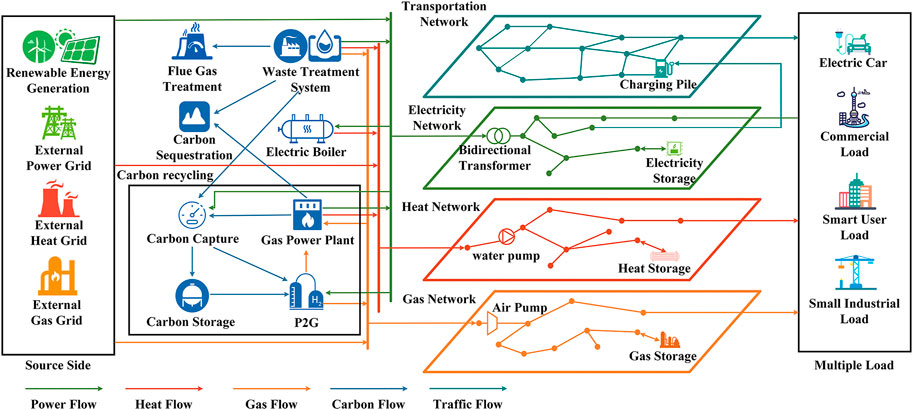
FIGURE 1. “Nearly-zero carbon park” topology diagram.
For the waste treatment requirements of NZCP, the classified combustible waste is transported to a waste incineration power plant for waste incineration to generate electricity (Wang et al., 2021c). Biomass technology is used to convert the dry-wet separation of manure and waste into biogas, which is then purified and processed to obtain natural gas, which is used as the input of carbon capture gas-fired power plants and connected to the natural gas network at the same time (Zhang et al., 2020; Teng et al., 2021).
Considering that in the waste treatment system, waste incineration and manure treatment can support the multi-source regulation capacity of electric heating gas in the park, the energy conversion model is as follows:
where
During the working process of the waste incineration power plant, the exhaust gas needs to be discharged after the flue gas treatment reaches the standard (Xv et al., 2018). However, the energy consumption of flue gas treatment accounts for nearly 1/4 of its power generation, and if it is classified as plant power, it will affect the operating economy of the system (Cao et al., 2020). Therefore, a flue gas storage device was introduced to decouple the waste incineration power generation process from the flue gas treatment process. The flue gas storage device divides the flue gas discharged from the waste incineration power plant. By adjusting the proportion of the flue gas entering the reaction tower and the flue gas storage device, the energy demand of the flue gas treatment can be shifted in time and space to realize the dynamic flue gas treatment at different time scales.
The amount of flue gas generated by waste incineration power generation can be expressed as:
where
In addition to the energy consumption of flue gas treatment, there is energy consumption of the air pump in the filling and deflating behavior of the flue gas and the gas storage tank. The total energy consumption of flue gas treatment in waste incineration power plants can be expressed as:
where
In the CCGPP-P2G-WD cooperative operation mode, the CO2 emitted by CCGPP-WD provides P2G with hydrogen methanation raw materials, and P2G-WD provides CCGPP with natural gas as fuel to realize the electricity-carbon-electricity cycle process.
During the working process of carbon capture gas power plants, carbon capture energy consumption is very high. In this paper, the carbon capture gas-fired power plant adopts the solution storage operation mode, and its specific operation mode and electric carbon characteristics refer to reference (Chen et al., 2012). The CCGPP power generation process is decoupled from the CO2 absorption process by introducing a solution reservoir. The spatiotemporal shift of the energy demand of CCGPP-P2G is achieved, and the rate of CO2 absorption and desorption is controlled.
The total amount of CO2 captured by CCGPP-P2G at the moment is:
where
The total amount of CO2 consumed by P2G at time t is:
where
The gas production of P2G at time t is:
where
The total energy consumption of CCGPP-P2G at time t is:
where
The net output of CCGPP and net CO2 emissions at time t are:
where
Load demand response is an important zero-carbon resource, which can optimize the low-carbon performance of the mining system through source-load coordination and has good dispatchability (Wei et al., 2018). The main loads in the park include: smart users, small industrial loads, commercial loads and electric vehicles. Under the limitation of the scope of the park, the energy demand of electric vehicles is high, the battery capacity is small, and the scale of cluster operation is insufficient. This paper does not consider electric vehicles to discharge the grid. Smart users can adjust energy consumption behavior according to changes in electricity prices and reduce energy demand. The energy consumption period of small industrial loads is flexible, and the energy consumption period can be shifted. Commercial loads have a large energy demand. In addition to rigid demand response resources such as lighting, elevators and computers, flexible loads such as air conditioning and energy storage in commercial buildings can be mobilized to participate in the demand response to effectively improve the multiple regulation capacity of the park and reduce the peak-valley difference of load curves (Gao et al., 2019).
The types of demand response are divided into price demand response and incentive demand response. Price-based demand response guides users’ energy consumption behavior through electricity prices, and the participants are mainly translatable loads (Wang et al., 2021d). Incentive demand response restricts users’ energy consumption behavior through contracts, and the participants are mainly interruptible loads (He et al., 2019). Responding to changes in energy prices through load reduction and translation can match the energy demand of the park and promote the level of renewable energy consumption. The NZCP load demand response model is as follows:
where i is the load type, that is, the electrical load, the thermal load, and the gas load respectively, k is the area type, residential area, small industrial area, commercial area and electric vehicle, respectively,
The proposed NZCP takes the CCGPP-P2G-WD collaborative energy supply system as the core, takes wind power generation and photovoltaic power generation as the main energy supply methods, and realizes the conversion of various energy sources through P2G, CCGPP and Electric Boiler (EB), supplemented by the coordination of electricity storage, heat storage and gas storage devices.
The energy coupling matrix is used to describe the multi-energy conversion, storage and distribution relationship of NZCP:
where
In this paper, the NZCP optimal scheduling model considering the coordination of WD and CCGPP is established. Its essence is to realize carbon recycling through ccGPP-P2G-WD cooperative mode on the basis of considering the waste treatment and carbon reduction requirements of the park, and form a comprehensive energy system with near zero carbon emissions. The optimal goal of minimum net operating cost of the system was established, and the decision variables included total CCGPP output, WD equivalent output, P2G output, EB output, carbon capture energy consumption, flue gas treatment energy consumption, transfer load of demand response, interruption load of demand response and energy purchase from the main network.
where
(1) Power balance constraints:
where
(2) CCGPP operating constraints:
where
(3) WD operating constraints:
WD includes waste incineration power plants and manure treatment facility. The operation constraints of waste incineration power plants are:
where
The operation constraints of manure treatment equipment are:
where
(4) EB output and climbing constraints:
where
(5) EB output and climbing constraints:
where
(6) Energy storage device operating constraints:
where
NZCP is powered by all renewable energy sources, but wind power, photovoltaic power and multiple loads have strong uncertainties. According to the traditional polyhedral uncertainty set form, the uncertainty factors are expressed as (Sun et al., 2020):
where
After the polyhedron uncertainty set is established, the model changes from a single stage to a two-stage model, and Eq. 16 is transformed into the following two-stage robust hybrid optimal scheduling model:
where x is the first-stage optimization variable, corresponding to the start-stop state of each controllable device, the start-up state of the equipment is 1, and the stop state is 0, y and z is the second-stage optimization variable, representing the output, wind, and load uncertain variables corresponding to each equipment respectively, c and b is the coefficient matrix corresponding to the objective function, A, B, C, M, N and Q are a sparse matrix of variables under the corresponding constraints, h, d, u and q are constant column vector.
The established NZCP two-stage robust optimal scheduling model decomposes the two-stage problem into the first-stage main problem and the second-stage sub-problem. The main problem is to optimize the start-stop state of each controllable device at each time period under extreme conditions of wind and solar output and original load. The sub-problem is based on the optimization scheme obtained from the main problem, and the output of each equipment in the NZCP is adjusted according to the uncertain variables of wind power, photovoltaic power generation and load to achieve the optimization goal of minimum net cost.
The C&CG algorithm is used to decompose the above two-stage robust optimal scheduling model into a main problem and sub-problems (Liu et al., 2018). The main problem is:
where k is the current iteration number,
The sub-problems is:
In a given scenario, the inner min problem is a second-order cone programming problem, which is obtained by combining dual theory with the outer max problem:
When Fq. 56 takes the maximum value, the value of the uncertain variable z should be at the boundary of the uncertainty set fluctuation interval established in this paper (Wang et al., 2019). At the same time, when the wind and solar output is at the lower limit and the load is at a peak, the system operating cost is the highest, that is, in an extreme scenario, which can be expressed as:
where
where
After the above derivation and transformation, the two-stage robust optimization scheduling model is finally decoupled from the main problem (52) and the sub-problem (59), and then solved by the C&CG algorithm, in which the sub-problem can be solved by calling the Cplex solver on the Matlab platform, the algorithm flow is shown in Figure 2. CCGPP carbon emission intensity a; P2G-CCGPP fixed energy consumption b; carbon emission allowance price c.
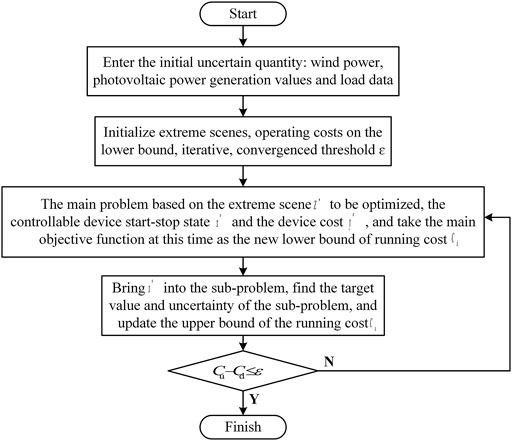
FIGURE 2. Algorithm flow chart.
The simulation analysis is based on the operation data of the Park Integrated Energy System in a region of northern China. In NZCP, the forecast curves of wind power and photovoltaic power generation are shown in Figure 3; The daily load forecast curve is shown in Figure 4; the energy price forecast curve is shown in Figure 5; the operating parameters of the energy conversion equipment and energy storage equipment are shown in Table 1; The daily load forecast curve is shown in Figure 4; the energy price forecast curve is shown in Figure 5; the operating parameters of the energy conversion equipment and energy storage equipment are shown in Table 1; CCGPP carbon emission intensity
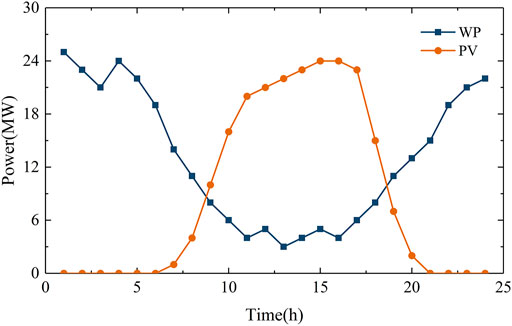
FIGURE 3. Forecast curve of wind power and photovoltaic power generation.
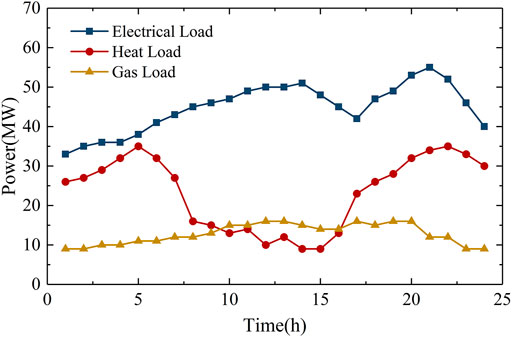
FIGURE 4. Forecast curve of wind power and photovoltaic power generation.
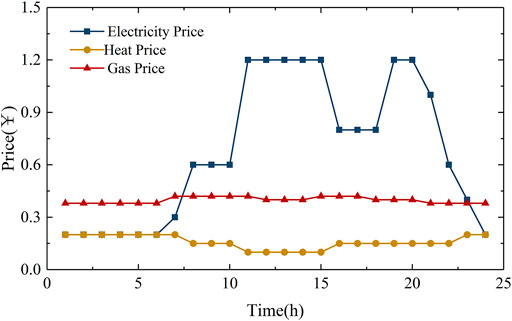
FIGURE 5. Forecast curve of electricity, heat and gas prices.
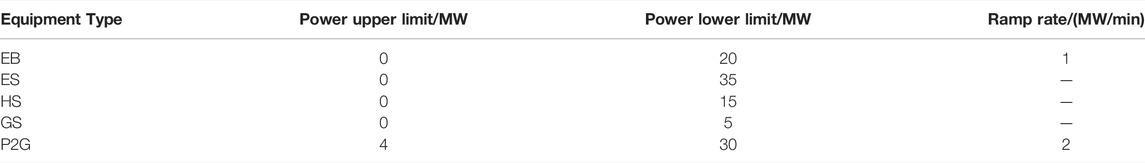
TABLE 1. Operating parameters of energy conversion equipment and energy storage equipment.
In order to verify the effectiveness of the proposed CCGPP-P2G-WD collaborative model and the NZCP two-stage robust optimal scheduling model, the following four scenes are set up to simulate and analyze the optimal model proposed in this paper:
Scene 1. Only P2G is considered to participate in the coordinated operation of the park’s comprehensive energy system, and all energy shortages are purchased from the external network.
Scene 2. WD is added On the basis of Scene 1, but the synergy between its energy transfer characteristics and the comprehensive energy system of the park is not considered.
Scene 3. CCGPP is added on the basis of Scene 1, but the synergy between its energy transfer characteristics and the comprehensive energy system of the park is not considered.
Scene 4. Adopt the proposed CCGPP-WD-P2G collaborative operation mode, and use the proposed operation strategy to coordinate and optimize with the park’s comprehensive energy system.On the basis of meeting the NZCP load requirements, the multi-energy optimization operation effect of each device in Scene 4 is shown in Figures 6–8.In Scene 4, the CCGPP-WD-P2G collaborative mode provides certain energy support for the power grid, heat grid, and gas grid. Combined with the forecast curve of electricity, heat and gas load of renewable energy, it can be seen that in the period of 16–18 and 23–6, the system is in a low period of electricity consumption, and the power generation of renewable energy cannot be fully absorbed. Because of the introduction of a flue gas storage device, the high energy consumption of flue gas treatment of WD provides a way to absorb abandoned wind. At the same time, CCGPP transfers the energy consumption of carbon capture during the peak period of energy consumption to the period of low load by introducing solution storage, which further absorbs the abandonment of wind and light on the basis of ensuring the reliability of energy supply during the peak period. Then, the CO2 captured by CCGPP is used as the raw material in the P2G production process, and the waste electricity is fully absorbed by P2G. It can be seen from Figure 5 that the electricity price at this time is relatively low. On the basis of fully absorbing the abandoned wind and solar energy, the electricity storage equipment is charged by purchasing energy from the external network to adjust the load peak period.During the period of 7–10, the output of wind power decreases. It can be seen from Figures 6–10 that CCGPP-WD is the main power source at this time. At the same time, the energy consumption of carbon capture and flue gas treatment is transferred to the load trough period, which improves the energy supply efficiency of CCGPP-WD. The heat load demand is low, and the heat energy provided by the CCGPP-WD is stored by the heat storage device. During the 18-6 period, the heat load is at the peak period, and the heat storage device cooperates with CCGPP-WD and EB to supply energy for the heat load.The manure treatment equipment in WD obtains natural gas by purifying biogas, and P2G converts electricity into natural gas through CO2 captured by CCGPP as a raw material. These two types of gas sources provide natural gas for CCGPP. The gas shortfall is purchased from the mainnet.Combining Figures 6–8, it can be seen from the optimized load curve that, compared with the load prediction curve before optimization, the load peak-to-valley difference in Scene 4 is smaller. Therefore, the CCGPP-WD-P2G cooperative mode realizes load shaving peaks and valleys.From Figures 9, 10, it can be seen that during the period 10–16, the output of photovoltaic power generation is mainly used for carbon capture and flue gas treatment. The volatility problem of photovoltaics is well resolved by the CCGPP-WD-P2G synergistic mode introduced into solution storage and flue gas storage devices.It can be seen from Figure 11 that in Scene 1, P2G and energy storage devices are limited by capacity constraints and ramp rate constraints, resulting in a large amount of power abandonment, and the power abandonment rate reaches 40.19%. In Scene 2, the WD flue gas treatment process consumes a certain amount of abandoned wind and light, and the abandoned electricity rate is 24.19%. In Scene 3, the carbon capture process of CCGPP absorbs a lot of abandoned wind and light, and the electricity abandonment rate is 16.57%. Scene 4 adopts the CCGPP-WD-P2G collaborative mode to shift the energy consumption of carbon capture and flue gas treatment in time and space, and mainly uses abandoned wind and sunlight for energy supply, so the system has the strongest ability to absorb renewable energy in this scene, the power abandonment rate is only 5.33%. It can be seen that the CCGPP-WD-P2G collaborative mode improves the renewable energy consumption capacity on the basis of ensuring the balance of energy supply and demand in the system. The optimization results of each unit cost and total net cost of the four scenes proposed in this paper are shown in Table 2. Compared with Scene 1, the introduction of WD reduces the cost of electricity purchase by 7.96×10³ ¥, the heating cost of 6.29×10³ ¥ and the gas purchase cost of 5.79×10³ ¥, and the total cost is reduced by 3.72×10³ ¥. Combining with Table 2 and Figure 12, it can be seen that although WD provides energy support for the power grid, heat grid and gas grid in the process of realizing waste reduction, the carbon emission increases by 64.47%. Compared with Scene 1, in Scene 3, the electricity purchase cost is reduced by 23.03×10³ ¥, the heat purchase cost is reduced by 10.33×10³ ¥, and the gas purchase cost is increased by 8.99×10³ ¥. It can be seen that CCGPP provides a certain energy support for the system, but the gas source in the system is insufficient, which increases the cost of gas purchase. Combined with Table 2 and Figure 12, it can be seen that after the introduction of CCGPP, carbon emissions were reduced by 41.83% through carbon capture and carbon sequestration. Combining Table 2 and Figures 11, 12, it can be seen that Scene 4 adopts the CCGPP-WD-P2G collaborative mode proposed in this paper, which reduces the cost of electricity purchase by 42.78×10³ ¥, the cost of sufficient heat by 13.49×10³ ¥ and 2.84×10³ ¥ gas purchase cost. It can be seen that carbon capture provides P2G with a large amount of CO2 as a raw material for gas production, which saves gas purchase costs and P2G operating costs. Because carbon capture and carbon sequestration technology reduces carbon emissions, NZCP’s participation in carbon emission allowance trading increases revenue by 9.724×10³ ¥, which in turn reduces the total cost by 27.03×10³ ¥. At the same time, the absorbing capacity of renewable energy has been increased by 86.73%, and the carbon emission has been reduced by 98.33%, which has improved the absorbing capacity of renewable energy, and achieved the goal of near-zero carbon emission while maintaining a high energy balance in the system.According to Figure 13, it can be seen that the load that can be reduced and the load that can be shifted can affect the net cost. It can be seen that with the increase of the proportional coefficient of demand response, the operating cost of the system is gradually reduced. When the proportional coefficient of the demand response of the shiftable load is 0.3 and the proportional coefficient of the demand response of the curtailable load is 0.2, the operating cost of the system is the lowest. With the gradual increase of the proportional coefficient of the translatable load demand response, the operating cost of the system also increases gradually. Therefore, an appropriate proportion of loads participating in demand response is beneficial for multi-time-scale energy regulation of NZCP. However, an excessively high load demand response proportional coefficient will lead to an increase in energy regulation compensation, and at the same time, it will affect the normal operation of small industrial loads and commercial loads in the park, and reduce system benefits.
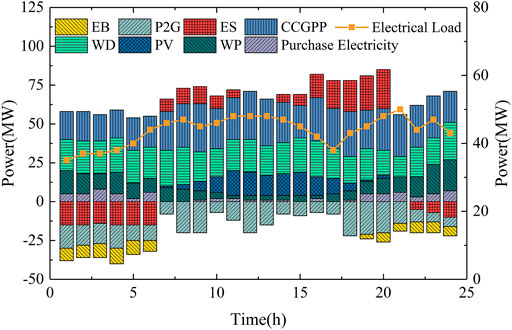
FIGURE 6. Power balance curve of Scene 4.
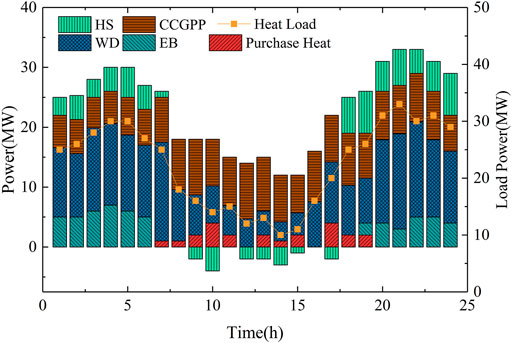
FIGURE 7. Thermal balance curve of Scene 4.
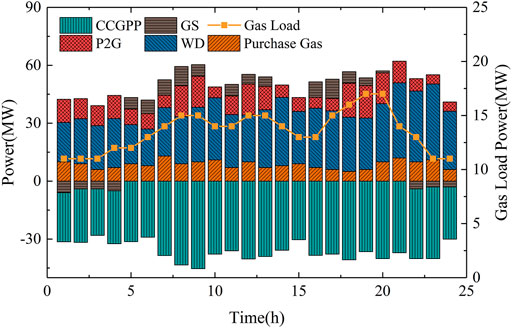
FIGURE 8. Gas balance curve of Scene 4.
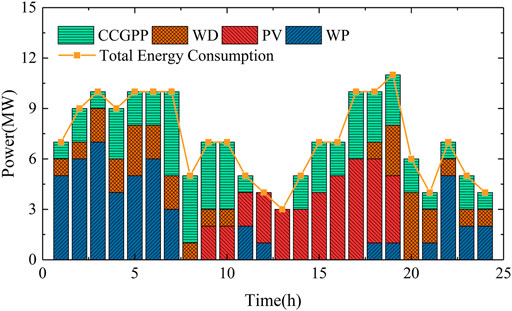
FIGURE 9. Carbon capture energy consumption curve.
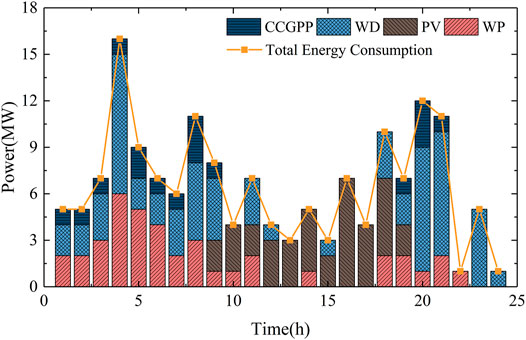
FIGURE 10. Flue gas treatment energy consumption curve.
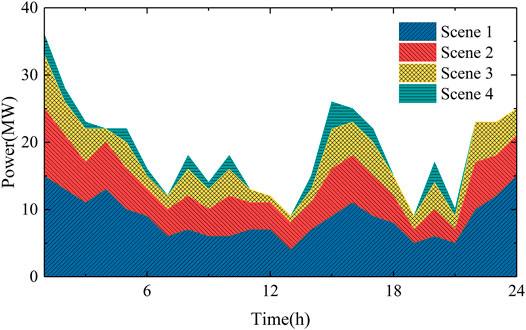
FIGURE 11. Wind power and photovoltaic power curtailment in various scenes.
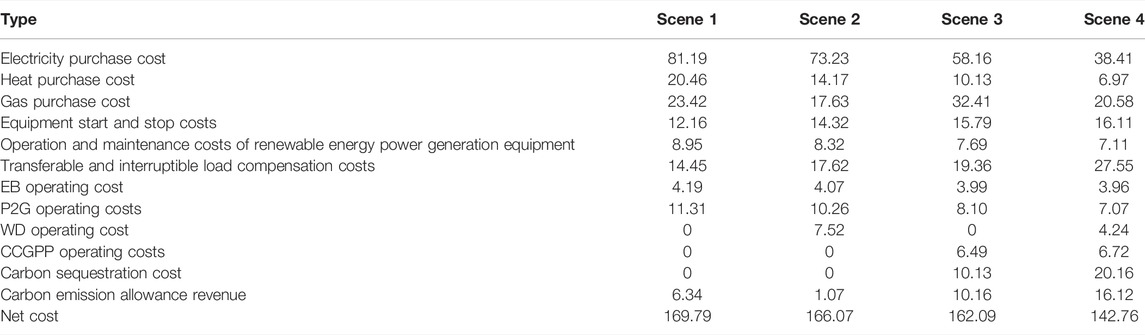
TABLE 2. Comparison of optimization results in different scenes (*103¥).
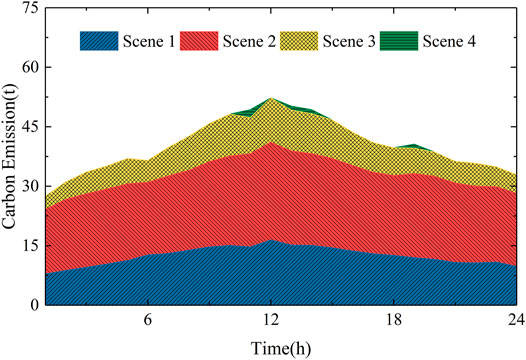
FIGURE 12. Carbon emissions in each scene.
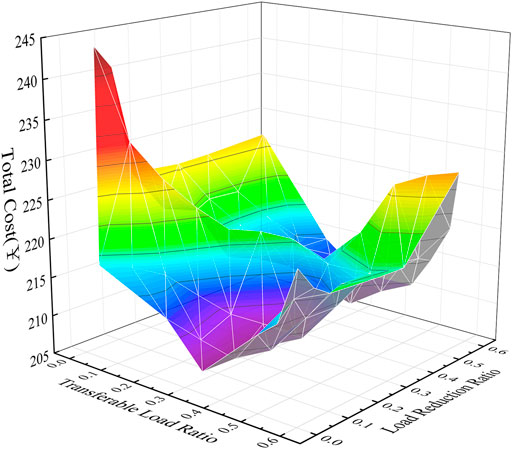
FIGURE 13. The relationship between demand response load proportional coefficient and cost.
In order to fully dispatch zero-carbon resources, form a production system for carbon recycling, and achieve near-zero carbon emissions while improving system revenue. In this paper, the CCGPP-WD-P2G collaborative model is proposed on the basis of full renewable energy supply, which realizes the collaborative optimization of zero-carbon resources in the park. Four groups of scenes were proposed and compared, and the following conclusions were drawn:
1) The CCGPP-WD-P2G collaborative mode is proposed to participate in the optimal scheduling of NZCP, which makes full use of the adjustment ability of zero-carbon resources in the system and improves the economy of the system maintaining a high energy balance level.
2) In the CCGPP-WD-P2G collaborative mode, the captured CO2 is used as the raw material for P2G gas production, which reduces carbon emissions while reducing the operating cost of P2G, and provides gas source support for CCGPP, realizing the recycling of CO2.
3) The flue gas storage device and the CO2 solution storage device are respectively introduced to decouple the flue gas treatment link, the carbon capture link and the power generation link, and the renewable energy output is shifted in time and space. The load peak-valley curve is effectively stabilized, the renewable energy consumption capacity is improved, and the energy supply pressure on the upper energy grid is reduced.
4) A reasonable proportion of interruptible loads and transferable loads can be used to participate in scheduling, which can effectively reduce the net cost of system operation and improve the flexibility of energy supply and demand in the system.
The raw data supporting the conclusion of this article will be made available by the authors, without undue reservation.
ZY was responsible for the modeling and writing work of the paper. TZ was responsible for the main idea of the paper. YZ was responsible for the simulation part.
This work was supported by Key R&D Program of Liaoning Province (2020JH2/10300101), Liaoning Revitalization Talents Program (XLYC1907138) and Key R&D Program of Shenyang (GG200252).
The authors declare that the research was conducted in the absence of any commercial or financial relationships that could be construed as a potential conflict of interest.
All claims expressed in this article are solely those of the authors and do not necessarily represent those of their affiliated organizations, or those of the publisher, the editors, and the reviewers. Any product that may be evaluated in this article, or claim that may be made by its manufacturer, is not guaranteed or endorsed by the publisher.
Cao, W., Wang, Z., Huang, J., Wu, B., Tai, J., Zhao, J., et al. (2020). Disposal Pattern of Municipal Solid Waste and Influencing Factors: Based on Data of 134 Countries [J]. Acta Sci. Circumstantiae 40 (8), 3062. doi:10.13671/.hjkxxb.2020.0044
Chen, Q. J. Z., Kang, C., and Ming, H. (2012). Analysis on Relation Between Power Generation and Carbon Emission of Carbon Capture Power Plant in Different Operation Modes[J]. Automation Electr. Power Syst. 36 (18), 109r. doi:10.3969/j.issn.1000-1026.2012.18.020
Cheng, Y., Du, E., Tian, X., Zhang, N., and Kang, C. (2020). Carbon Capture Power Plants in Power Systems: Review and Latest Research Trends[J]. J. Glob. Energy Interconnect. 3 (4), 33. doi:10.19705/j.cnki.issn2096-5125.2020.04.003
Cui, Y., Zeng, P., Wang, Z., Wang, M., Zhang, J., and Zhao, Y. (2021b). Low-Carbon Economic Dispatch of Electricity-Gas-Heat Integrated Energy System with Carbon Capture Equipment Considering Price-Based Demand Response[J]. Power Syst. Technol. 45 (2), 447. doi:10.13335/j.1000-3673.pst.2020.0100a
Cui, Y., Zeng, P., Wang, Z., Wang, M., Zhang, J., and Zhao, Y. (2021a). Multiple Time Scales Scheduling Strategy of Wind Power Accommodation Considering Energy Transfer Characteristics of Carbon Capture Power Plant[J]. Proc. CSEE 41 (3), 946. doi:10.13334/j.0258-8013.pcsee.200120
Fang, S., Zhou, R., Xu, F., Feng, J., Cheng, Y., and Li, B. (2020). Optimal Operation of Integrated Energy System for Park Micro-Grid Considering Comprehensive Demand Response of Power and Thermal Loads[J]. Proc. CSU-EPSA 32 (1), 50. doi:10.19635/j.cnki.csu-epsa.000217
Gao, S., Zou, Z., and Liu, Y. (2019). Coordination and Optimization of Combined Heat and Power System Considering Multi-Type Demand-Response Load[J]. Electr. Power Constr. 40 (10), 9. doi:10.3969/j.issn.1000-7229.2019.10.002
He, C., Zhang, X., Liu, T., and Wu, L. (2019). Distributionally Robust Scheduling of Integrated Gas-Electricity Systems with Demand Response. IEEE Trans. Power Syst. 34 (5), 3791–3803. doi:10.1109/tpwrs.2019.2907170
Hu, X., Zhang, H., and Ma, D. (2021). A tnGAN-Based Leak Detection Method for Pipeline Network Considering Incomplete Sensor Data. IEEE Trans. Instrum. Meas. 70 (1-10), 3510610. doi:10.1109/tim.2020.3045843
Jiang, M., Cheng, G., and Zhao, J. (2021). Research on the Improvement of DDPG Multifunctional Industrial Park Typical Daily Scheduling[J/OL]. Power Syst. Technol., 1. doi:10.13335/j.1000-3673.pst.2021.0998
Liu, Y., Guo, L., and Wang, C. (2018). Economic Dispatch of Microgrid Based on Two Stage Robust Optimization[J]. Proc. CSEE 38 (14), 4013
National Development and Reform Commission (2022). National Energy Board. Notice on Printing and Distributing the “14th Five-Year Plan for Modern Energy System”[EB/OL]. https://www.ndrc.gov.cn/xwdt/tzgg/202203/t20220322_1320017.html?code=&state=123.
Sun, K., Zhang, Q., Wang, L., Li, H., Lu, M., and Hu, Z. (2020). Two-Stage Robust Planning for Microgrid Considering Security Margin. Power Syst. Technol. 44 (12), 4617. doi:10.13335/j.1000-3673.pst.2020.0292a
Teng, Y., Sun, P., Hui, Q., and Chen, Z. (2021). Optimal Operation Model of Micro-Energy Network Considering Classification and Disposal of Biomass Waste. [J]Automation Electr. Power Syst. 45 (15), 55. doi:10.7500/AEPS20200726003
Wang, R., Sun, Q., Hu, W., Li, Y., Ma, D., and Wang, P. (2021c). SoC-Based Droop Coefficients Stability Region Analysis of the Battery for Stand-Alone Supply Systems with Constant Power Loads. IEEE Trans. Power Electron. 36 (7), 7866–7879. doi:10.1109/tpel.2021.3049241
Wang, R., Sun, Q., Ma, D., and Liu, Z. (2019). The Small-Signal Stability Analysis of the Droop-Controlled Converter in Electromagnetic Timescale. IEEE Trans. Sustain. Energy 10 (3), 1459–1469. doi:10.1109/tste.2019.2894633
Wang, R., Sun, Q., Tu, P., Xiao, J., Gui, Y., and Wang, P. (2021a). Reduced-Order Aggregate Model for Large-Scale Converters with Inhomogeneous Initial Conditions in DC Microgrids. IEEE Trans. Energy Convers. 36 (3), 2473–2484. doi:10.1109/tec.2021.3050434
Wang, Z., Teng, Y., Hu, H., and Chen, Z. (2021d). Multi-Energy System Optimal Model in Consideration of Coordinate Disposal of Power Grid and Gas Network and Waste[J]. High. Volt. Eng. 47 (1), 63. doi:10.13336/j.1003-6520.hve.20201329
Wang, Z., Teng, Y., Hui, Q., and Chen, Z. (2021b). A Sustainable Development Multi-Energy System Planning Method Incorporating the Demand of Waste Disposal and Peak Shaving[J]. Proc. CSEE 41 (11), 3781. doi:10.13334/j.0258-8013.pcsee.201021
Wei, C., Xu, J., Liao, S., Sun, Y., Jiang, Y., Ke, D., et al. (2018). A Bi-Level Scheduling Model for Virtual Power Plants with Aggregated Thermostatically Controlled Loads and Renewable Energy. Appl. Energy 224, 659–670. doi:10.1016/j.apenergy.2018.05.032
Xv, J., Shi, J., Zhang, J., Hao, R., and Chen, Q. (2018). Bi-Level Optimization of Urban Integrated Energy System Based on Biomass Combined Heat and Power Supply[J]. Automation Electr. Power Syst. 42 (14), 23. doi:10.7500/AEPS20170817003
Yang, H., Xie, M., Huang, W., Zhang, M., Shi, B., Hong, Y., et al. (2021). Low-Carbon Economic Operation of Urban Integrated Energy System Including Waste Treatment[J]. Power Syst. Technol. 45 (9), 3545. doi:10.13335/j.1000-3673.pst.2020.1676
Zhang, H., Wang, L., Van herle, J., Maréchal, F., and Desideri, U. (2020). Techno-Economic Evaluation of Biomass-To-Fuels with Solid-Oxide Electrolyzer. Appl. Energy 270, 115113. doi:10.1016/j.apenergy.2020.115113
Zhong, W., Huang, S., Cui, Y., Xu, J., and Zhao, Y. (2020). W-S-C Capture Coordination in Virtual Power Plant Considering Source-Load Uncertainty[J]. Power Syst. Technol. 44 (9), 3424. doi:10.13335/j.1000-3673.pst.2019.1986
Zhou, C., Zheng, J., Jing, Z., Wu, Q., and Zhou, X. (2018). Multi-Objective Optimal Design of Integrated Energy System for Park-Level Microgrid[J]. Power Syst. Technol. 42 (6), 1687. doi:10.13335/j.1000-3673.pst.2018.0280
Zhou, R., Chen, Y., Yang, W., Wang, Y., Xu, J., and Zhu, J. (2019). Two-Stage Optimal Dispatching of Wind Power-Waste Incineration Virtual Power Plant with Flue Gas Storage Device[J]. Electr. Power 52 (2), 78. doi:10.11930/j.issn.1004-9649.201806147
Keywords: nearly zero carbon park, carbon capture gas-fired power plants, waste disposal, demand side response, two-stage robust optimization
Citation: Yao Z, Zhang T and Zhao Y (2022) Two-Stage Robust Optimal Scheduling of “Nearly-Zero-Carbon Park” Considering the Synergy of Waste Disposal and Carbon Capture Gas-Fired Power Plants. Front. Energy Res. 10:939110. doi: 10.3389/fenrg.2022.939110
Received: 08 May 2022; Accepted: 30 May 2022;
Published: 28 June 2022.
Edited by:
Qiuye Sun, Northeastern University, ChinaReviewed by:
He Ren, Northeast Electric Power University, ChinaCopyright © 2022 Yao, Zhang and Zhao. This is an open-access article distributed under the terms of the Creative Commons Attribution License (CC BY). The use, distribution or reproduction in other forums is permitted, provided the original author(s) and the copyright owner(s) are credited and that the original publication in this journal is cited, in accordance with accepted academic practice. No use, distribution or reproduction is permitted which does not comply with these terms.
*Correspondence: Tieyan Zhang, dHl6aGFuZzYyQDE2My5jb20=
Disclaimer: All claims expressed in this article are solely those of the authors and do not necessarily represent those of their affiliated organizations, or those of the publisher, the editors and the reviewers. Any product that may be evaluated in this article or claim that may be made by its manufacturer is not guaranteed or endorsed by the publisher.
Research integrity at Frontiers
Learn more about the work of our research integrity team to safeguard the quality of each article we publish.