 Zhihao Xu
 Chao Liu
- Department of Electrical Engineering, NanChang Institute of Technology, Nanchang, China
In a modern power system, to realize the safe operation of units and maintain the frequency stability of the power network, various means of frequency modulation can be adopted. However, there are some deficiencies in the real-time monitoring and assessment management of primary frequency modulation (PFM). To solve these problems, a PFM online monitoring and management method based on the “master–sub” control station model in a wide area measurement system (WAMS) is proposed as a control strategy to support frequency modulation of units and assist power network assessment. In the hybrid monitoring system strategy of the master control station and sub control station, the sub control station is built locally in the power plant to monitor the operational status of the unit in real-time and calculate the PFM assessment index. The master control station is built in the dispatching center, receiving the assessment data uploaded by the sub control station and sending the PFM simulation test instruction. This strategy can effectively improve the real-time performance of dynamic monitoring and parameter calculation, and reduce the probability of frame loss and communication instability in long-distance data transmission. The experimental results show that the PFM online monitoring management control strategy based on the “master–sub” control station model can effectively monitor the unit and provide data support for PFM assessment.
1 Introduction
Power network frequency is the key index to evaluate the safe operation and power quality of a power system. It reflects a balanced relationship of energy supply and demand between the generating side and user side of the power system (Bevrani et al., 2021; Zhang C. et al., 2022). When the planned load of generating units deviates from the actual load, the frequency of the power network will fluctuate, which will have a negative impact on the stable operation of the generating units and the quality of production and living electricity.
As global environmental problems become more salient, many countries have put forward and vigorously advocated renewable, pollution-free new energy generation. To respond to international calls and meet the increasing demand for electric power, renewable energy and power electronic equipment have been widely applied in the electric power industry (Harker Steele et al., 2021; Holjevac et al., 2021; Zhang Z. et al., 2022), and the power network’s capacity to absorb new energy power generation has also been continuously improved. However, because of some characteristic restrictions and technical limitations such as unstable output, poor controllability, and complex structure, new energy and power electronic equipment do not participate in conventional frequency regulation tasks temporarily, which will undoubtedly reduce the frequency support capacity of the power network in the same proportion (Zhao D. et al., 2019; Meegahapola et al., 2020; Ouyang et al., 2021). At present, when the PFM task of a power network still mainly depends on thermal power units, to ensure the safety and stability of the power network and the power quality of its supply, the power system has asked for higher requirements for the performance of the PFM (Liu et al., 2022).
To maintain the stability of the power network frequency and meet the requirements of PFM assessment, the existing reference mainly engages in the exploration, research, and performance optimization from the aspects of unit logic control, system structure transformation, characteristic curve analysis, and so on. Wang et al. (2018)and Meng et al. (2021) respectively use the features that the communication speed is greater than the disturbance propagation speed and the new PFM response evaluation index to improve the response speed of unit frequency modulation. Zhao Y. et al. (2019), Kim et al. (2020), and Song et al. (2020) have carried out studies on the introduction of battery energy storage, the transformation of a unit heat storage device, and the improvement of heat storage potential to analyze the impact of the transformed and optimized system for the performance of PFM. Delavari and Kamwa (2018), Li and Wang (2018), and Liu et al. (2019) are involved in the analysis and optimization of the frequency modulation characteristic curve in terms of frequency modulation dead time stability margin, system optimal load control, and system dynamic control performance, to improve the performance of PFM. Many reference studies have achieved good results in improving the performance of unit PFM and ensuring the frequency stability of the power network. However, there are few corresponding studies on how to monitor the frequency modulation process and assess the frequency modulation ability when applying optimization strategies. There are some shortcomings in monitoring and management.
Ma et al. (2012) and Gupta et al. (2019) adopted PMU data to monitor the PFM performance of the generator online, but it calls for high requirements for the communication rate and stability. Ashrafian and Mirsalim (2016) used an S-transform and IIR filter to calculate the phasor and frequency, which is beneficial to monitoring the condition of units. Guo et al. (2015), Liao et al. (2019), and Fan et al. (2021) have kept track of the phasor and frequency of the system, the valve opening of the steam turbine, and the broadband oscillation of the power network, respectively, but the monitoring of the whole PFM process is relatively less. The method proposed in the aforementioned reference plays a certain role in monitoring the PFM process of units. However, in the “double-high” power system environment, the real-time, effectiveness, and reliability of existing monitoring methods cannot meet the requirements of PFM monitoring management.
To guide power plants to optimize their PFM strategy and encourage them to improve their PFM performance, power network enterprises have launched several policy requirements for new frequency modulation management and auxiliary frequency modulation services in the market. In response to relevant policies and guidance, and to solve the problem of insufficient online monitoring and management of PFM, in this study, the control strategy of the PFM online monitoring management system based on the “master–sub” control station model is proposed to monitor the operating status of thermal power units in real-time, calculate PFM assessment parameters and analyze PFM performance, and upload the assessment parameters to the dispatching center in an attempt to provide data support for PFM assessment.
The structure of the rest of this study is organized as follows: Section 2 mainly introduces the basic principle of PFM and the classical control strategy. Section 3 puts forward the PFM monitoring and management model based on the “master–sub” control station. Section 4 uses this model to create the PFM monitoring and management system of the “master–sub” control station. Section 5 carries out the simulation test of the monitoring and management system. Section 6 is about the summary and prospect.
2 Conventional Primary Frequency Modulation Control Process
2.1 Principle of Primary Frequency Modulation
PFM process: when the frequency of the power network fluctuates, the unit will receive the frequency deviation signal, respond to the change in frequency quickly through the determined PFM control strategy and the corresponding PFM characteristic function, and adjust the unit output to regulate the frequency to go back to the frequency modulation dead band (Shen et al., 2015; Talaat et al., 2020). The specific adjustment method: when the actual frequency is higher than the rated frequency, it will reduce the unit output; when the actual frequency is lower than the rated frequency, it will increase the unit output.
To avoid frequent the operation of PFM, the frequency modulation dead band
where
where
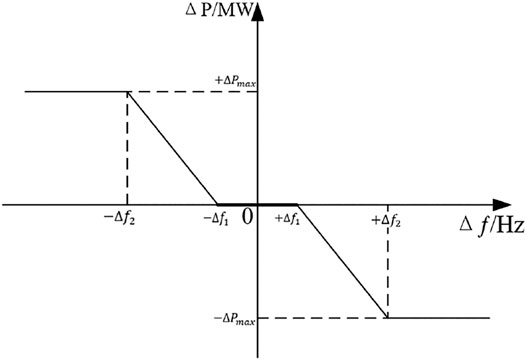
FIGURE 1. Corresponding relationship between frequency deviation and load adjustment.
2.2 Typical Primary Frequency Modulation Control Process
A digital electric hydraulic control system (DEH) and coordination control system (CCS) cooperate to complete the PFM process of the unit. As shown in Figure 2, when the frequency deviation signal exceeds the frequency modulation dead zone, after being processed by the frequency modulation function F(x), on the one hand, it is converted into the load adjustment amount through the speed unequal rate, which is superimposed with the load command of amplitude limiting and speed limiting, and then sent to the CCS side as the boiler control signal. On the other hand, it is sent to the DEH side as a frequency modulation feedforward signal to directly adjust the valve opening and the air intake of the steam turbine. The speed regulation system will respond to both the frequency deviation signal and the power deviation signal to stabilize the frequency deviation. The PFM control model of DEH + CCS is the most conventional frequency modulation model at present, and it is also the basis of most frequency modulation optimization control strategies (Kun et al., 2019).
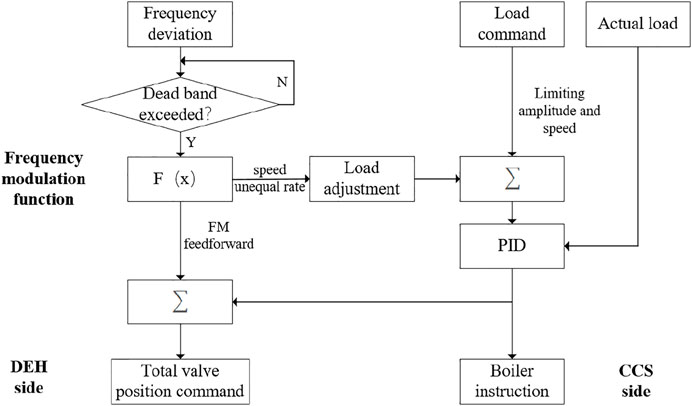
FIGURE 2. Typical PFM control process.
3 Primary Frequency Modulation Monitoring Management Control Strategy
To address the shortage of PFM monitoring and management, this study puts forward the control strategy of a PFM online monitoring and management system. The system based on this strategy is composed of a master control station system and sub control station system, which is dedicated to real-time PFM monitoring and assessment index calculation. In the WAMS, the sub control station system is placed locally in the power plant to analyze and calculate the real-time monitoring of unit status. The master control station system is located in the dispatching center, with a remote multi-party control and centralized dispatching management. Based on different functions, this study puts the sub control station on the power plant side and the master control station on the scheduling side. This “master–sub” control station PFM monitoring and management control strategy is called the PFM “master–sub” control station model.
3.1 Primary Frequency Modulation “Master–Sub” Control Station Model
The topological structure of the control strategy of the PFM online monitoring management system established under the WAMS is shown in Figure 3. The sub control station system is built in the local plant station, and the master control station system is built in the dispatching center. The characteristic signal containing unit information and unit control signal are hardwired to the sub control station system through the DCS. After gathering information, through analysis and calculation, the sub control station will display it on the man–machine interface and store the important information about the PFM process. The sub control station receives the control instructions specified by the master control station and also feeds back the controlled results to achieve information exchange. With the phasor data concentrator (PDC) as the communication intermediary, the master control station receives the assessment data and delivers analog frequency deviation data. The PFM assessment data are uploaded to the master control station system of the dispatching center to support the frequency modulation assessment of dispatching and improve the fairness and accuracy of the assessment.
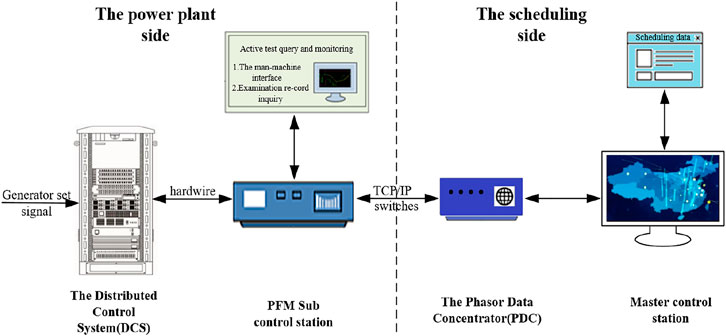
FIGURE 3. Topological diagram of the control strategy of the PFM monitoring and management system based on the “master–sub” control station.
This strategy does not need to transform the system structure and control logic of the original unit. There are two main differences from the existing control manners. 1) In terms of unit monitoring. The difference from the existing manners is that this model is dedicated to the monitoring and analysis of PFM. It directly monitors the unit signals from the DCS to analyze the unit operation status, calculate PFM evaluation parameters, ensure real-time online monitoring, and facilitate the power plant staff to monitor the unit operation status. 2) In terms of PFM assessment. Being different from the assessment method of PMU collecting data and uploading it to the dispatching center to calculate the assessment indicators, in the “master–sub” control station, an alternative method is adopted, that the sub control station is responsible for the local calculation, analysis, and storage and the master control station calls the calculation results. This strategy ensures that the basic data of assessment calculation are accurate and avoids common communication problems such as frame loss, network instability, and clock jump.
The PFM online monitoring and assessment management system based on the “master–sub” control station model has the following advantages:
(1) Pertinence. The dynamic monitoring and assessment management of the primary frequency modulation process are realized pertinently.
(2) Real-time. The sub control station is built locally in the plant, which is convenient for the plant staff to monitor the dynamic changes of the unit intuitively and in real-time to ensure the safe and stable operation of the unit.
(3) Homology. The basic data of this system and the data of the dispatching center are derived from the DCS. The basic assessment data have the same sources, which ensures the reliability of the assessment results of the monitoring and management system.
(4) Fault tolerance. Through the way that the sub control station analyzes and calculates data locally and the master control station receives the assessment results, the communication problems that are easy to occur in the mass data transmission are avoided. Even if the data received by the master station are wrong, it can call for retransmission without affecting the assessment calculation.
(5) Economy. After investigation and evaluation, rebuilding the master control station and the sub control station is better than transforming the existing PMU or RTU and other equipment in terms of economy and authority.
3.2 Primary Frequency Modulation Monitoring and Assessment of Important Parameters
3.2.1 Operating Status Monitoring Parameters
1) Real-time frequency: Frequency is one of the main parameters to monitor the operation state of the unit, which reflects the stability of the unit operation. In this study, the zero-crossing detection algorithm is used to calculate the unit frequency in real-time. Its basic principle is demonstrated in Figure 4.
where
where
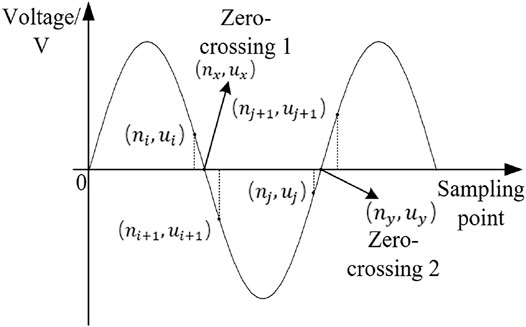
FIGURE 4. Schematic diagram of zero-crossing detection.
From the actual voltage value of the sampling point before and after zero-crossing point 1
2) Power: Power is always one of the important electrical quantities in a power system. Power can be divided into two parts: active power and reactive power. The calculation formulas are shown in Eqs 5, 6.
where
where
3.2.2 Assessment Parameters of Primary Frequency Modulation
1) Response time: It represents the period from the time of the real-time frequency signal crossing the PFM dead band to the time when the load changes in the same direction. The response time of a thermal power unit should be less than 3 s.
2) Stabilization time: It means that the minimum time when the difference between the amplitude of the load change and the amplitude of the frequency modulation target from the real-time frequency signal crossing the PFM dead band does not exceed ±5% of the amplitude of the frequency modulation target load. It will not exceed this range for a period of time. The stabilization time of the thermal power unit should be less than 60 s.
3) Contribution rate of PFM (Fu et al., 2020): It refers to the percentage of the actual and theoretical contribution of PFM, just as shown in Eq. 7.
where
where
where
4) PFM operation rate: It is the percentage of the monthly investment time (hours) of PFM and the monthly grid-connection operation time (hours) of the unit. It is calculated once a month.
5) PFM qualification rate: It is the percentage of the qualified time of the unit’s PFM in the present month and the total frequency regulation time of the PFM in the present month. It is calculated once a month.
4 “Master–Sub” Control Station System Configuration Strategies
The overall configuration strategy of the “master–sub” control station system is shown in Figure 5: the sub control station monitors the information of units; and the master control station manages the data of the sub control stations. By means of functional separation and organic management, the effective monitoring and management of the PFM process are achieved.
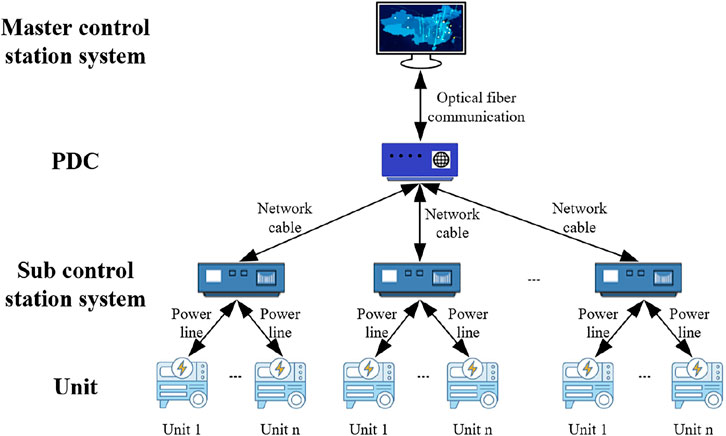
FIGURE 5. Schematic diagram of the general configuration of the PFM monitoring and management system.
4.1 Sub Control Station System Design and Resource Allocation Strategy
In the control strategy of the PFM online monitoring and assessment management system, the sub control station system is an important tool for dynamic monitoring of the unit running status. When frequency disturbance occurs in the power network, the sub control station system responds quickly and triggers online monitoring, assessment calculation, action recording, data storage, and other functions of PFM to provide information queries for the master control station system and data support for PFM assessment.
According to the signal characteristics of the unit, including signal type, signal size, and signal quantity, the sub control station system can allocate an appropriate acquisition module to ensure that the accuracy and sampling rate of the acquisition signal can meet the requirements. As shown in Figure 6, the input and output of the acquisition module are generally voltage signals, while the signals from the unit are of various types and sizes. Therefore, it is necessary to add adaptation modules, including a signal converter, AC drop voltage module, AC current limiting module, and boost voltage module, to adjust the signal of the unit and make it match the acquisition module. Finally, the collected data are processed, and then the processing results are used for analysis, display, and communication.
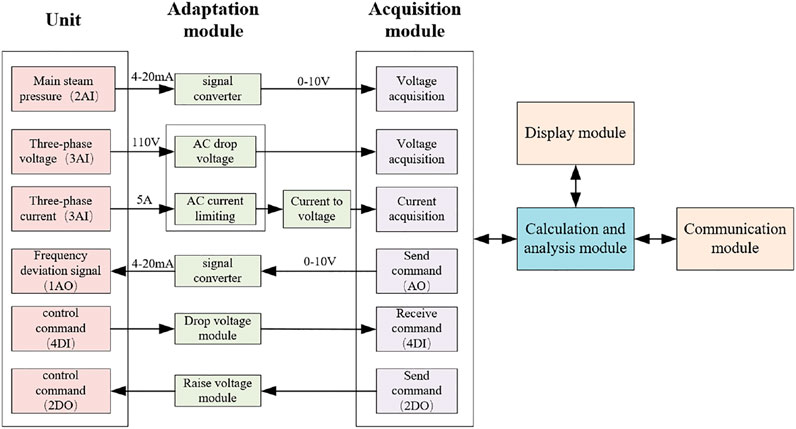
FIGURE 6. Block diagram of the sub control station system configuration.
Modularize the tasks undertaken by the sub control station system according to the functions shown in Figure 7, then allocate resources and develop corresponding system software programs. With the main control program as its core, the sub control station allocates various functional subroutines when the set conditions are triggered to realize the monitoring and management of the PFM process. The sub control station system starts and collects signals, and then calculates the characteristic parameters of the monitoring unit, including real-time frequency, active power, and reactive power. Based on the characteristic parameters, the sub control station system analyzes the working condition after combining with the collected control instructions and then determines the present operating state of the unit in accordance with the set conditions: normal operation, small disturbance, large disturbance, or simulation test. The sub control station system calculates and records the assessment parameters (including response time, stability time, contribution rate, qualification rate, and operation rate) of the PFM process (disturbance and simulation test) to provide data support for the scheduling assessment.
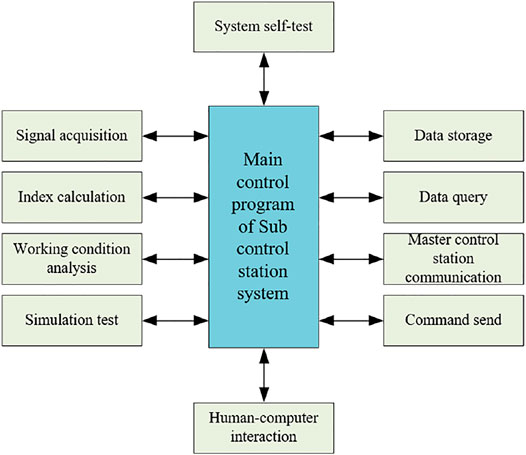
FIGURE 7. Functional block diagram of the sub control station system.
4.2 Master Control Station System Design and Resource Allocation Strategy
In this control strategy, the master control station system and the communication between the master and sub control stations are reformed on a small scale on the existing WAMS, which not only ensures the stability of the system, but also reduces the economic cost. After the master control station receives the data and ensures that the information is accurate, it will store the data in the master control station database for a quick call and access by the staff, providing data support for PFM assessment, and data sources for offline analysis and load modeling.
In the control strategy of the PFM monitoring and management system, the master control station system mainly undertakes the task of PFM assessment management and its system function configuration is shown in Figure 8. This strategy, the control model of the local calculation of the sub control station and the call result of the master control station, can effectively improve the real-time performance of the data, and completely avoid the problems of data loss and communication delay under the control model of PMU collecting basic data and uploading them to the dispatching center for calculation and analysis. At the same time, the monitoring and management system holds the function of a simulation test. Under appropriate conditions, the master control station sends the simulation test command, which is forwarded to the unit through the sub control station. After the unit enters the simulation test control logic, the master control station sends the simulated frequency deviation signal to the unit for the simulation test for the purpose of checking the PFM ability of the unit.
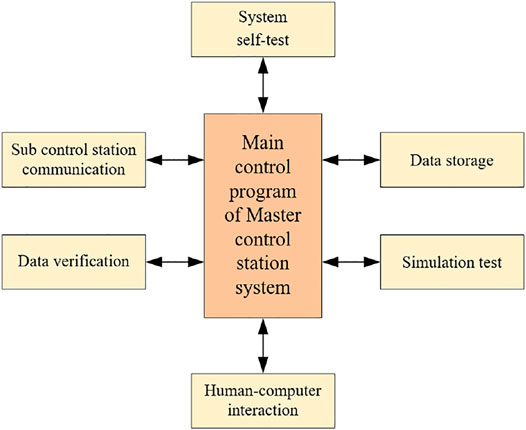
FIGURE 8. Functional block diagram of the master control station system.
5 Simulation Results and Analysis
In this study, the MATLAB/Simulink platform and the Speedgoat simulator are adopted to simulate the operation and response of the 600 MW supercritical unit. In the actual operation, the performance index and disturbance characteristics of PFM are quantitatively analyzed to guarantee that the precision and accuracy of monitoring results can meet the requirements, which verifies the effectiveness of the PFM monitoring management system for real-time dynamic monitoring and primary frequency modulation assessment calculation.
5.1 Primary Frequency Modulation Disturbance Decision
The main decisions used in this study to determine the operating status of thermal power units are demonstrated in Table 1. Through a simulation test command flag, they are divided into the conventional PFM test and the simulated PFM test.
(1) The simulation test command flag is 0, indicating that the unit is in the normal PFM state. When the frequency deviation is
(2) The simulation test command flag is 1, indicating that the unit is in the simulation test PFM state. When the unit has safe simulation test conditions for PFM and the master control station sends the simulation test command and frequency deviation signal, the unit will enter the simulation test logic (the simulation test includes small disturbance, large disturbance, and step signal). When
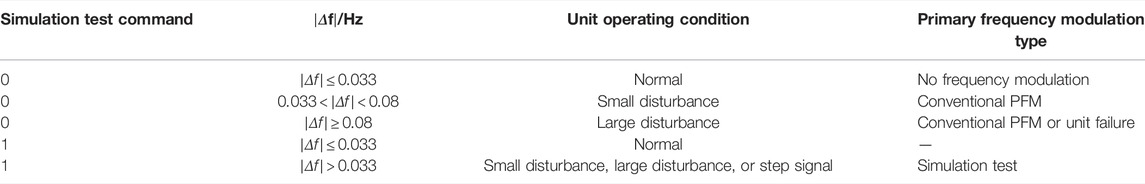
TABLE 1. Frequency disturbance decision table.
5.2 Accuracy Measurement of Power and Frequency
5.2.1 Accuracy Measurement of Active Power
The simulation unit outputs a three-phase voltage signal and a three-phase current signal under the output of 360 MW, measures the active power when the phase differences are −15°, 0°, 15°, and 45° (voltage leading current), and further calculates the accuracy of the active power to testify the good performance of the active power measurement of the PFM monitoring management system.
As shown in Figure 9 and Table 2, it sets different phase deviations to simulate the phase lag of the voltage and current when AC current passes through a capacitive load or inductive load, and measures and calculates the active power value and its accuracy. Under different phase deviations, the monitoring results of this study are compared with the DFT algorithm (Xie et al., 2016). It can be observed in the corresponding power accuracy that the greater the voltage and current phase difference is, the more difficult the measurement and the lower the accuracy of the measurement results will be.
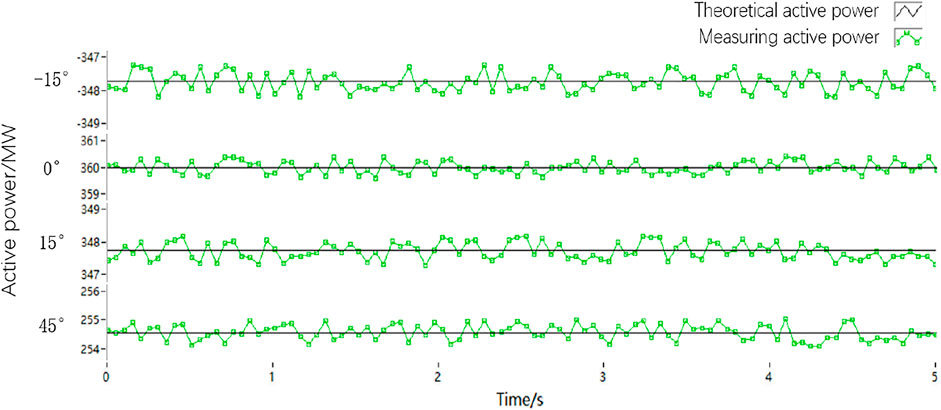
FIGURE 9. Active power measurement fitting.

TABLE 2. Maximum deviation of active power measurement.
5.2.2 Accuracy Measurement of Frequency
The PFM monitoring and management system collects high-precision three-phase voltage signals and calculates the real-time frequency through the frequency algorithm mentioned in this study. The AC voltage signals with frequencies of 49.7, 49.9, 50, 50.1, and 50.3 Hz are measured, and the frequency results measured in a short period of continuous time are intercepted and then fitted with the real frequency, as shown in Figure 10.
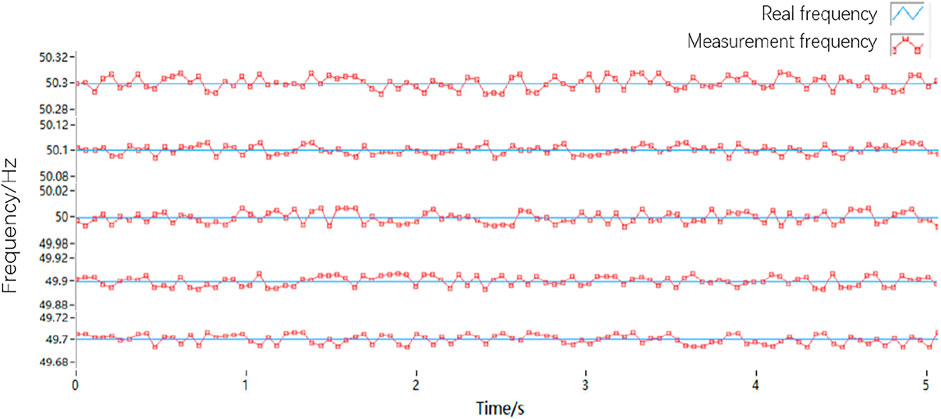
FIGURE 10. Frequency measurement fitting.
As shown in Figure 10 and Table 3, the test values are set at 49.7, 49.9, 50, 50.1, and 50.3 Hz around the rated frequency. By fitting the measured frequency with the real frequency, it can be seen that the measured values are scattered around the real value. Comparing the test results of the monitoring system with the results of the PM model (Vejdan et al., 2015), it can be seen that the frequency calculation in this study has high accuracy.

TABLE 3. Maximum deviation of frequency measurement.
5.3 Monitoring and Analysis of Frequency Disturbance Events
The actual data obtained from the unit and the DCS are used as the basic data of the simulation model to simulate the operation state of the unit to test the monitoring performance and evaluation parameter calculation ability of the PFM monitoring management system. The unit simulation model is applied to simulate the 600 MW unit, simulating the PFM action process of the unit when the frequency is disturbed under 360 MW output. Then the PFM monitoring and management system conducts real-time monitoring and calculation to analyze and compare the original data and testing data to attest the performance of the system. When the rated power network frequency is 50 Hz, the corresponding speed is 3,000 r/min.
5.3.1 Upward Disturbance Signal
Figure 11A shows the response of the unit and the PFM process when the power network frequency is an upward disturbance signal. In the range of 0∼4 s, the frequency is stable and the speed is maintained at 3,000 r/min. From 4 s, the network frequency is disturbed by external factors and continues to cross the frequency modulation dead band. The PFM logic of the unit is triggered at about 6 s, and then the unit output changes and the PFM begins. But the amplitude of frequency disturbance continues to rise and reaches the maximum at about 10 s. In the PFM process, the unit adjusts its output according to the frequency modulation function and strategy to rapidly respond to frequency changes and maintain the stability of the network frequency.
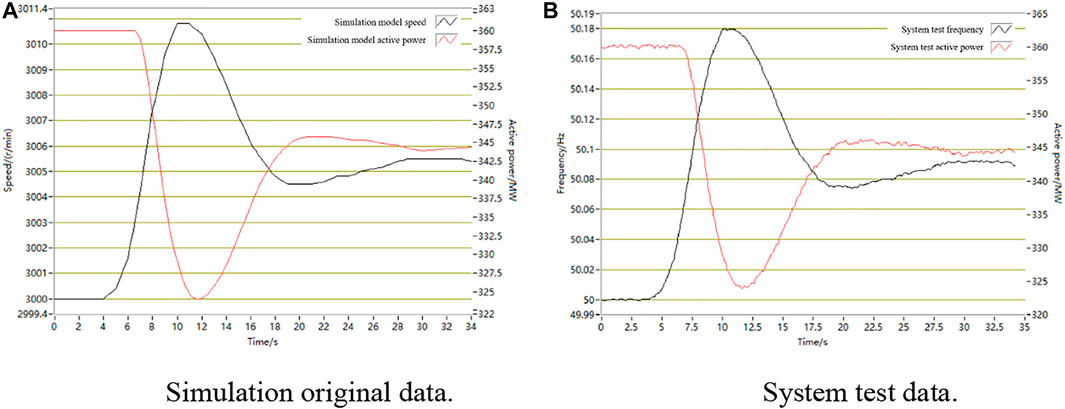
FIGURE 11. Upward disturbance test. (A) is the original data of the simulated unit, and (B) is the data monitored by the system. Through the comparison between (A) and (B), it is proved that the system can effectively monitor the unit.
Monitoring of the upward disturbance PFM process is shown in Figure 11B. The maximum deviation of frequency between the original data and test data is -0.0047 Hz, and the maximum deviation of active power is 0.449 MW. The dynamic changes in the frequency and active power can be correctly checked within the allowable error range. The comparison of PFM assessment parameters calculated from the data (original data and test data) of upward disturbance is shown in Table 4.
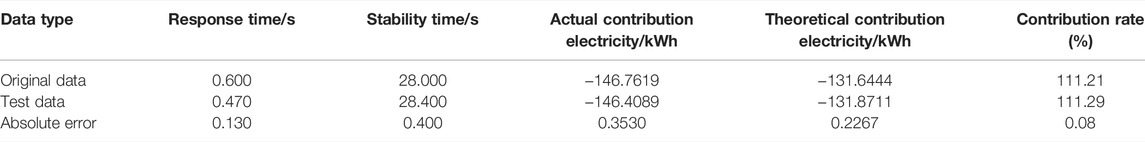
TABLE 4. PFM assessment parameter table of upward disturbance.
5.3.2 Downward Disturbance Signal
Figure 12A shows the response of the unit and the PFM process when the power network frequency is a downward disturbance signal. The analysis of the disturbance process is the same as shown in Figure 11A and will not be shown here. The downward disturbance monitoring situation is shown in Figure 12B. The maximum deviation of frequency between the original data and test data is −0.0031 Hz, and the maximum deviation of active power is 0.423 MW. The comparison of PFM assessment parameters calculated from the data (original data and test data) of downward disturbance is shown in Table 5.
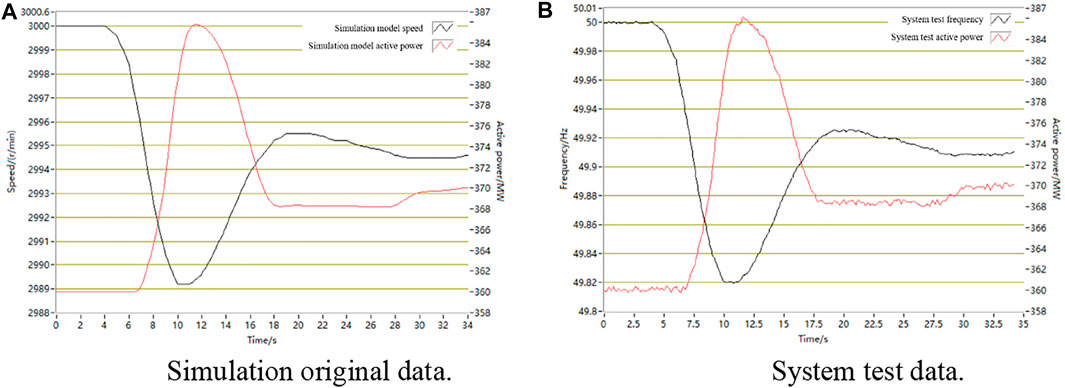
FIGURE 12. Downward disturbance test.
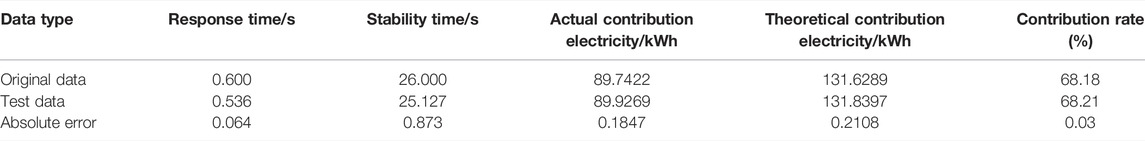
TABLE 5. PFM assessment parameter table of downward disturbance.
5.3.3 Simulation Test Step Signal
As shown in Figure 13A, during the simulation test of the PFM monitoring and management system, the analog frequency deviation signal (step signal −0.167 Hz) delivered by the master control station system is forwarded to the unit simulation model by the sub control station system. The speed of the simulation model changes dynamically with this deviation signal, as shown in Figure 13B. Compared with the conventional frequency disturbance, when the unit adjusts the output in response to the step signal, the active power curve rises obviously and rapidly in 10–12 s, and a buffer stage is formed in 12–13 s through the unit frequency modulation amplitude limit and other mechanisms. After 13 s, the unit output continues to grow to further adjust the frequency.
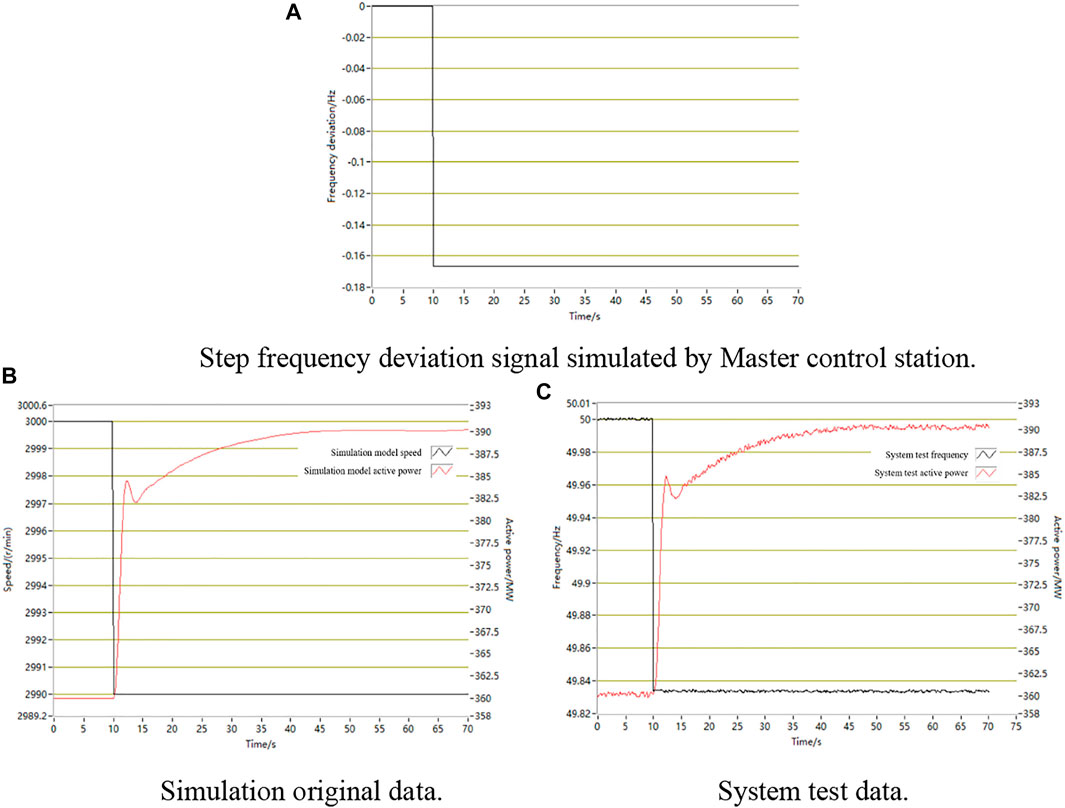
FIGURE 13. Step signal simulation test.
The unit model responds to the dynamic change of the deviation signal and executes the PFM accordingly. The monitoring results of the monitoring and management system are shown in Figure 13C. When the PFM process exceeds 60 s, the monitoring system only records the data in the first 60 s from the beginning of the disturbance and calculates the PFM assessment parameters within 60 s. The maximum deviation of frequency between the original data and test data is 0.0028 Hz, and the maximum deviation of active power is 0.502 MW. The comparison of PFM assessment parameters calculated from the data (original data and test data) of the step signal simulation test is shown in Table 6.
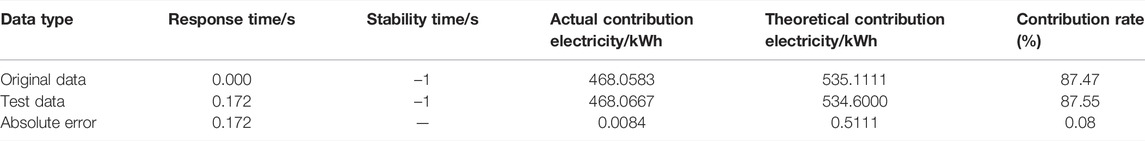
TABLE 6. PFM assessment parameter table of the step signal simulation test.
6 Conclusion
At present, the PFM online monitoring and assessment management system designed based on the aforementioned control strategy has completed the PFM simulation test and online monitoring test. The test results show that this system can effectively monitor the unit, calculate and analyze the PFM assessment index, and achieve the expected goal of the function of the system.
(1) Realizing dynamic monitoring of unit operation. Through the calculation of key parameters such as frequency and power, the operating state of the unit can be seen in real-time and dynamically. It gives data support for grasping the present situation of the unit and also provides data basis for determining whether the unit has the conditions and then carrying out the generator trip, maintenance, online testing, and other operations. It is of profound significance to ensure the safe and stable operation of the unit.
(2) Providing data support for PFM assessment. Based on the frequency, power, and other data, it can analyze the disturbance status of the power network, calculate assessment parameters such as response time, stability time, and contribution rate, and record the disturbance waveform. Through effective communication between the master control station and the sub control station, the dispatching center queries the parameters calculated during the disturbance to obtain the data support for the PFM assessment. It is of great significance to ensure the fairness and effectiveness of PFM assessment.
At present, under the “master–sub” control station model, this study only completes the routine monitoring, simulation test, and assessment calculation of the unit, but the characteristic analysis and parameter identification of the unit still need to be further studied. Moreover, the research object of this study is only thermal power units. The “master–sub” control station model also has broad application prospects for hydropower, wind power, and other energy units. However, because of the different temporal and spatial characteristics and power generation mechanisms of different energy sources, it also needs to be studied carefully if it is to be popularized.
Data Availability Statement
The raw data supporting the conclusion of this article will be made available by the authors, without undue reservation.
Author Contributions
ZX and CL completed the overall design and planning of this study. ZX and CL analyzed the data of this study. ZX, CL, and ZS jointly wrote the first draft. All authors participated in the revision of this manuscript.
Conflict of Interest
The authors declare that the research was conducted in the absence of any commercial or financial relationships that could be construed as a potential conflict of interest.
Publisher’s Note
All claims expressed in this article are solely those of the authors and do not necessarily represent those of their affiliated organizations, or those of the publisher, the editors, and the reviewers. Any product that may be evaluated in this article, or claim that may be made by its manufacturer, is not guaranteed or endorsed by the publisher.
Acknowledgments
The authors acknowledge these supports gratefully.
References
Ashrafian, A., and Mirsalim, M. (2016). On‐line Recursive Method of Phasor and Frequency Estimation for Power System Monitoring and Relaying. IET Gener. Transm. & Distrib. 10 (8), 2002–2011. doi:10.1049/iet-gtd.2016.0007
Bevrani, H., Golpîra, H., Messina, A. R., Hatziargyriou, N., Milano, F., and Ise, T. (2021). Power System Frequency Control: An Updated Review of Current Solutions and New Challenges. Electr. Power Syst. Res. 194, 107114–114. doi:10.1016/J.EPSR.2021.107114
Delavari, A., and Kamwa, I. (2018). Improved Optimal Decentralized Load Modulation for Power System Primary Frequency Regulation. IEEE Trans. Power Syst. 33 (1), 1013–1025. doi:10.1109/tpwrs.2017.2708058
Fan, C., Yao, J., Chang, N., Xu, C., and Yu, Y. (2021). Technical Scheme for Real-Time Monitoring of Wide-Frequency Oscillation in Power Grid. Automa. Electr. Power Syst. 45 (11), 152–159. doi:10.7500/AEPS20200728005
Fu, L., Wei, J., Huang, B., and Li, L. (2020). Study on Factors of Influence on Electricity Contribution of Primary Frequency Modulation of Hydropower Unit. Water Resour. Hydropower Eng. 51 (8), 103–110. doi:10.13928/j.cnki.wrahe.2020.08.013
Guo, Y., Li, K., Yang, Z., Deng, J., and Laverty, D. M. (2015). A Novel Radial Basis Function Neural Network Principal Component Analysis Scheme for PMU-Based Wide-Area Power System Monitoring. Electr. Power Syst. Res. 127, 197–205. doi:10.1016/j.epsr.2015.06.002
Gupta, A., Gurrala, G., and Sastry, P. S. (2019). An Online Power System Stability Monitoring System Using Convolutional Neural Networks. IEEE Trans. Power Syst. 34 (02), 864–872. doi:10.1109/TPWRS.2018.2872505
Harker Steele, A. J., Burnett, J. W., and Bergstrom, J. C. (2021). The Impact of Variable Renewable Energy Resources on Power System Reliability. Energy Policy 151, 111947. doi:10.1016/J.ENPOL.2020.111947
Holjevac, N., Baškarad, T., Đaković, J., Krpan, M., Zidar, M., and Kuzle, I. (2021). Challenges of High Renewable Energy Sources Integration in Power Systems-The Case of Croatia. Energies 14 (4), 1047. doi:10.3390/EN14041047
Kim, W.-J., Lee, Y.-S., and Chun, Y.-H. (2020). Assessment of Primary Control Reserve Requirement from Generator Considering a Battery Energy Storage System. J. Electr. Eng. Technol. 15 (1), 315–324. doi:10.1007/s42835-019-00319-2
Kun, H. Y., Lin, M., Jun, L., Hui, Z., Bin, Y. Q., Yuan, L. Y., et al. (2019). Research on the Unit's Control Strategy of Online Primary Frequency Modulation. J. Phys. Conf. Ser. 1314, 012074. doi:10.1088/1742-6596/1314/1/012074
Li, S., and Wang, Y. (2018). Dynamic Performance Assessment of Primary Frequency Modulation for a Power Control System Based on MATLAB. Processes 7 (1), 11. doi:10.3390/pr7010011
Liao, J., Luo, Z., Yin, F., Chen, B., and Sheng, D. (2019). Primary Frequency Control Ability Evaluation of Valve Opening in Thermal Power Units Based on Artificial Neural Network. J. Therm. Sci. 29 (03), 576–586. doi:10.1007/s11630-019-1203-8
Liu, F., Liu, W., Wang, H., Li, Y., and Xu, Y. (2022). Review on Oscillation Mechanism and Analysis Methods of High Proportion Renewable Energy Power System. High. Volt. Eng. 48 (1), 95–114. doi:10.13336/j.1003-6520.hve.20211187
Liu, M., Bizzarri, F., Brambilla, A. M., and Milano, F. (2019). On the Impact of the Dead-Band of Power System Stabilizers and Frequency Regulation on Power System Stability. IEEE Trans. Power Syst. 34 (5), 3977–3979. doi:10.1109/TPWRS.2019.2920522
Ma, H., Su, F., Shen, C., Zhu, J., Shen, J., and Qin, J. (2012). Online Testing Function Development and Implementation for Generator Primary Frequency Regulation Performance. East China Electr. Power 40 (8), 1420–1423. doi:10.1080/15325008.2012.707289
Meegahapola, L., Sguarezi, A., Bryant, J. S., Gu, M., Conde D., E. R., and Cunha, R. B. A. (2020). Power System Stability with Power-Electronic Converter Interfaced Renewable Power Generation: Present Issues and Future Trends. Energies 13 (13), 3441. doi:10.3390/en13133441
Meng, Q., Xiao, Y., and Chen, H. (2021). Quick Primary Frequency Regulation Method and Control Strategy Based on Event Trigger. Electr. Power Autom. Equip. 41 (1), 198–205. doi:10.16081/j.epae.202010027
Ouyang, J., Pang, M., Li, M., Zheng, D., Tang, T., and Wang, W. (2021). Frequency Control Method Based on the Dynamic Deloading of DFIGs for Power Systems with High-Proportion Wind Energy. Int. J. Electr. Power & Energy Syst. 128, 106764. doi:10.1016/j.ijepes.2021.106764
Shen, C., Gui, Y., Cheng, J., and Wang, N. (2015). A Primary Frequency Regulation Control Strategy with Fast-Moving and Delayed-Returning Technology. Automa. Electr. Power Syst. 39 (13), 158–162. doi:10.7500/AEPS20141118005
Song, C., Tian, X., Xu, T., and Wang, X. (2020). Effect of Heat Storage Device on Primary Frequency Regulation Capacity of Thermal Power Unit. Electr. Power 53 (02), 120–128. doi:10.11930/j.issn.1004-9649.201809044
Talaat, M., Alsayyari, A. S., Alblawi, A., and Hatata, A. Y. (2020). Hybrid-cloud-based Data Processing for Power System Monitoring in Smart Grids. Sustain. Cities Soc. 55 (C), 102049. doi:10.1016/j.scs.2020.102049
Vejdan, S., Sanaye-Pasand, M., and Malik, O. P. (2015). Accurate Dynamic Phasor Estimation Based on the Signal Model under Off-Nominal Frequency and Oscillations. IEEE Trans. Smart Grid 8 (2), 1–12. doi:10.1109/TSG.2015.2503742
Wang, J., Su, J., Zhao, Y., Pang, X., Li, J., and Bi, Z. (2018). Performance Assessment of Primary Frequency Control Responses for Thermal Power Generation Units Using System Identification Techniques. Int. J. Electr. Power & Energy Syst. 100, 81–90. doi:10.1016/j.ijepes.2018.02.036
Xie, Y., Zhao, Q., Guo, H., and Zhang, X. (2016). A Modified DFT of Phasor and Power Measurement Algorithm Based on High Precision Frequency Measurement. Power Syst. Prot. Control 44 (12), 23–28. doi:10.7667/PSPC151000
Yuan, J. (2020). Test of Primary Frequency Modulation Function for 1000MW Ultra-supercritical Turbine Generator Unit. Power Syst. Eng. 36 (6), 30–32.
Zhang, C., Liu, L., Cheng, H., Lu, J., and Zhang, J. (2022). Review and Prospects of Planning and Operation Optimization for Electrical Power Systems Considering Frequency Security. Power Syst. Technol. 46 (1), 250–265. doi:10.13335/j.1000-3673.pst.2021.0844
Zhang, Z., Zhang, N., Du, E., Kang, C., and Wang, Z. (2022). Review and Countermeasures on Frequency Security Issues of Power Systems with High Shares of Renewables and Power Electronics. Proc. CSEE 42 (1), 1–25. doi:10.13334/j.0258-8013.pcsee.211425
Zhao, D., Feng, X., Gong, Y., Zhang, B., and Jiang, X. (2019). Analysis of Necessary Primary Reserve of a High Wind Penetration Power System. J. Eng. 2019 (16), 2060–2062. doi:10.1049/joe.2018.8855
Keywords: “master–sub” control station model, online monitoring, PFM assessment, WAMS, power network scheduling
Citation: Xu Z, Liu C and Song Z (2022) Research on Primary Frequency Modulation Online Monitoring and Assessment Management System Under “Master–Sub” Control Station Model. Front. Energy Res. 10:939100. doi: 10.3389/fenrg.2022.939100
Received: 08 May 2022; Accepted: 30 May 2022;
Published: 08 July 2022.
Edited by:
Bo Yang, Kunming University of Science and Technology, ChinaReviewed by:
Jiawen Li, South China University of Technology, ChinaXiaoshun Zhang, Northeastern University, China
Copyright © 2022 Xu, Liu and Song. This is an open-access article distributed under the terms of the Creative Commons Attribution License (CC BY). The use, distribution or reproduction in other forums is permitted, provided the original author(s) and the copyright owner(s) are credited and that the original publication in this journal is cited, in accordance with accepted academic practice. No use, distribution or reproduction is permitted which does not comply with these terms.
*Correspondence: Chao Liu, MTc3MTQ4Nzk0NUBxcS5jb20=