 Yu Dongwei
 Liu Zhibing3
95% of researchers rate our articles as excellent or good
Learn more about the work of our research integrity team to safeguard the quality of each article we publish.
Find out more
ORIGINAL RESEARCH article
Front. Energy Res. , 27 June 2022
Sec. Process and Energy Systems Engineering
Volume 10 - 2022 | https://doi.org/10.3389/fenrg.2022.937343
This article is part of the Research Topic Engineering Challenges in Energy Conversion and Transportation in Cold Regions View all 6 articles
Electric heating serves as a major cold-proof measure because engineering equipment often loses efficacy in harsh weather conditions in a polar environment. Because Convective heat transfer is the key issue to solve the cold-proof design, this paper analyzes convective heat transfer of tube and plate in the constant heat flow heating mode. According to fluent numerical simulation analysis with a wind speed of 0–40 m/s and a temperature of −40°C–0°C, both an increase in wind speed and a decrease in temperature would cause the growth of the convective heat transfer coefficient of circular tubes and flat plates, Wind speed displayed a more significant impact on convective heat transfer. In a low-temperature laboratory, a model experiment of convective heat transfer was carried out to validate the reliability of the numerical simulation. Last, a prediction model for convective heat transfer coefficient of circular tubes and flat plates in polar environment was developed using numerical and experimental data.
Polar regions, with their special geographical location, witness extremely severe weather conditions such as ice and snow. Influenced by frequent air-sea gas exchanges, as well as a great deal of sea spray and high-humidity air, upper facilities of delicate marine engineering equipment are easily frozen (Xie et al., 2017). The hull of a ship will incline owing to the uneven ice on the surface of the equipment, resulting in unstable navigation or even capsizing and sinking in serious circumstances (Bu et al., 2015). The added ice weight reduces structural stability and adds structural stress, affecting the normal operation of equipment and personnel safety (Shen and Bai, 2020). Operational difficulty is created because of the frozen upper facilities of marine engineering equipment, leading to unpredictable results (Churchill and Bernstein, 1977). Based on relevant ice zone specifications, effective cold-proof measures (electric heating methods in most cases) must be taken.
Currently, classification societies in various countries provide specifications concerning electric heat tracing, but serious problems exist in their application (Yang et al., 2013). These specifications (ABS. 2, 2008) classify only the required minimum heat loads instead of the heating power of specific components or equipment. They do not consider changes in heating power in the engineering environment (Baen and Oldford, 2014). Consequently, an unreasonable amount of heat is supplied in actual operations (Ryerson, 2011; Brazil et al., 2013; Roeder et al., 2017), wasting energy and putting an additional burden on the electric power system. Therefore, different types of components should be taken into consideration in cold-proof studies on upper facilities of marine engineering equipment, and external environmental factors influencing heat loss should be defined.
The upper facilities of marine engineering equipment are complicated, and it is difficult to study them one by one. Analyses of the equipment’s structural form show that most of them consist of flat plates and circular tubes, and the geometrical shapes of these structures have a critical influence on convective heat transfer (Incropera and D ewitt, 2002). In this study, hence, convective heat transfer was researched with components such as the flat plate and the circular tube as key objects.
Electric heat tracing has two modes: constant wall temperature heating mode and constant heat flow heating mode. The wall temperature remains constant in the former, whereas it rises continuously in the latter because the input of constant heat flux is larger than the heat loss. Convective heat transfer effects are different in the above heating modes. Currently, studies on components’ convective heat transfer focus mainly on the constant wall temperature heating mode. For example, Churchill (1976) conducted a theoretical and experimental analysis on the expression for Nusselt number Nu in relation to Prandtl number Pr and Reynolds number Re. Sugawara et al. (1958) analyzed the impact of turbulence level on flat plate heat transfer under different pressure gradients. Whitaker (1972) investigated convective heat transfer of laminar flow and turbulent boundary layer. Luikov et al. (1971) examined low Pr, velocity distribution, and temperature distribution in accordance with the boundary layer and heat exchange mechanism. Several studies have also been conducted on a circular tube under the constant wall temperature heating mode. For instance, Sanitjai and Goldstein (2004) conducted experimental studies and established a prediction model for overall heat transfer of a circular tube. Davis (1924) explored the influence of fluid property on heat transfer. Perkins and Leppert (1964) proposed a mathematical model of Nusselt number within the laminar flow region and back-end vortex shedding region by studying the differences in convective heat transfer between the two regions. Fand and Keswani (1972) measured the overall heat transfer of a circular tube and subsequently set up a Nusselt number empirical Correlation between heat transfer coefficient. Zukauskas et al. (Kauskas, 1972) Zukauskas researched the effects of different fluids on local andaverage heat transfer. However, the constant heat flow heating mode remains insufficiently studied. Treviño and liñán (1984) studied the change law of a flat plate whose temperature was influenced by applying the constant heat flow heating mode. Perkins (1963) researched the local heat transfer of a circular tube in water under the condition of constant heat flow boundary, corrected changes in fluid properties by coefficients, and proposed a Nusselt number empirical correlation in terms of Reynolds number and Prandtl number. Krall and Eckert (1973) measured local heat transfer around a circular tube in the case of a small Reynolds number. Churchill (1976) built a heat transfer equation for a circular tube using the constant heat flow heating mode on the basis of various empirical formulas. Because of the largely different weather conditions from those in the above-mentioned studies, that is, because of poor and changing weather conditions in polar regions as well as the numerous influence factors. in this study, convective heat transfer coefficient of multiple components was examined with the polar environment as a variable.
The mathematical analytical method, numerical simulation method, and experimental solution method are usually employed to calculate convective heat transfer coefficient. Its limited calculation conditions affect the precision of the mathematical analytical method, whereas only continuous experimental correction and verification can achieve the expected result in the numerical simulation method. The experiment in this paper was conducted using the numerical simulation method under the guidance of the basic theory of heat transfer. The aim was to study the variation of convective heat transfer coefficients of steel components in marine equipment with temperatures ranging from −40°C to 0°C and wind speeds ranging from 0 to 40 m/s. Additionally, a model experiment on convective heat transfer was conducted in a low-temperature laboratory, demonstrating the reliability of the numerical simulation method.
Heat conduction and heat convection are needed for convective heat transfer to conduct heat. All factors influencing the two modes have an effect on the convective heat transfer process, such as the fluid flow’s cause, speed and pattern, physical properties, and phase transition of as well as the heat transfer surface’s shape, size, and relative position. Using mathematical methods to show the connections among factors influencing convective heat transfer, the general equation of convective heat transfer with or without phase transition is given as follows:
where w is the flowing speed of the fluid, l is the geometrical size of the heat transfer surface, and tf and tw are the average temperatures of the steel-structured surface and the air, respectively. Further, φ is the geometrical factor on the surface of the structure, which can be divided into planes and tube fittings according to the features of the actual structure.
According to Newton’s law of cooling, the local convective heat transfer coefficient is
where qs(x) is the heat flux density (W/m2) at the location of component x, hx is the local heat transfer coefficient [W/(m2·K)], and Ts and T∞ are the wall temperatures of the component and the air temperature, respectively, in the unit of K.
The heat flux of a flat plate is a given rated quantity under electric heating, where the distribution of wall temperature is divided into the laminar flow and turbulent flow sections. When the length of the flat plate is longer than the critical length, its boundary layer can be seen as a mixture of the laminar flow and turbulent flow sections. When the critical Reynolds number Re is 5 × 10⁵, the convective heat transfer coefficient can be simplified as follows:
where Pr is the Prandtl number of the air, λ is the heat conduction coefficient [W/(m·K)] of the air, Re is the local Reynolds number of the flat plate, and l is the length (m) of the flat plate.
According to the similarity principle and dimensional analysis, the experimental correlation of the flat plate is as follows:
Fluid separation occurs when fluid flows across a circular tube. The heat transfer process is very complex and difficult to calculate by theoretical analysis. Based on substantial experimental statistics, researchers have presented the correlation of the average surface heat transfer coefficient as fluid flows across a circular tube within the temperature range of each experiment. The empirical formulas Hilpert and Churchill proposed have been widely applied to calculate heat transfer as air flows across a circular tube.
Hilpert developed an experimental correlation equation of forced convective heat transfer as air flows across a circular tube in the constant wall temperature heating mode. The experimental air temperature ranges from 15.5°C to 980°C, and the wall temperature of the circular tube ranges from 21°C to 1046°C. It is shown as follows:
Churchill compared and analyzed each empirical formula and proposed a more widely applicable experimental correlation equation of a circular tube’s convective heat transfer coefficient. It is shown as follows:
Eq. 4 takes only the laminar flow section and turbulent flow section into account without considering the effect of the transition section in the heat transfer of the flat plate in electric heating. Equations 5 and 6 are not applicable to a circular tube in the constant heat flow heating mode, but they reveal the connection between convective heat transfer and Re as well as Pr, where the parameter Pr relates to temperature and Re is influenced by wind speed. Thus, the combination of numerical simulation and indoor experiment is absolutely needed to study variations of convective heat transfer of flat plates and circular tubes under different wind speeds and temperatures.
Based on the actual sizes of the flat plate and circular tube in the experiment, the numerical analysis models were built in this paper using the Fluent finite element software. A wall was set in the nonslip boundary condition, and a fixed heat flux was set to be the heat boundary condition because of the adoption of the heating mode with uniformly distributed heat tracing belts. Simulation of convection heat transfer in tubes is under the second boundary condition, the second boundary condition is the heat flux, that is boundary layer of normal component qn:
Where q: heat flux, W/m2; n: the normal direction of heat flux.
The heat flux of the flat plate and circular tube was 773.81 and 1801.86 W/m2, respectively. Considering that the convective heat transfer of the flat plate would involve the laminar flow and turbulent flow sections and thus cause fluid separation on the circular tube, the
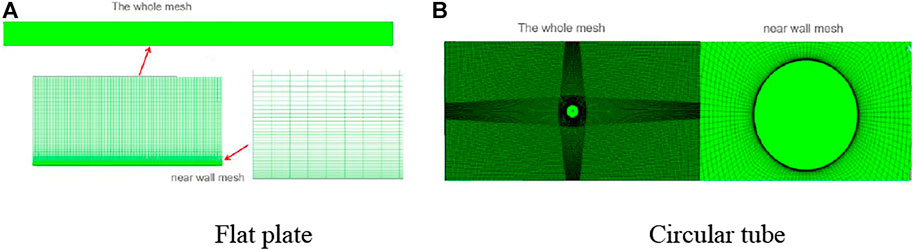
FIGURE 1. Grid distribution of the convective heat transfer models. (A) Flat plate and (B) Circular tube.
Figures 2, 3, respectively, show the changes in convective heat transfer coefficient of the heating flat plate and circular tube with wind speed and environment temperature. The convective heat transfer coefficient of the flat plate and circular tube grew by increasing wind speed and decreasing temperature, and the influence of wind speed was more significant than that of temperature. The convective heat transfer coefficient of the flat plate was less affected by environment temperature at wind speeds of less than 25 m/s, whereas it was greatly affected by environment temperature at wind speeds of more than 25 m/s. When the temperature remained unchanged, the convective heat transfer coefficient grew under various wind speeds. When the wind speed was greater than 25 m/s, the change gradient of the convective heat transfer coefficient with temperature improved, suggesting a larger influence of temperature on the convective heat transfer coefficient of the flat plate. With a temperature of −30°C to −20°C and a wind speed greater than 25 m/s, the influence of temperature on the convective heat transfer coefficient of the circular tube increased. When the temperature was lower than −30°C, it had a greater influence on the convective heat transfer coefficient of the circular tube. With constant temperature differences, the convective heat transfer coefficient grew at different wind speeds. When the temperature was within the range of −30°C to −20°C with a wind speed higher than 25 m/s, or the temperature was lower than −30°C, the convective heat transfer coefficient displayed a greater increase. This indicated the greater effects of temperature on the convective heat transfer coefficient of the circular tube under this environment condition. When the wind speed was higher than 25 m/s, the starting point of flow separation shifted backward and the disturbance effect of the enhanced heat transfer weakened in the separation region. As a result, the change rate of the convective heat transfer coefficient with the wind speed dropped within the range of −10°C to −20°C. When the temperature was lower than −20°C, the convective heat transfer was substantially enhanced owing to the decrease of air viscosity, thus counteracting the heat transfer influence induced by wind speed to a certain degree.
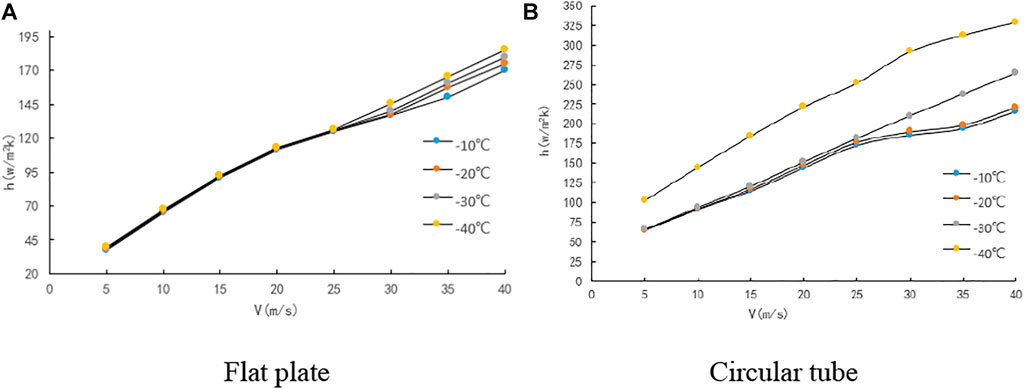
FIGURE 2. Change of convective heat transfer coefficient with the wind speed. (A) Flat plate and (B) Circular tube.
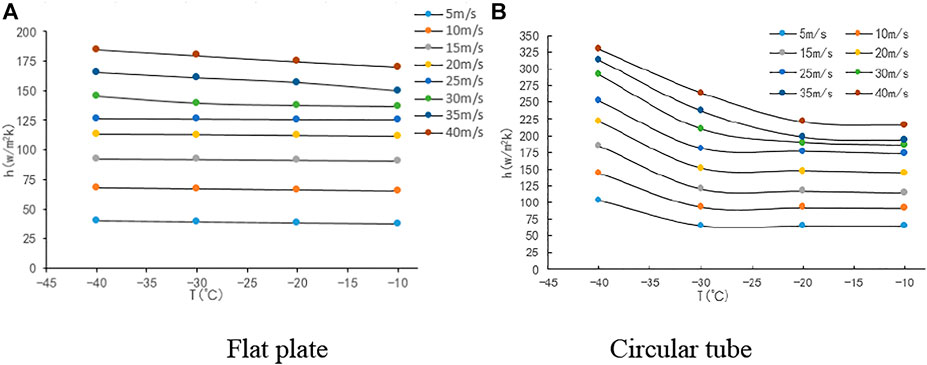
FIGURE 3. Change of convective heat transfer coefficient with environment temperature. (A) Flat plate and (B) Circular tube.
The results of the above simulation analysis of the convective heat transfer coefficient of the flat plate and circular tube within different temperature ranges (Table 1) showed the following:
1) At temperatures ranging from −20°C to 0°C: When the average wind speed was lower than 25 m/s, the convective heat transfer coefficient of the flat plate and the circular tube increased by 0.1% and 0.2%, respectively, as the temperature decreased by 1°C. Additionally, it rose by 11.7% and 8.4%, respectively, when the average wind speed increased by 1 m/s. When the wind speed was higher than 25 m/s, the convective heat transfer coefficient of the flat plate and circular tube grew by 0.3% and 0.2%, respectively, as the temperature dropped by 1°C. It grew by 2.4% and 1.7%, respectively, when the average wind speed increased by 1 m/s.
2) At temperatures ranging from −30°C to −20°C: When the average wind speed was lower than 25 m/s, the convective heat transfer coefficient of the flat plate and the circular tube increased by 0.1% and 0.2%, respectively, as the temperature decreased by 1°C. Further, it rose by 10.0% and 8.8%, respectively, when the average wind speed increased by 1 m/s. When the wind speed was higher than 25 m/s, the convective heat transfer coefficient of the flat plate and circular tube grew by 0.2% and 0.2%, respectively, as the temperature dropped by 1°C. It grew by 2.9% and 3.1%, respectively, when the average wind speed increased by 1 m/s.
3) At temperatures ranging from −40°C to −30°C: When the average wind speed was lower than 25 m/s, the convective heat transfer coefficient of the flat plate and circular tube increased by 0.1% and 4.3%, respectively, as the temperature decreased by 1°C. Additionally, it rose by 10.7% and 7.3%, respectively, when the average wind speed increased by 1 m/s. When the wind speed was higher than 25 m/s, the convective heat transfer coefficient of the flat plate and circular tube grew by 0.3% and 3.2%, respectively, as the temperature dropped by 1°C. It grew by 3.1% and 2.0%, respectively, when the average wind speed increased by 1 m/s.
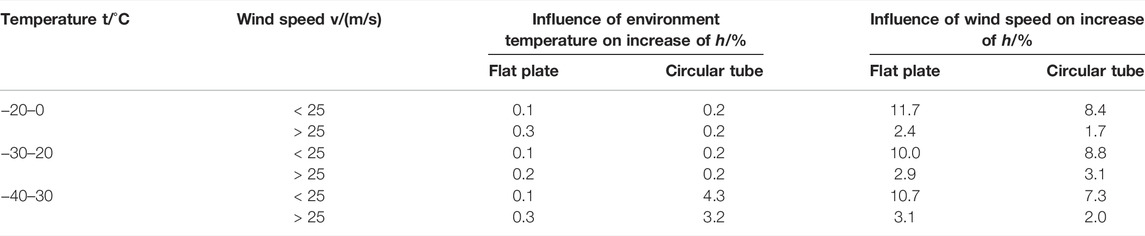
TABLE 1. Simulation analysis results of the convective heat transfer coefficient.
Therefore, the impacts of different temperatures and wind speeds should be taken into account in the prediction model of the convective heat transfer coefficient.
An experimental platform for convective heat transfer in a steel structure in a polar environment was constructed in a low-temperature laboratory. The test tube is the handrail and flat plate on board for PC3 class icebreaker, made of Q235 smooth steel. The convective heat transfer coefficients of the flat plate and tube fittings under different wind speed and temperature conditions were precisely measured. The adjustable lowest temperature reached -50°C and the highest wind speed reached 15 m/s in the low-temperature laboratory, enabling the simulation of the low-temperature environment of polar regions. The parameters of the experimental equipment are shown in Table 2.
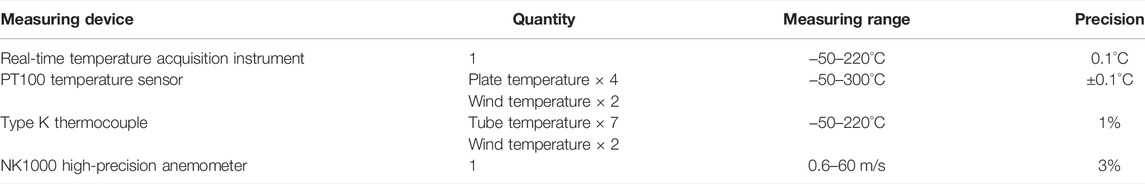
TABLE 2. Experimental measuring devices.
Because the convective heat transfer of the flat plate occurred in the laminar flow, transition, and turbulent flow sections, the flat plate (2.4 m long and 0.7 m wide) was used in the experiment to fully consider the impacts of convective heat transfer in various stages. The component circular tube was 0.042 m in outer diameter, 0.020 m in inside diameter, and 0.251 m in length. The electric heating mode was adopted for the flat plate in the experimental process. It was believed that the heat taken away by the convective heat transfer was consistent with the input through electric heating in the experiment when the surface temperature tw of the flat plate achieved a stable status. Then, the convective heat transfer coefficient h of the components under different wind speeds and temperatures could be calculated. The experimental devices used are shown in Figure 4.
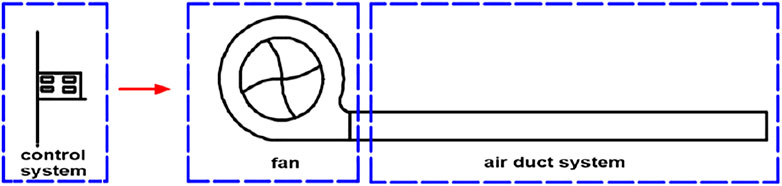
FIGURE 4. Experimental devices.
The boundary-layer separation of fluid (phenomenon of detached fluid) would take place when fluid flowed across the circular tube because the laminar flow section and turbulent flow section were involved in the convective heat transfer of the flat plate. In this study, the critical Reynolds number Rec of 5 × 10⁵ and the lowest wind speed of 5 m/s were applied, under which the distance xc from laminar flow to turbulent flow as the transition of fluid across the flat plate boundary layer was 1.2 m. A total of six temperature measuring points were arranged, of which two points were on the laminar flow section and four points were on the turbulent flow section. Regarding the circular tube, one temperature measuring point was set every 30°, totaling seven measuring points. Figure 5 displays the arrangement of measuring points.
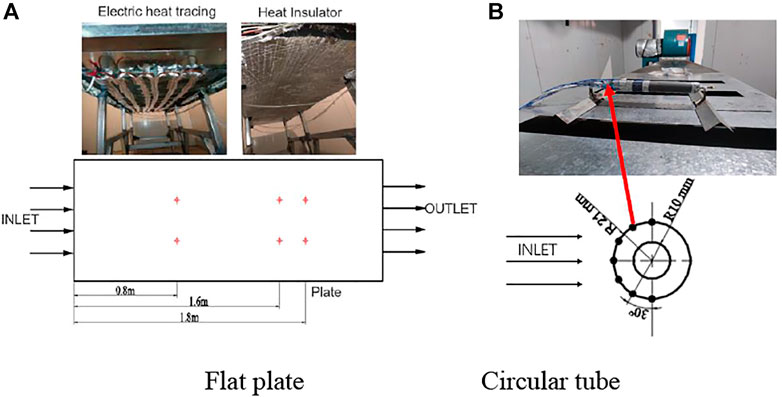
FIGURE 5. Arrangement diagram of measuring points. (A) Flat plate and (B) Circular tube.
The experimental platform for the convective heat transfer of components, including the flat plate and the circular tube, in electric heat tracing was built in the low-temperature laboratory. The convective heat transfer coefficient of the flat plate and circular tube was measured at different wind speeds and temperatures. The temperature and wind speed were controlled at −40°C–0°C and 5–13.7 m/s in the experiment. The flat plate and circular tube in the experiment were real components of a steel plate and handrail from the upper facilities of marine engineering equipment.
The measured value errors of the convective heat transfer coefficient mainly lay in two aspects:
1) The temperature measured in the experiment fluctuated periodically, and type K thermocouple for temperature measurement showed a precision of 1%.
2) Regarding the processing method for the experimental data, the experiment was conducted 3 times under each condition to reduce experimental measuring errors. Given the effects of the transition section of the flat plate and detached fluid in the circular tube, the average value at each measuring point was regarded as the overall average heat transfer coefficient in the data processing.
The convective heat transfer coefficients under the experimental conditions where temperature was close to wind speed were comparatively analyzed. Figure 6 compares the experimental data and numerical simulation results of the flat plate and circular tube. With a wind speed of 5 m/s, the experimental value showed a high goodness of fit with the simulation results. The average error of the flat plate and circular tube was 4.47% and 6.22%, respectively. When the wind speed reached 9 m/s, the average error of the experimental values for the flat plate and circular tube were 5.05% and 9.86%, respectively, compared to the numerical simulation results. When the wind speed reached 13.7 m/s, the experimental value of the flat plate and circular tube represented an average error of 4.57% and 6.25%, respectively, compared with the simulation results. The accuracy of the numerical simulation models for the flat plate and circular tube was verified by comparing the data.
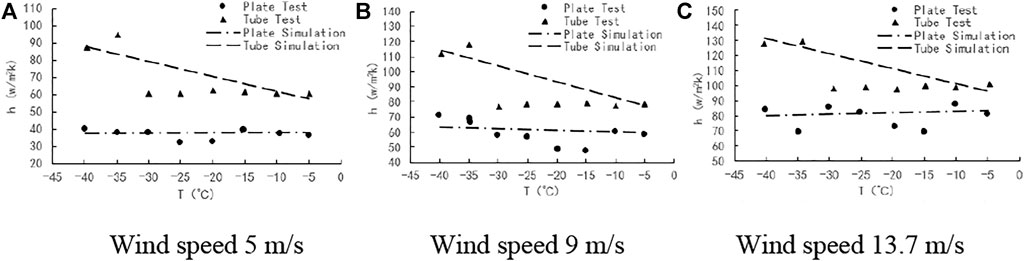
FIGURE 6. Comparison between numerical simulation and experimental results of components.
The analysis showed that the major influence factor of flat plate heat transfer was wind speed; temperature only played a small role. Additionally, wind speed and temperature mainly influenced the circular tube heat transfer. Table 3 shows the change range of relevant parameters under the impact of temperature.

TABLE 3. Constants in the heat transfer calculation formula.
Prandtl number Pr and thermal conductivity coefficient λ were treated as constants in the formula fitting process of the convective heat transfer coefficients, which were 0.718 and 0.0226, respectively, for the flat plate at −40°C to 0°C; 0.715 and 0.0228, respectively, for the circular tube at −30°C to 0°C; and 0.726 and 0.0216, respectively, for the circular tube at −40°C to −30°C. The influence of the transition section on the flat plate was considered in this paper, and the critical Reynolds number Re was calculated and presented as constant b.
The mathematical prediction model of the convective heat transfer of the flat plate can be denoted as follows:
The mathematical prediction model of the convective heat transfer of the circular tube can be expressed as follows:
The simulation data were fitted on the basis of the above formulas. The results are shown in Figure 7. In the formulas for the flat plate, a = 0.06 and b = 1726. In the formulas for the circular tube, C1 = 0.490, m1 = 0.659, n1 = 3.141, C2 = 0.191, m2 = 0.599, and n2 = 1.680. Regarding the statistical fitting results, decision coefficient R2 was 90%, 98.0%, and 99.6%, respectively, showing a relatively great fitting effect.
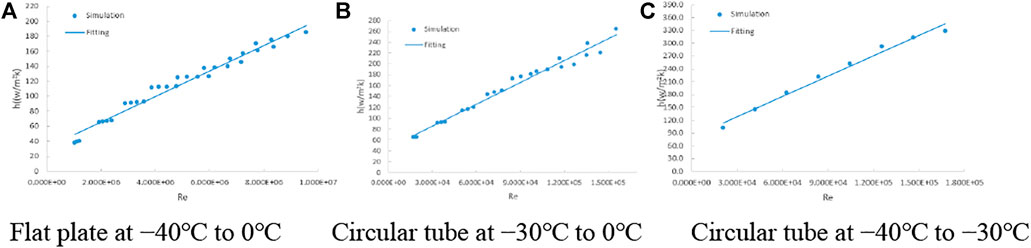
FIGURE 7. Simulation data fitting of convective heat transfer coefficients.
In this paper, the influencing factors of environmental in circular tubes and flat plates in a Polar Environment are studied. The consideration given in the specification for heating lack of environment changes is supplemented. This was studied by numerical simulation under the second boundary condition, and the correctness of the simulation model is verified by test.
1) The convective heat transfer coefficient of the components rose with an increase of wind speed and decrease of temperature, and wind speed showed a more significant influence. Regarding the flat plate, the convective heat transfer coefficient was less affected by temperature and a wind speed lower than 25 m/s, and it was greatly affected by temperature and wind speed higher than 25 m/s. However, the influence of temperature on the heat transfer of the flat plate can be ignored. Regarding the circular tube, when the temperature was lower than −30°C, a greater impact of temperature on the convective heat transfer coefficient was observed, and when the temperature was lower than −20°C with a wind speed of higher than 25 m/s, a greater impact of temperature on convective heat transfer coefficient was observed.
2) It was confirmed based on the model experimental data that the simulation models for the flat plate and tube fittings were reliable at wind speeds of 0–40 m/s and temperatures of −40°C to 0°C.
3) The prediction model of the convective heat transfer coefficient of the flat plate and circular tube obtained by simulation data fitting can serve as a reference for heat balance calculation of the upper facilities of polar marine engineering equipment.
The original contributions presented in the study are included in the article/Supplementary Material, further inquiries can be directed to the corresponding author.
Conceptualization, ZD, WuG, and LZ. Investigation, HX and WaG. Resources, WuG. Software, YD. Supervision, ZD; Writing—original draft, YD. Writing—review and editing, YD. All authors contributed to manuscript revision, read, and approved the submitted version.
This work was supported by the, High—tech marine scientific research projects (CBG2N21-2-2), National Natural Science Foundation of China (Grant No. 52071055), and the Innovation team of colleges and universities in Liaoning Province (LT2019004).
The authors declare that the research was conducted in the absence of any commercial or financial relationships that could be construed as a potential conflict of interest.
All claims expressed in this article are solely those of the authors and do not necessarily represent those of their affiliated organizations, or those of the publisher, the editors and the reviewers. Any product that may be evaluated in this article, or claim that may be made by its manufacturer, is not guaranteed or endorsed by the publisher.
ABS. 2 (2008). Polar Waters Guide-2008(E 2008). Guide for Building and Classing Vessels Intended for Navigation in Polar Waters. Houston, TX: American Bureau of Shipping.
Baen, P., and Oldford, D. (2014). “Surface Heating for Arctic Vessels and Structures to Prevent Snow and Ice Accumulation,” in 2014 Petroleum and Chemical Industry Conference Europe, Amsterdam, Netherlands, 03-05 June 2014, 1–10.
Brazil, H., Conachey, R., Savage, G., and Baen, P. (2013). Electrical Heat Tracing for Surface Heating on Arctic Vessels and Structures to Prevent Snow and Ice Accumulation. IEEE Trans. Ind. Appl. 49 (6), 2466–2470. doi:10.1109/tia.2013.2263372
Bu, S., Chu, J., Lu, J., and Huang, M. (2015). Effect of Ice Accumulation on Ship Stability. Proceedings of the 27th National on Hydrodynamics, NanJing, 2015-11-06.
Churchill, S. W. (1976). A Comprehensive Correlating Equation for Forced Convection from Flat Plates. AIChE J. 22 (2), 264–268. doi:10.1002/aic.690220207
Churchill, S. W., and Bernstein, M. (1977). A Correlating Equation for Forced Convection From Gases and Liquids to a Circular Cylinder in Crossflow. Asme Trans. J. Heat Transf. 99 (2), 300–306. doi:10.1115/1.3450685
Davis, A. H. (1924). CIV. Convective Cooling of Wires in Streams of Viscous Liquids. Lond. Edinb. Dublin Philosophical Mag. J. Sci. 47 (282), 1057–1092. doi:10.1080/14786442408634450
Fand, R. M., and Keswani, K. K. (1972). A Continuous Correlation Equation for Heat Transfer from Cylinders to Air in Crossflow for Reynolds Numbers from 10 −2 to 2 × 10⁵. Int. J. Heat Mass Transf. 15 (3), 559–562. doi:10.1016/0017-9310(72)90219-0
Incropera, F. P., and Dewitt, D. P. (2002). Fundamentals of Heat and Mass Transfer. 5th Edition. New York: John Wiley & Sons.
Krall, K. M., and Eckert, E. R. G. (1973). Local Heat Transfer Around a Cylinder at Low Reynolds Number. J. Heat Transf. 95 (2), 273–275. doi:10.1115/1.3450044
Luikov, A. V., Aleksashenko, V. A., and Aleksashenko, A. A. (1971). Analytical Methods of Solution of Conjugated Problems in Convective Heat Transfer. Int. J. Heat Mass Transf. 14 (8), 1047–1056. doi:10.1016/0017-9310(71)90203-1
Perkins, H. C. J. (1963). Forced Convection Heat Transfer from a Uniformly Heated Cylinder. Michigan, United States: ProQuest Dissertations Publishing.
Perkins, H. C., and Leppert, G. (1964). Local Heat-Transfer Coefficients on a Uniformly Heated Cylinder. Int. J. Heat Mass Transf. 7 (2), 143–158. doi:10.1016/0017-9310(64)90079-1
Roeder, W., Baen, P., and Seitz, R. (2017). “Electric Trace Heat Design Methods for De-icing and Anti-icing of Vessels, Support Equipment and Infrastructure in the Arctic,” in OCEANS 2017 -Anchorage, Anchorage, AK, USA, 18-21 September 2017, 7–13.
Ryerson, C. C. (2011). Ice Protection of Offshore Platforms. Cold Regions Sci. Technol. 65 (1SI), 97–110. doi:10.1016/j.coldregions.2010.02.006
Shen, J., and Bai, X. (2020). Numerical Simulations of Deck Structure Icing on Polar Offshore Platforms Based on Fluent and FENSAP-ICE. Chin. J. Polar Res. 32 (2), 177–183.
Sanitjai, S., and Goldstein, R. J. (2004). Heat Transfer from a Circular Cylinder to Mixtures of Water and Ethylene Glycol. Int. J. Heat Mass Transf. 47 (22), 4785–4794. doi:10.1016/j.ijheatmasstransfer.2004.05.013
Sugawara, S., Sato, T., Komatsu, H., and Osaka, H. (1958). The Effect of Free-Stream Turbulence on Heat Transfer from a Flat Plate. Tech. Rep. Archive Image Libr. 19 (18), 18–25.
Treviño, C., and liñán, A. (1984). External Heating of a Flat Plate in a Convective Flow. Int. J. Heat Mass Transf. 27 (7), 1067–1073. doi:10.1016/0017-9310(84)90122-4
Whitaker, S. (1972). Forced Convection Heat Transfer Correlations for Flow in Pipes, Past Flat Plates, Single Cylinders, Single Spheres, and for Flow in Packed Beds and Tube Bundles. AIChE J. 18 (2), 361–371. doi:10.1002/aic.690180219
Xie, Q., Chen, H. L., and Zhang, J. F. (2017). Research Progress of Ant-Icing/deicing Technologies for Polar Ships and Offshore Platforms. Chin. J. Ship Res. 12 (1), 45. doi:10.3969/j.issn.1673-3185.2017.01.008
Keywords: polar region, convective heat transfer, experimental measurement, numerical simulation, constant heat flux
Citation: Dongwei Y, Zhibing L, Gang W, Xueyang H, Guojun W and Dayong Z (2022) Influence Analysis of Convective Heat Transfer of Circular Tubes and Flat Plates in a Polar Environment. Front. Energy Res. 10:937343. doi: 10.3389/fenrg.2022.937343
Received: 06 May 2022; Accepted: 07 June 2022;
Published: 27 June 2022.
Edited by:
Li Zhou, Jiangsu University of Science and Technology, ChinaReviewed by:
Shifeng Ding, Jiangsu University of Science and Technology, ChinaCopyright © 2022 Dongwei, Zhibing, Gang, Xueyang, Guojun and Dayong. This is an open-access article distributed under the terms of the Creative Commons Attribution License (CC BY). The use, distribution or reproduction in other forums is permitted, provided the original author(s) and the copyright owner(s) are credited and that the original publication in this journal is cited, in accordance with accepted academic practice. No use, distribution or reproduction is permitted which does not comply with these terms.
*Correspondence: Zhang Dayong, emhhbmdkeUBkbHV0LmVkdS5jbg==
Disclaimer: All claims expressed in this article are solely those of the authors and do not necessarily represent those of their affiliated organizations, or those of the publisher, the editors and the reviewers. Any product that may be evaluated in this article or claim that may be made by its manufacturer is not guaranteed or endorsed by the publisher.
Research integrity at Frontiers
Learn more about the work of our research integrity team to safeguard the quality of each article we publish.