 Weiwei Zhang1,2
 Shuliang Wang1*
- 1School of Computer Science and Technology, Beijing Institute of Technology, Beijing, China
- 2Yunnan Provincial Energy Investment Group Co.Ltd., Kunming, China
To solve the problems of environmental pollution and energy consumption, there is an urgent need to develop clean and renewable energy to maintain the sustainable development of society. Therefore, distributed generation (DG) has attracted engineers’ extensive attention. However, DG output of is usually random and intermittent. When connected to different locations, different sizing, and different distribution networks, it will have varying impact on the safe and stable operation of the power system. When choosing the optimal DG access scheme, planners must consider the impact of size, type, and location to ensure that power grid operation is safe, stable, reliable, and efficient. Therefore, this article proposes an objective function considering power losses, voltage profile, and pollution emission, which is solved by equilibrium optimizer (EO). Finally, the effectiveness of the proposed strategy is verified based on IEEE 33 and 69-bus distribution networks. The results show that the strategy can effectively improve the pollution emission of the system, effectively reduce power loss, and improve the voltage profile.
1 Introduction
In the continuous development of power systems, the traditional model of centralized power generation leads to thermal power, consuming greater amounts of non-renewable resources, fossil energy shortages and intensified environmental degradation. This trend has been unable to comply with the demands of today’s power system, so global energy transformation is imperative (Chan and Phang, 1987; Krismanto et al., 2018; Yang et al., 2021).
On the other hand, at present, most of the large power grids, with centralized power generation as their dominant feature, is adopted domestically and internationally. The power system is evolving toward large-scale, centralized, ultra-high voltage units. The disadvantages of the power system are made clear with the construction of the power grid. Some power supply sources are located far away, in cities with low population density. Long transmission distances lead to high power loss and difficulty in ensuring power quality, which makes users in remote areas unable to obtain ideal power supply services and leads to low utilization of economic investment (Wang et al., 2014; Bikash et al., 2019; Bikash et al., 2020).
In addition, although DG can provide power for the power grid and improve system reliability (Kumar et al., 2019), several factors (different network distribution structure ; huge node numbers; large power load; randomness of DG access; power distribution network management) lead to construction difficulties, schedule complications, and problems at various points of failure caused by negative impacts on the power system. In the case of serious disturbances, large-scale power failure may result, causing disastrous consequences (Chandrasekhar and Sydulu, 2012; Aman et al., 2014; Velasquez et al., 2016). In addition, multiple types of DG are usually connected to the distribution network, in order to take full advantage of DG and make the system run more reliably, safely, and stably (Aman et al., 2012; Murty and Kumar, 2015; Iqbal et al., 2018). Currently, wind turbines are the most mature photovoltaic (PV) system, and so is often the first choice for installation. However, their output power is largely affected by illumination and wind speed, causing randomness, intermittency, and uncertainty. Access to the distribution network brings many uncertain factors (Gandomkar et al., 2005; Afzalan et al., 2012). Inappropriate sizing of DG and unreliable access to any node of the distribution network will increase network losses and damage the voltage profile and network harmonics (Zhu et al., 2006; Ameli et al., 2014; Poornazaryan et al., 2016). How to rationally configure sizing and access nodes for different types of DG, so as to most effectively reduce construction costs and maintenance costs, improve voltage profile of the system, correctly use the direct value of power supply provided by DG, and scientifically and reasonably connect DG to the distribution network has become an urgent problem to be solved.
Currently, the DG planning process is highly nonlinear and contains many discrete optimization variables and multiple complex constraint optimization problems. In light of this, the traditional interior-point method makes it difficult to obtain high-quality plans. To address this deficiency, some scholars adopt heuristic algorithms (Acharya et al., 2016; Das et al., 2016). Heuristic algorithms are used to find optimal solutions by constant updating and iteration. It has the advantage of not relying on the accurate system model and is widely used to solve problems of high complexity . The optimization method can be divided into two types: single individual search and population search. Because population search has multiple search individuals, its efficiency is increased (Ogunjuyigbe et al., 2016; Ben Hamida et al., 2018). Past research (Moradi and Abedini, 2016) suggests DG site is the appropriate selection, based on the influence of the injected active power of each node on the active power losses, which significantly reduces the amount of calculation for site selection. Genetic algorithm is then adopted to fix DG volume , which effectively reduces the active power losses of the system. Meena et al.(2017) proposed an improved artificial bee colony algorithm to plan the DG, taking into account access sizing, a-node and power factor. Results of the IEEE 33 and 69-bus distribution networks tests showed that power losses of the test system were significantly optimized. Yanez-Borjas et al. (2021) proposed a cooperative complementary optimization scheme for DG and capacitor, which is solved by the dragonfly algorithm. This scheme can effectively compensate the active power and reactive power gap of the system in close range, thus improving the voltage stability margin and maximum load sizing of the distribution network and reducing system power loss.
However, distribution network load shows certain rules relating to people’s living habits, so it is necessary to assess its regularity. In addition, the output of wind turbines and PV units is significantly affected by the natural environment, so timing modeling for those items is necessary.
In this article, we first establish time-series power output models for wind turbines and PV systems, time-series load models, constant power output models for fuel cells, and miniature steam turbines. We next constructed a multi-objective mathematical optimization model of DG location and constant volume. Considering power losses, we used established voltage profile and pollution emission , and equilibrium optimizer (EO) to solve the model. Finally, the simulation based on IEEE 33 and 69-bus distribution networks shows that the proposed strategy can effectively improve the active power losses and voltage profile of the distribution network while considering environmental pollution emission and demonstrates that the proposed strategy can effectively solve the multi-objective programming problem.
2 Problem Formulation
2.1 Load and DG Output Timing Model
2.1.1 Output Timing Model of Wind Turbine
If the time-series characteristics of wind turbine are not considered, the location and sizing model can be expressed as a power source with constant output active power, but consuming reactive power. However, in practical engineering, output of wind turbine is significantly affected by the natural environment. If its timing characteristics are not considered, it does not have engineering practicability. At this stage, wind speed characteristics are usually described by the Weibull distribution of two parameters, which is shown as follows:
where
Logarithmically transformed:
Further equivalent transformation:
Finally, the probability density function can be expressed as
The output power of wind turbine mainly depends on wind speed, which can be expressed as the following segmented function (Abu-Mouti and El-Hawary, 2011):
where
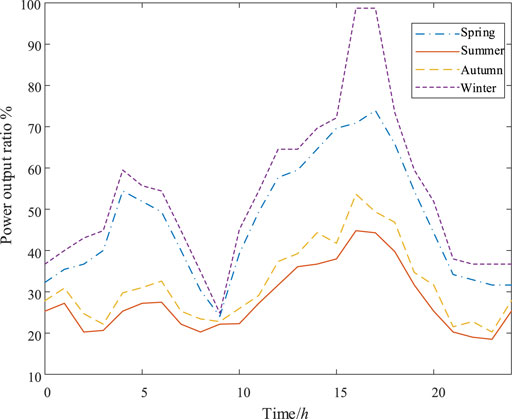
FIGURE 1. Annual output curve of wind turbine.
2.1.2 Output Timing Model of Photovoltaic System
The output power
where
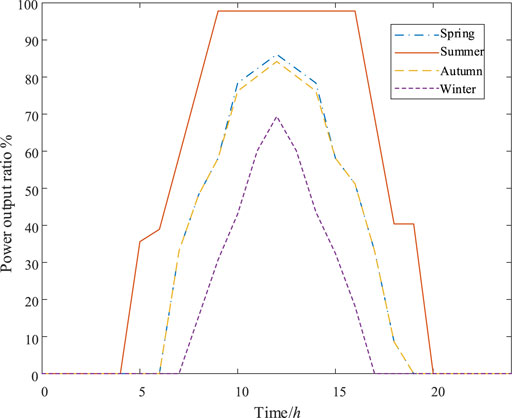
FIGURE 2. Annual output curve of PV system.
2.1.3 Load Time Series Model
The load size shows certain regularity due to people’s living habits. Figure 3 shows the typical load curve of resident load in four seasons (Abu-Mouti and El-Hawary, 2011).
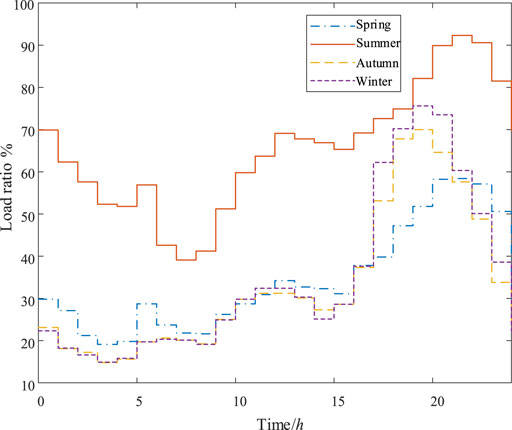
FIGURE 3. Annual load curve of residents.
2.2 Objective Function
The operation of DG connected to the distribution network can effectively reduce system power loss and improve the voltage profile. In addition, rational use of DG can effectively utilize fossil fuels and reduce emission of carbon and sulfur pollutants. Therefore, we propose a DG location and volume multi-objective programming model considering power losses, voltage profile, and pollution emission. The aim of this model is to optimize the power loss and voltage profile of the system to the greatest extent possible and maximize consumption of new energy.
2.2.1 Power Losses
When the power system operates under the heavy load conditions, power loss will also increase, seriously affecting its economical operation. However, with the increase of DG permeability to the distribution network, the distance of power flow can be effectively reduced, so as to significantly reduce power loss. However, the size of DG connected to the distribution network cannot increase indefinitely. When it exceeds a certain value, power loss will increase instead and affect the stability of the power system. Therefore, we used the power loss index to measure the optimization effect for network loss, which can be described as follows (Ugranlı and Karatepe, 2013):
where
2.2.2 Voltage Profile Index
DG can effectively improve voltage profile and voltage amplitude by providing active power and reactive power to the load in a short distance. However, when power injected into the distribution network by DG is too large, it will also lead to voltage exceeding the stable range and endanger system stability. Therefore, this article uses voltage profile index to describe this optimization effect, as detailed here (Ugranlı and Karatepe, 2013):
where
2.2.3 Environmental Emission Reduction Index
Compared with traditional centralized power generation, DG can effectively absorb renewable energy distributed in the natural environment, reduce dependence on fossil fuels and effectively reduce emission of pollutants containing carbon and sulfur. The present study uses pollution emission indicators to describe this optimization effect, described as follows (Ugranlı and Karatepe, 2013):
where
The mass of carbon dioxide, sulfur dioxide, and nitride emitted can be obtained by adding the weight coefficient (Ugranlı and Karatepe, 2013):
where
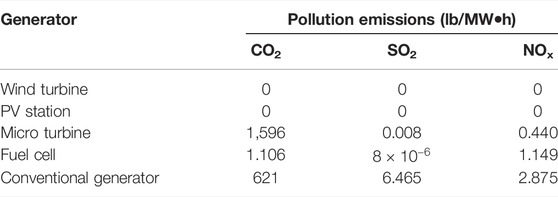
TABLE 1. Five types of power generation emissions.
2.2.4 Multi-Objective Function
In this article, we proposed a multi-objective performance optimization index, in order to obtain DG location and volume planning scheme, taking into account the three optimization indexes noted above, as described by Ugranlı and Karatepe (2013):
where
2.3 Constraint
When DG is connected to the distribution network for operation, the power flow of the original system will change. In order to ensure the stable operation of the system, the following constraints need to be considered.
2.3.1 Power Balance
where
2.3.2 DG Sizing
Due to the limitation of the working principle, structure and production model of the production DG, and the influence of environmental factors on the operation of the production DG, power dispatching cannot be completely controlled, which will have a great impact on power flow, relay protection, voltage, and waveform of the original power grid. Therefore, the power allowed to access the power grid DG is limited (Ugranlı and Karatepe, 2013).
where
2.3.3 Transmission Line Sizing Constraints
where
2.3.4 Voltage Constraints
In order to ensure the safe and stable operation of the system, it is necessary to limit voltage within the safe range, which can be described as follows (Ugranlı and Karatepe, 2013):
where
3 Equilibrium Optimizer
Equilibrium optimizer (EO) is an optimization algorithm inspired by the physical phenomenon of dynamic balance of mass in control volume, and its specific optimization process is as follows (Faramarzi et al., 2020):
(1) Population initialization: similar to most meta-heuristics, EO uses the initial population to start the optimization process. The initial state is randomly and uniformly constructed in the search space according to the number and size of particles, as shown in the following formula (Faramarzi et al., 2020):
where
(2) Balance pool and candidate solution: the balance pool collects the top four particles in the fitness value of the current solution and the average value of these four particles as the candidate solution of the update formula, as shown in the following formula (Faramarzi et al., 2020):
where
(3) Exponential coefficient F: The exponential coefficient can balance global exploration and local development capabilities well, and its specific calculation formula is as follows (Faramarzi et al., 2020):
where
(4) Generation rate G: The generation rate is an important indicator in the mass balance equation. In order to further improve the local development sizing, it is designed as follows (Faramarzi et al., 2020):
where
(5) Update formula: After abstracting and improving the original physical theory, the updated formula of EO is established as (Faramarzi et al., 2020)
where
4 Case Studies
In order to verify the effectiveness of the proposed strategy, simulation verification was carried out based on IEEE 33 and 69-bus distribution networks. The test system is shown in Figures 4, 5. The configured DG includes four types: PV system (2 nodes installed), wind turbine (2 nodes installed), fuel cell (1 node installed), and micro gas turbine (1 node installed). It is important to note that fuel cells and micro gas turbines can adjust their power output by controlling the waste products of fuel input, and the output is relatively stable, which can effectively compensate for the randomness of the output of PV units and wind turbines.
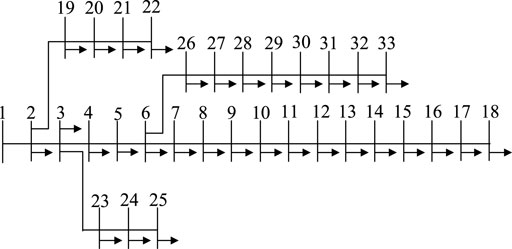
FIGURE 4. IEEE 33-bus distribution network.
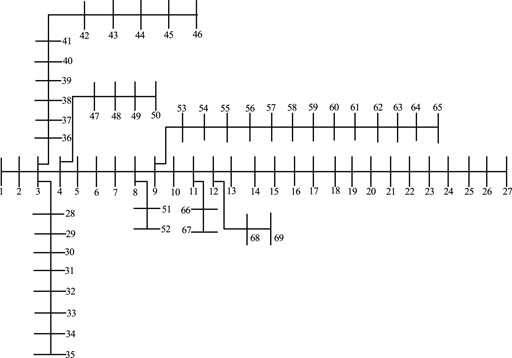
FIGURE 5. IEEE 69-bus distribution network.
In addition, the objective function, constraints, and size of the test system jointly affect the complexity of the problem to be solved. The population size and iteration times of the algorithm determine the solution efficiency of the problem. If the population size and iteration times of the algorithm are too large, it will lead to low solution efficiency. On the other hand, if small population size and iteration times are set, the planning scheme can be obtained quickly, but the optimal solution has a high probability of not occurring. Therefore, we used the trial-and-error method to select population size iteration times. The objective function is established as follows:
where
4.1 IEEE 33-Bus Distribution Networks
Table 2 and Figure 6, respectively, show the IEEE 33 bus distribution network planning scheme for grid-connected operation and the voltage distribution of the system. As seen in Figure 6 and Table 2, after EO optimization and configuration of different types of DG, the total active power loss and annual average voltage distribution of the distribution network throughout the year improved significantly. The results show that the planning scheme avoids areas with heavy reactive load, avoids more serious reactive power shortage in these areas, and ensures system stability. In addition, the voltage profile curves with and without DG installation, which effectively proves that DG has a significant optimization effect on improving the voltage profile of the distribution network, because DG is always installed near the load. Figure 7 shows the convergence curves of EO. It can be seen that EO has an excellent search mechanism and can converge to the minimum value with fewer iterations to avoid falling into the local optimum.
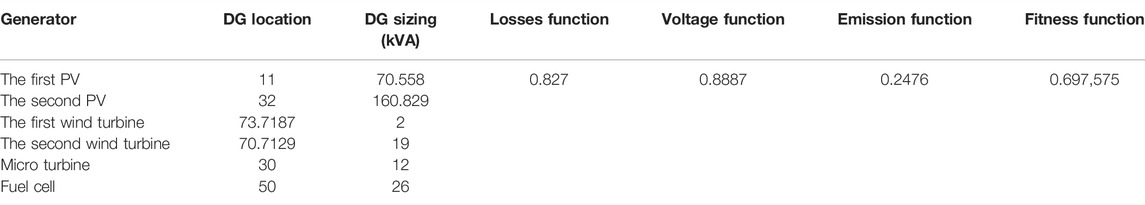
TABLE 2. Optimization results of EO.
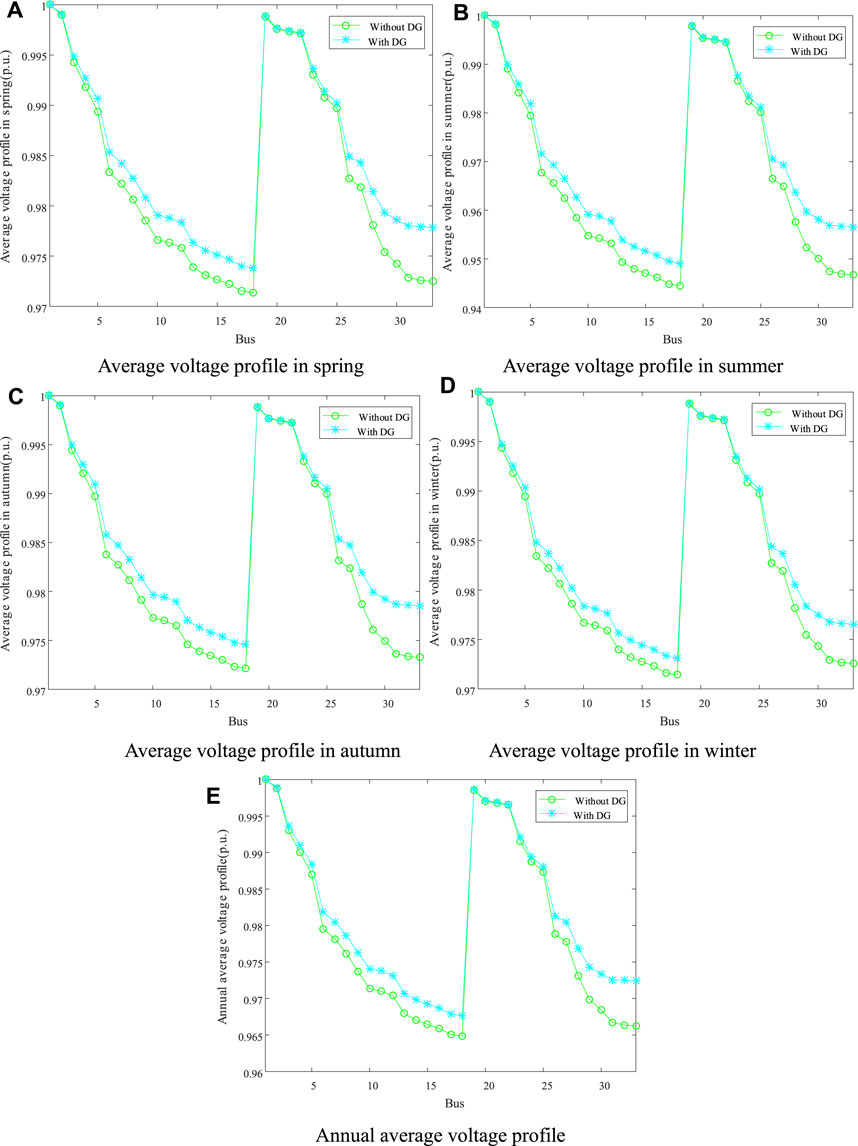
FIGURE 6. Voltage profile improvement of the IEEE 33-bus distribution network. (A) Average voltage profile in spring. (B) Average voltage profile in summer. (C) Average voltage profile in autumn. (D) Average voltage profile in winter. (E) Annual average voltage profile.
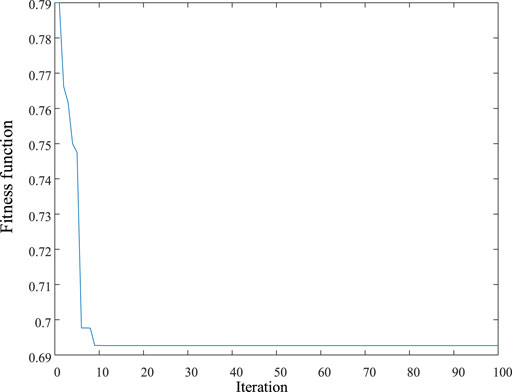
FIGURE 7. Convergence curves.
4.2 IEEE 69-Bus Distribution Networks
In order to further verify the optimization effect of EO on larger and more complex systems, Table 3 and Figure 8 give the IEEE 69-bus distribution network planning scheme and voltage profile, respectively. Table 3 and Figure 8, 9 show that EO still has a strong search effect in systems with larger nodes, which can effectively improve the power loss and voltage profile of the distribution network. It can effectively improve the stability of the system and reduce the emission of carbon and sulfur pollutants, which brings the best comprehensive optimization effect to the distribution network.
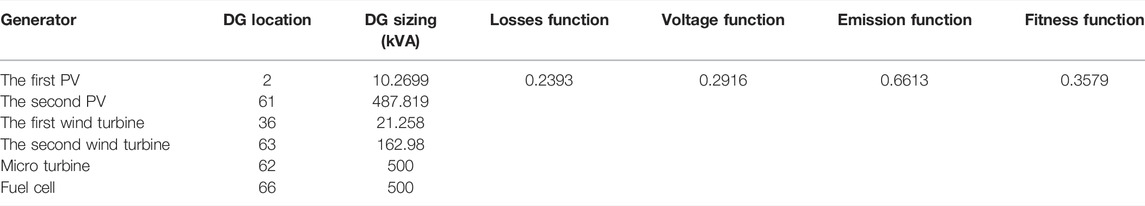
TABLE 3. Optimization results of EO.
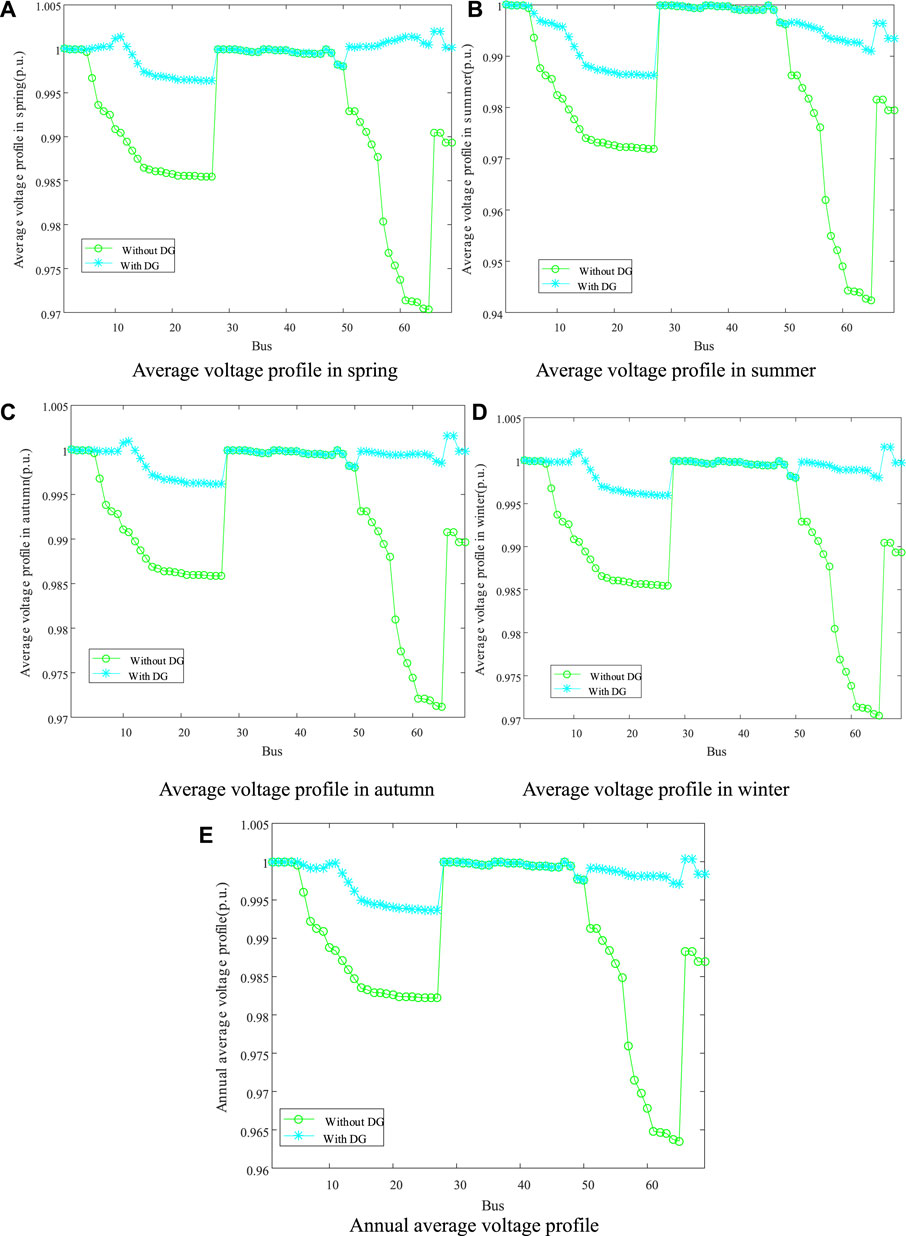
FIGURE 8. Voltage profile improvement of the IEEE 33-bus distribution network. (A) Average voltage profile in spring. (B) Average voltage profile in summer. (C) Average voltage profile in autumn. (D) Average voltage profile in winter. (E) Annual average voltage profile.
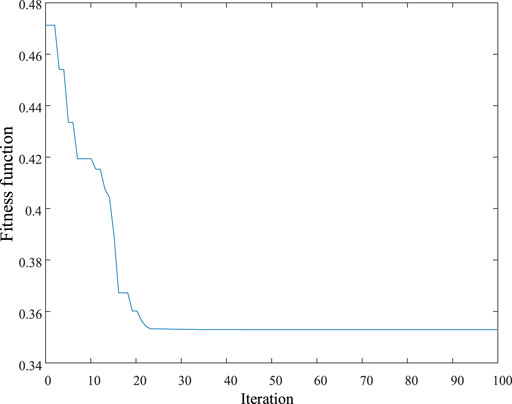
FIGURE 9. Convergence curves.
5 Conclusion
Considering that active power losses, voltage profile, and pollution emission are elements of DG planning, EO is used to solve the problem. Its main contributions are as follows:
(1) The DG planning model, incorporating active power loss, voltage profile, and pollution emission is established. The introduction of pollution emission can effectively reduce carbon and nitrogen emissions in the system.
(2) Through IEEE 33 and 69-bus distribution networks tests, it was verified that EO has strong global search effect and convergence ability and can avoid falling into local optimization under a complex objective function.
(3) After the installation of four DG units, PV system, wind turbine, micro turbine, and fuel cell, the micro turbine and fuel cell are connected to the system to stabilize the output of PV system and wind turbine. Finally, the results show that power loss of the distribution network after EO is significantly reduced, effectively verifying the effectiveness of the algorithm, and significantly improving the voltage profile.
This research does not involve energy storage systems. The assembly of energy storage systems in new energy stations can effectively suppress the problem of fluctuation of output of scenic resources. Therefore, examination of new energy stations equipped with energy storage systems should be a focus of future research.
Data Availability Statement
The original contributions presented in the study are included in the article/Supplementary Material. Further inquiries can be directed to the corresponding author.
Author Contributions
WZ: writing-reviewing and editing; SW: supervision and fundings.
Fundings
The work is funded by National Natural Science Fund of China (62076027).
Conflict of Interest
WZ was employed by Yunnan Provincial Energy Investment Group Co.Ltd.
The remaining author declares that the research was conducted in the absence of any commercial or financial relationships that could be construed as a potential conflict of interest.
Publisher’s Note
All claims expressed in this article are solely those of the authors and do not necessarily represent those of their affiliated organizations, or those of the publisher, the editors, and the reviewers. Any product that may be evaluated in this article, or claim that may be made by its manufacturer, is not guaranteed or endorsed by the publisher.
References
Abu-Mouti, F. S., and El-Hawary, M. E. (2011). Optimal Distributed Generation Allocation and Sizing in Distribution Systems via Artificial Bee Colony Algorithm. IEEE Trans. Power Deliv. 26 (4), 2090–2101. doi:10.1109/tpwrd.2011.2158246
Acharya, N., Mahat, P., and Mithulananthan, N. (2016). An Analytical Approach for DG Allocation in Primary Distribution Network. Int. J. Electr. Power & Energy Syst. 28 (10), 669–678. doi:10.1016/j.ijepes.2006.02.013
Afzalan, E., A. Taghikhani, M., and Sedighizadeh, M. (2012). Optimal Placement and Sizing of DG in Radial Distribution Networks Using SFLA. Int. J. Energy Eng. 2 (3), 73–77. doi:10.5923/j.ijee.20120203.03
Aman, M. M., Jasmon, G. B., Bakar, A. H. A., and Mokhlis, H. (2014). A New Approach for Optimum Simultaneous Multi-DG Distributed Generation Units Placement and Sizing Based on Maximization of System Loadability Using HPSO (Hybrid Particle Swarm Optimization) Algorithm. Energy 66, 202–215. doi:10.1016/j.energy.2013.12.037
Aman, M. M., Jasmon, G. B., Mokhlis, H., and Bakar, A. H. A. (2012). Optimal Placement and Sizing of a DG Based on a New Power Stability Index and Line Losses. Int. J. Electr. Power & Energy Syst. 43 (1), 1296–1304. doi:10.1016/j.ijepes.2012.05.053
Ameli, A., Bahrami, S., Khazaeli, F., and Haghifam, M.-R. (2014). A Multiobjective Particle Swarm Optimization for Sizing and Placement of DGs from DG Owner's and Distribution Company's Viewpoints. IEEE Trans. Power Deliv. 29 (4), 1831–1840. doi:10.1109/tpwrd.2014.2300845
Ben Hamida, I., Salah, S. B., Msahli, F., and Mimouni, M. F. (2018). Optimal Network Reconfiguration and Renewable DG Integration Considering Time Sequence Variation in Load and DGs. Renew. energy 121, 66–80. doi:10.1016/j.renene.2017.12.106
Bikash, D., Mukherjee, V., and Debapriya, D. (2019). Optimum DG Placement for Known Power Injection from Utility/substation by a Novel Zero Bus Load Flow Approach. Energy 175 (15), 228–249. doi:10.1016/j.energy.2019.03.034
Bikash, D., Mukherjee, V., and Debapriya, D. (2020). Optimum Placement of Biomass DG Considering Hourly Load Demand. Energy Clim. Change 1, 100004. doi:10.1016/j.egycc.2020.100004
Chan, D. S. H., and Phang, J. C. H. (1987). Analytical Methods for the Extraction of Solar-Cell Single- and Double-Diode Model Parameters from I-V Characteristics. IEEE Trans. Electron Devices 34 (2), 286–293. doi:10.1109/t-ed.1987.22920
Chandrasekhar, Y., and Sydulu, M. S. M. (2012). Multiobjective Optimization for Optimal Placement and Size of DG Using Shuffled Frog Leaping Algorithm. Energy Procedia 14, 990–995. doi:10.1016/j.egypro.2011.12.1044
Das, B., Mukherjee, V., and Das, D. (2016). DG Placement in Radial Distribution Network by Symbiotic Organisms Search Algorithm for Real Power Loss Minimization. Appl. Soft Comput. 49, 920–936. doi:10.1016/j.asoc.2016.09.015
Faramarzi, A., Heidarinejad, M., Stephens, B., and Mirjalili, S. (2020). Equilibrium Optimizer: A Novel Optimization Algorithm. Knowledge-Based Syst. 191, 105190. doi:10.1016/j.knosys.2019.105190
Gandomkar, M., Vakilian, M., and Ehsan, M. (2005). A Genetic-Based Tabu Search Algorithm for Optimal DG Allocation in Distribution Networks. Electr. power components Syst. 33 (12), 1351–1362. doi:10.1080/15325000590964254
Iqbal, F., Khan, M. T., and Siddiqui, A. S. (2018). Optimal Placement of DG and DSTATCOM for Loss Reduction and Voltage Profile Improvement. Alexandria Eng. J. 57 (2), 755–765. doi:10.1016/j.aej.2017.03.002
Krismanto, A. U., Mithulananthan, N., and Krause, O. (2018). Stability of Renewable Energy Based Microgrid in Autonomous Operation. Sustain. Energy, Grids Netw. 13, 134–147. doi:10.1016/j.segan.2017.12.009
Kumar, S., Mandal, K. K., and Chakraborty, N. (2019). Optimal DG Placement by Multi-Objective Opposition Based Chaotic Differential Evolution for Techno-Economic Analysis. Appl. Soft Comput. 78, 70–83. doi:10.1016/j.asoc.2019.02.013
Meena, N. K., Swarnkar, A., Gupta, N., and Niazi, K. R. (2017). Multi‐objective Taguchi Approach for Optimal DG Integration in Distribution Systems. IET Gener. Transm. & Distrib. 11 (9), 2418–2428. doi:10.1049/iet-gtd.2016.2126
Moradi, M. H., and Abedini, M. (2016). A Novel Method for Optimal DG Units Capacity and Location in Microgrids. Int. J. Electr. Power & Energy Syst. 75, 236–244. doi:10.1016/j.ijepes.2015.09.013
Murty, V. V. S. N., and Kumar, A. (2015). Optimal Placement of DG in Radial Distribution Systems Based on New Voltage Stability Index under Load Growth. Int. J. Electr. Power & Energy Syst. 69, 246–256. doi:10.1016/j.ijepes.2014.12.080
Ogunjuyigbe, A. S. O., Ayodele, T. R., and Akinola, O. A. (2016). Optimal Allocation and Sizing of PV/Wind/Split-Diesel/Battery Hybrid Energy System for Minimizing Life Cycle Cost, Carbon Emission and Dump Energy of Remote Residential Building. Appl. Energy 171, 153–171. doi:10.1016/j.apenergy.2016.03.051
Poornazaryan, B., Karimyan, P., Gharehpetian, G. B., and Abedi, M. (2016). Optimal Allocation and Sizing of DG Units Considering Voltage Stability, Losses and Load Variations. Int. J. Electr. Power & Energy Syst. 79, 42–52. doi:10.1016/j.ijepes.2015.12.034
Ugranlı, F., and Karatepe, E. (2013). Multiple-Distributed Generation Planning under Load Uncertainty and Different Penetration Levels. Int. J. Electr. Power & Energy Syst. 46, 132–144. doi:10.1016/j.ijepes.2012.10.043
Velasquez, M. A., Quijano, N., and Cadena, A. I. (2016). Optimal Placement of Switches on DG Enhanced Feeders with Short Circuit Constraints. Electr. Power Syst. Res. 141, 221–232. doi:10.1016/j.epsr.2016.08.001
Wang, Z., Chen, B., Wang, J., Kim, J., and Begovic, M. M. (2014). Robust Optimization Based Optimal DG Placement in Microgrids. IEEE Trans. Smart Grid 5 (5), 2173–2182. doi:10.1109/tsg.2014.2321748
Yanez-Borjas, J. J., Machorro-Lopez, J. M., Camarena-Martinez, D., Valtierra-Rodriguez, M., Amezquita-Sanchez, J. P., Carrion-Viramontes, F. J., et al. (2021). A New Damage Index Based on Statistical Features, PCA, and Mahalanobis Distance for Detecting and Locating Cables Loss in a Cable-Stayed Bridge. Int. J. Struct. Stab. Dyn. 21 (9), 2150127. doi:10.1142/s0219455421501273
Yang, B., Yu, L., Chen, Y., Ye, H., Shao, R., Shu, H., et al. (2021). Modelling, Applications, and Evaluations of Optimal Sizing and Placement of Distributed Generations: A Critical State‐of‐the‐Art Survey. Int. J. Energy Res. 45 (3), 3615–3642. doi:10.1002/er.6104
Keywords: distributed generation, optimal placement and sizing, equilibrium optimizer, meta-heuristic, power system
Citation: Zhang W and Wang S (2022) Optimal Placement and Sizing of Distributed Generators Based on Equilibrium Optimizer. Front. Energy Res. 10:936566. doi: 10.3389/fenrg.2022.936566
Received: 05 May 2022; Accepted: 06 June 2022;
Published: 16 August 2022.
Edited by:
Yaxing Ren, University of Warwick, United KingdomReviewed by:
Xueqian Fu, China Agricultural University, ChinaXiaoshun Zhang, Northeastern University, China
Copyright © 2022 Zhang and Wang. This is an open-access article distributed under the terms of the Creative Commons Attribution License (CC BY). The use, distribution or reproduction in other forums is permitted, provided the original author(s) and the copyright owner(s) are credited and that the original publication in this journal is cited, in accordance with accepted academic practice. No use, distribution or reproduction is permitted which does not comply with these terms.
*Correspondence: Shuliang Wang, c2x3YW5nMjAxMUBiaXQuZWR1LmNu