- 1State Grid Energy Research Institute Co.,Ltd., Beijing, China
- 2State Grid Jiangsu Electric Power Co.,Ltd., Nanjing, China
- 3School of Electric Power Engineering, Nanjing Institute of Technology, Nanjing, China
With the promotion of the “dual carbon” goal, a large number of distributed photovoltaic power are connected to the distribution network. Since the current operation optimization of the low-voltage transformer district is based on single objectives such as the economy and power reliability, the model is relatively simple and difficult to adapt to the large-scale access of photovoltaics. Therefore, this article comprehensively considers carbon emissions, different load characteristics, and differentiated demand response of the district. An optimization method for low-voltage transformer district operation under the dual-carbon background is proposed. First, the typical structure of a low-voltage transformer district is introduced. Second, the load types and characteristics of the low-voltage transformer district are analyzed, and differentiated demand response models are established for different types of loads. Finally, taking the minimum economic cost and carbon emission as the objective, the low-voltage transformer district operation optimization model considering carbon emission and differentiated demand response is established by considering the voltage overrun of the photovoltaic access point, substation capacity constraint, and carbon emission constraint. The simulation results show that the model can effectively reduce the economic cost and carbon emissions of the low-voltage transformer district, achieve more than 95% reasonable utilization rate of new energy in the low-voltage transformer district, improve the lateral time distribution of load in the low-voltage transformer district, and provide an effective means for low-carbon scheduling of distribution networks.
1 Introduction
In recent years, with the increasingly prominent global environmental pollution problems and energy crisis, General Secretary Xi Jinping proposed the strategic goal of “carbon peaking and carbon neutrality” at the United Nations General Assembly, demanding to reduce the carbon emission level of the distribution network transformer district (Wei et al., 2021). The new energy power generation represented by photovoltaics has developed rapidly. However, with the increase of photovoltaic penetration rate, the coordination of the source and load in the low-voltage transformer district has become more difficult (Zhao et al., 2019). Demand-side response can be used to absorb new energy and improve the interaction between the source and load in the district (Huang D. et al., 2022). Therefore, carbon emissions and demand-side response characteristics should be fully considered in the optimal scheduling of the low-voltage transformer district.
At present, the optimal scheduling of the transformer district mainly focuses on distributed power generation. Ma et al., 2021 proposed a robust optimization planning model for a transformer district considering the uncertainty of photovoltaic intensity and considering the ability of the distribution network transformer district to accept distributed photovoltaics and obtained the best access point and optimal installation capacity of photovoltaics. Al-Ismail, 2020 started from the impact of distributed power generation on the transformer district and analyzed three aspects: distribution network reconfiguration technology, distributed power generation location and capacity optimization, and filter selection and location optimization, and summed up the strategy for optimal operation in the transformer district. Chen et al., 2020 proposed a layered control method for source-load-storage control in the transformer district to achieve optimal autonomy of the distribution network based on the multi-time scale complementary characteristics of controllable distributed power generation, energy storage systems, and loads. Cong et al., 2022 aimed at the volatility and intermittent problems brought by the increase in the installed capacity of photovoltaic power generation to the distribution network and proposed a fault recovery self-healing reconfiguration control optimization strategy for the distribution network based on an improved group search algorithm, which improved the efficiency of the distribution network. Zhang X. et al., 2021 analyzed the calculation method of flexibility provided by each component in the distribution network, established a two-layer optimal scheduling model for the distribution network with distributed photovoltaics considering flexibility, and introduced intuitive fuzzy programming to obtain the comprehensive optimal scheduling scheme. The above literature shows that in the optimal scheduling of the transformer district, taking into account the high proportion of the new energy consumption rate and low-carbon emissions at the same time is of great significance to the flexible resource planning of the transformer district, which is helpful to achieve energy saving and emission reduction in the transformer district.
Demand response is an important means to stabilize the output of distributed power generation and improve the consumption rate of new energy. The influence of demand response should be fully considered in the optimal scheduling of the low-voltage transformer district (Shafie-khah et al., 2019). Some scholars have carried out research on the demand response characteristics of low-voltage transformer districts. Shi et al., 2020 constructed a user DR model based on the elasticity coefficient matrix of real-time electricity prices, analyzed the charging load demand of electric vehicles at the same time, and established a robust optimal dispatch model for an active distribution network. Khalid et al., 2018 proposed an active distribution network that considers demand response; the double-layer collaborative configuration model stimulates the charging and discharging of electric vehicles to reduce the peak-to-valley difference of the load and adapt to the various planning requirements of electric vehicle charging stations. Jin et al., 2020 applied the evaluation of the operation status of the distribution network transformer district based on a fuzzy comprehensive evaluation of the incentive demand-side response and realized the comprehensive optimization of the voltage and load of the distribution network transformer district while reducing the peak load. Zhu et al., 2022 considered the user participation in demand response and established an optimal scheduling model of active distribution based on price and incentive demand response; the model has given full play to the flexibility of demand response. Qiu et al., 2021 used triangular fuzzy numbers to describe the uncertainty of demand response and established a distribution system with the goal of minimum users on the load side and maximum wind power consumption. The network master-slave game economic model achieves the game equilibrium by optimizing the real-time electricity price strategy and demand response strategy. However, the existing related studies have not considered the timeliness of demand response and the impact of different loads, which will make the response resources not fully utilized, making it difficult to achieve the expected effect of district scheduling. At the same time, these studies have not considered the difference in response elasticity coefficient and real-time electricity price among different users, without classification of load types, and the amount of electricity change and price change in the considered price-based demand response is linear, which does not conform to the actual situation and cannot reflect the actual demand response features.
To sum up, in order to deal with the current adverse effects of the countys photovoltaics on the optimal dispatch reliability and economic low-carbon operation of the low-voltage transformer district and make full use of demand response resources to increase the consumption of renewable energy and smooth the load curve at the same time, this article comprehensively considers carbon emissions and differentiated demand response. First, the basic structure of the low-voltage transformer district is introduced. Second, the load types and characteristics of the low-voltage transformer district are analyzed, and a differentiated demand response model is established for different types of loads. Under the conditions of photovoltaic access point voltage exceeding the limit and carbon emission constraints, an optimization model of low-voltage transformer district operation was established considering carbon emissions and differentiated demand response. Finally, the effectiveness of the optimal scheduling model was verified through simulation solutions.
2 Basic Structure of the Low-Voltage Transformer District
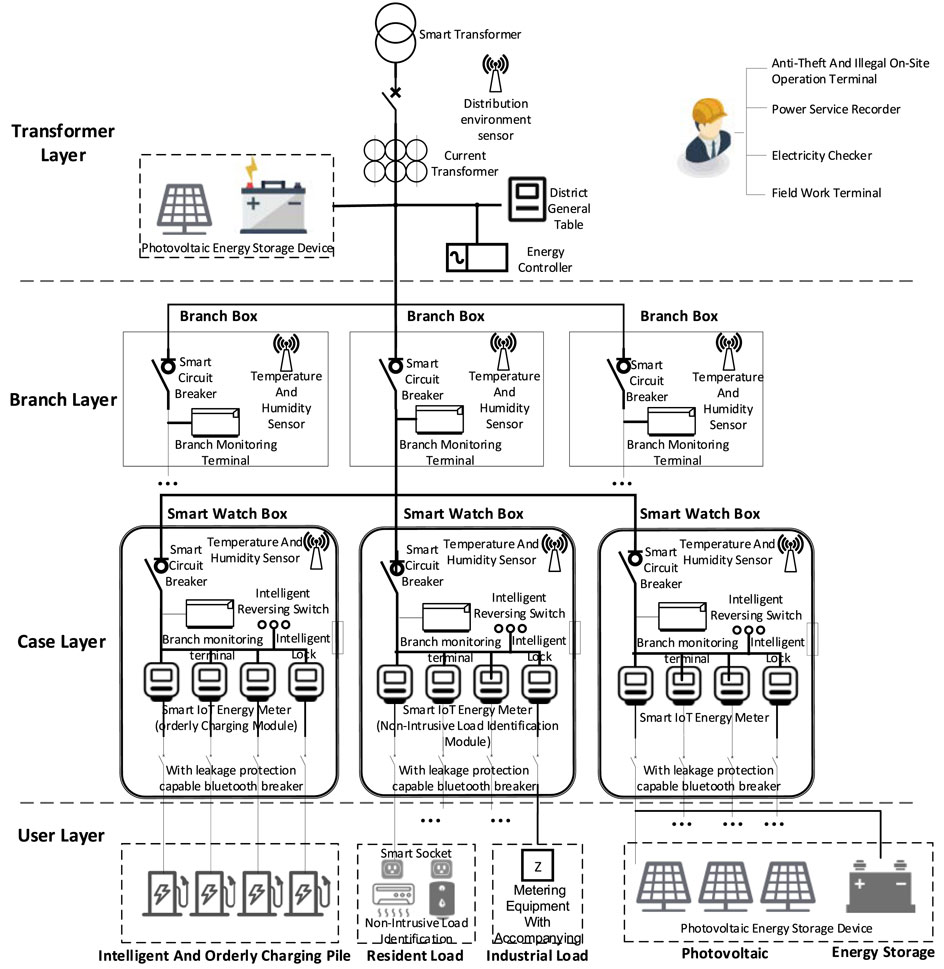
The low-voltage transformer district refers to the 10kV/0.4kV power supply area provided by several distribution transformers. The typical low-voltage transformer district structure constructed in this article is shown in Figure 1.
This low-voltage transformer district is divided into the transformer layer, the branch layer, the casing layer, and the user layer from top to bottom, which can play the function of “connecting the previous and the next” in the construction of the energy Internet. The transformer layer is composed of energy controllers, photovoltaic energy storage devices, and smart transformers. The branch layer includes branch monitoring terminals, environmental sensors, and single-phase intelligent miniature circuit breakers. The casing layer mainly includes smart IoT energy meters, intelligent reversing switches, and smart locks. The user layer includes residential load, industrial load, charging pile load, photovoltaics, and energy storage devices. The district can be used for online automated operations, distributed photovoltaic monitoring, reasonable analysis of the operating status of the platform, extraction of the differentiated behavior characteristics of users in the district, orderly charging of electric vehicles, and response to residential industrial energy consumption and take into account the distributed photovoltaic consumption and carbon emissions in the district, which can effectively promote the district. It is an important guarantee for further attracting investment and construction of low-voltage transformer districts in the future.
3 Differentiated Demand Response Model
The demand-side response mechanism is mainly divided into price-based demand response and incentive-based demand response (Chen et al., 2019). In order to more accurately describe the characteristics of demand response behavior in low-voltage transformer districts, this article considers the classification of loads and adopts differentiated price-based demand response. There are certain differences in the electricity consumption behavior, real-time electricity price, and elastic coefficient of different loads.
3.1 Load Characteristics of the Low-Voltage Transformer District
This article divides the electricity load of low-voltage transformer districts into three types according to the electricity consumption characteristics of them. They are residential electricity load, industrial electricity load, and electric vehicle charging pile electricity load.
The typical low-voltage transformer district electricity consumption category is mainly residential electricity load. This kind of load is not restricted by grid dispatching. The user’s consumption behavior greatly affects the load fluctuation of the low-voltage transformer district. With the popularization of air conditioners, lighting, and other equipment, the impact of climate change and time factors on residential electricity load has become more significant (Meng et al., 2019).
Industrial electricity load is linked to economic factors. The economic situation of the district where the low-voltage transformer district is located directly affects the power consumption level of the industrial load, thereby affecting the growth or decline trend of the load in the entire low-voltage transformer district. In the electricity market, the electricity price is variable. The stepped electricity price and the time-of-use electricity price also show a complex relationship with the industrial load in a low-voltage transformer district (Chau et al., 2018).
The load of electric vehicle charging piles is easily affected by many factors, including the parameters of the electric vehicle itself, the number of charging piles, and many other factors (Zhang Y. et al., 2021). The intraday charging and discharging characteristics of large-scale electric vehicle charging piles will increase the peak-to-valley difference of the load. When the electric vehicle charging piles are connected on a large scale during the peak load period, it is not conducive to the safe and economic operation of the low-voltage transformer district. Therefore, the maximum accessible load of the charging pile is limited by the distribution capacity of the low-voltage transformer district (Tan et al., 2021).
3.2 Differential Price-Based Demand Response
Price-based demand response guides users to actively adjust their electricity consumption habits according to their own electricity consumption through time-of-use electricity prices. In this article, the differential price-based demand response (DPDR) is used to construct a relationship model between the change of load demand and the change of electricity price according to the actual electricity consumption. Introducing power consumption satisfaction can avoid user satisfaction drop due to excessive load response:
In the formula,
In the formula,
The three types of loads in this transformer district mentioned in this article have different proportions in the entire station area, and different types of loads have different electricity price demand balance relationships in different time periods, and there are differences in response elasticity. At present, in the study of price-based demand response models, electricity price differentiation or elastic coefficient differentiation response models are mostly used (He et al., 2021), which are obviously insufficient. However, this article comprehensively considers the load power consumption characteristics of the station area and constructs a different type of load response elasticity according to the difference in response elasticity of different types of loads. A new price-type response mechanism is established based on the electricity price elasticity matrix response matrix that takes into account the differences in classified loads and electricity consumption periods.
4 Intraday Optimal Dispatch Model of the Low-Voltage Transformer District Considering Carbon Emissions and DPDR
This article divides the load side into three types to participate in differentiated price-based demand response when constructing the optimal dispatch framework of a low-voltage transformer district. The power side includes photovoltaic output and grid power purchase. In summary, a low-voltage transformer district scheduling framework considering carbon emissions and DPDR can be constructed as shown in Figure 2. On the premise that the output of each unit in the low-voltage transformer district and the battery charge and discharge meet various constraints, different considerations are considered on the power side and the load side. The output of different types of power sources and the power consumption characteristics of different types of loads are aimed at the lowest total operating cost of the low-voltage transformer district, and the MILP algorithm is used to solve the problem to realize the optimal scheduling scheme of the low-voltage transformer district.
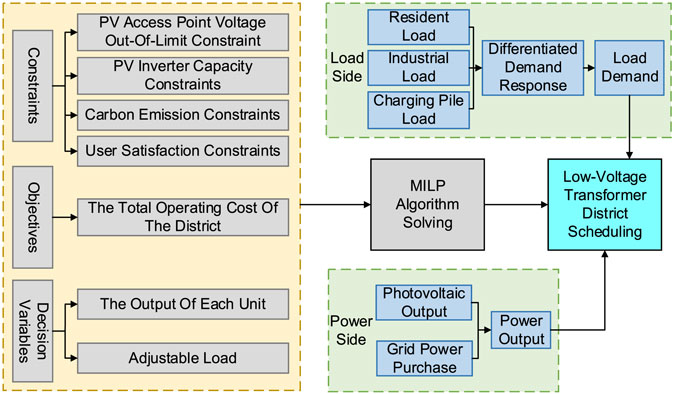
FIGURE 2. Scheduling framework of the low-voltage transformer district considering carbon emissions and differential demand response.
4.1 Objective Functions
In the optimal scheduling of the low-voltage transformer district, according to the forecasted values of photovoltaics and load power, taking into account the carbon emission and DPDR and aiming at the lowest total operation cost of the low-voltage transformer district, the objective function of the operation optimization of the low-voltage transformer district is established as follows:
In the formula,
4.1.1 Power Purchase Costs
In the formula,
4.1.2 Operation and Maintenance Costs
In the formula,
4.1.3 Carbon Disposal Costs
In the formula,
4.1.4 Satisfaction Loss Costs
The user has the most suitable energy consumption in each period, which calls the users baseline load. When the user deviates from the baseline load, there is a satisfaction loss, which is quantified by the following function:
In the formula,
4.1.5 Electricity Sales Revenues
In the formula,
4.2 Constraints
4.2.1 Power Balance Constraint
In the formula,
4.2.2 Constraint on the Receiving Capacity of the Low-Voltage Transformer District
The penetration capacity of distributed photovoltaics affects the operation state of the transformer district. If the penetration rate of photovoltaics is too high, it will have adverse effects on the district, such as power quality degradation (Ma et al., 2021). Therefore, when the distributed photovoltaics are connected to the low-voltage transformer district, it is necessary to consider the receiving capacity of the distributed photovoltaics in the pressing area. The total capacity of the distributed photovoltaics in the access point should not exceed the receiving capacity of the transformer district for photovoltaics. The constraint formula of the admission capacity of the low-voltage transformer district as follows:
In the formula,
4.2.3 Access Point Voltage Violation Constraint
There is a certain error in the forecast value of photovoltaic output, and with the increase of photovoltaic penetration rate, the voltage of the access point has a greater possibility of exceeding the limit (Huang M. et al., 2022). To reduce the probability of voltage overlimit, we set constraints as follows:
In the formula,
4.2.4 PV Inverter Capacity Constraint
During photovoltaic power generation, the photovoltaic inverter provides a certain amount of power to the grid, while maintaining a part of the adjustable ability, and can absorb or emit part of the power to adjust the voltage of the photovoltaic access point (Elkayam and Kuperman, 2019). The total output in the PV inverter must meet the capacity constraints:
In the formula,
4.2.5 Battery Charge and Discharge Constraints
In the formula,
4.2.6 Carbon Emission Constraints
In the formula,
4.2.7 Grid Interactive Power Constraints
In the formula,
4.2.8 User Satisfaction Constraint
In the formula,
4.3 Solving the Algorithm
The low-voltage transformer district operation optimization model established in this article, considering carbon emissions and differentiated demand response includes variables such as power purchase and photovoltaics as well as the charging and discharging states of the battery. It is a nonlinear programming problem. Therefore, the mixed integer linear programming (MILP) method is used to convert into a linear model for solving. The method searches the nodes in the solution space tree, discards the nodes that cannot generate feasible solutions, and searches the child nodes of the live nodes until the optimal solution is found (Zhu et al., 2017). The MILP model established is simulated and solved by calling the Yalmip toolbox and Gurobi solver in Matlab.
5 Simulation Analysis
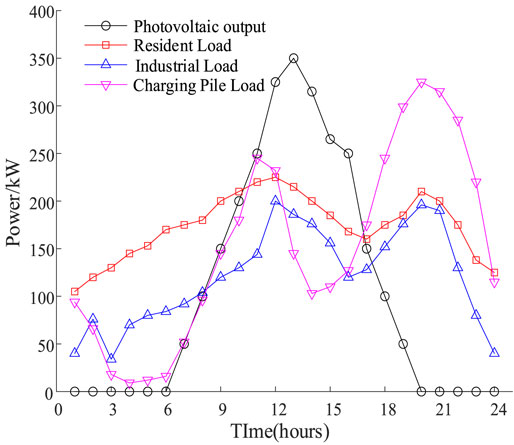
In order to verify the correctness of the optimization model of the low-voltage transformer district proposed in this article, a typical low-voltage transformer district demonstration project in a city is taken as an example scenario. The type of users in the transformer district is analyzed according to the information such as the low-voltage transformer district geographic information, the number of users, and the capacity of the power system. The users in the low-voltage transformer district are divided into residential users, industrial users, and charging pile users. The load of this low-voltage transformer district has a trend of upward translation, showing a certain load characteristic.
5.1 Basic Data
The summary of the calculation example is as follows: the total capacity of the photovoltaic power generation system in the low-voltage transformer district is 2800 kW. The rated capacity of the photovoltaic inverter is 250 kW. The total capacity of the battery is 300 kW. The charge and discharge rates are both 30%. The maximum and minimum charge states are 0.8 and 0.2, respectively. The initial energy storage is 30 kW. The parameters of each element in the calculation example are shown in Table 1. The calculation example takes 24 h before the day as the scheduling period and 1 h as the length of the scheduling period, and the power is constant during the scheduling period. The power consumption on the load side is divided into three periods: peak periods, usual periods, and valley periods. The peak periods are the 10:00–15:00 period and the 18:00–21:00 period; the usual periods are the 7:00–10:00 period, the 15:00–18:00 period, and the 21:00–23:00 period; the valley periods are the 0:00–7:00 period and the 23:00–24:00 period. The time-of-use electricity prices for residential, industrial, and charging pile loads are shown in Table 2. The elastic coefficients of the three types of loads are shown in Table 3. The photovoltaic electricity sales prices are 0.68, 0.4, and 0.11 yuan/(kW ⋅ h) during the peak-to-valley period. The maximum allowable carbon emission in the low-voltage transformer district is 1500 kg.
In order to verify the effectiveness of the operation optimization model of the low-voltage transformer district proposed in this article, three types of load scenarios in two modes are designed for comparative analysis. Mode 1 is the most basic optimization mode, and carbon emissions and demand response are not considered in the dispatch model. Mode 2 is a comprehensive optimization model on the basis of considering DPDR, and carbon emission factors are further considered. Three types of load scenarios are resident load, industrial load, and charging pile load.
5.2 Simulation Results
Figures 4, 5 shows the scheduling results, including the load demand, conventional output, and battery charge and discharge conditions of the three types of load scenarios in different modes.
From Figure 4 and Figure 5, it can be concluded that Mode 1 does not consider DPDR and carbon emissions, and the load of the three types of loads in each period remains unchanged. When the load is in the valley period, the photovoltaic output not only meets the load demand but also charges the battery. When charging to the maximum state of charge, the solar panel may be abandoned in the transformer district. When the load is in the usual period, the state of charge of the battery remains constant, and the load demand is jointly supplied by photovoltaics and power grid purchases. When the load is in the peak period, the photovoltaic output is low. In addition to battery discharge, a large amount of power needs to be purchased from the external power grid to meet the load demand. This model has a relatively high power purchase, a low photovoltaic consumption rate, and a high photovoltaic rejection rate. This operation mode is not conducive to the safe and stable operation of the transformer district and will also increase the economic cost of the transformer district. Mode 2 considers DPDR and carbon emissions. DPDR reduces the load during peak hours and increases the load during valley hours in response to the electricity price. The photovoltaic power generation increases; also, the photovoltaic consumption rate increases, and the economic cost of the transformer district is reduced. In summary, considering demand response and carbon emissions in the optimal scheduling of low-voltage transformer districts can improve the photovoltaic absorption rate and the utilization rate of demand response resources in the transformer district and improve the matching degree of source-load measurements.
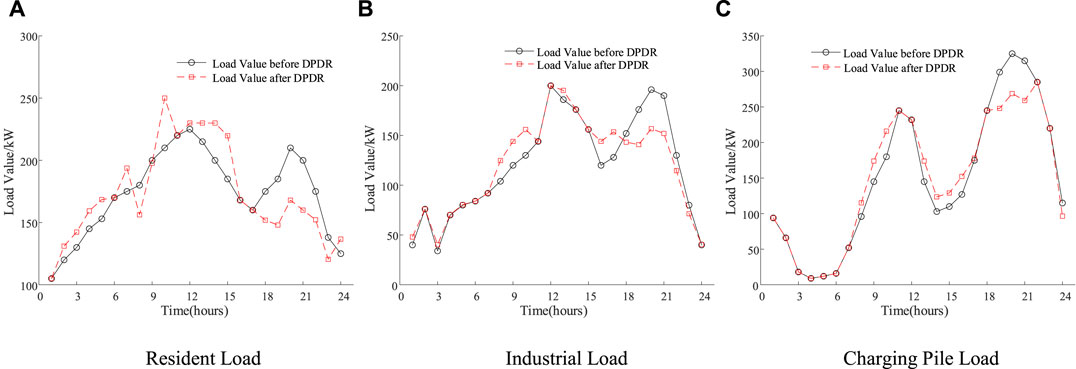
The load comparison curve before and after considering the DPDR is shown in Figure 6, including the load values of the three types load scenarios of users in each time period under the two models.
As can be seen from Figure 6, compared with Mode 1 and Mode 2, the three types of loads in Mode 2 use the elastic change of electricity price to guide the load to transfer laterally in time during the dispatch cycle under the action of DPDR and perform peak shaving and valley filling to reduce the load. DPDR smooths the load curve, reduces the cost of demand response, and provides a guarantee for the stable operation of the low-voltage transformer district.
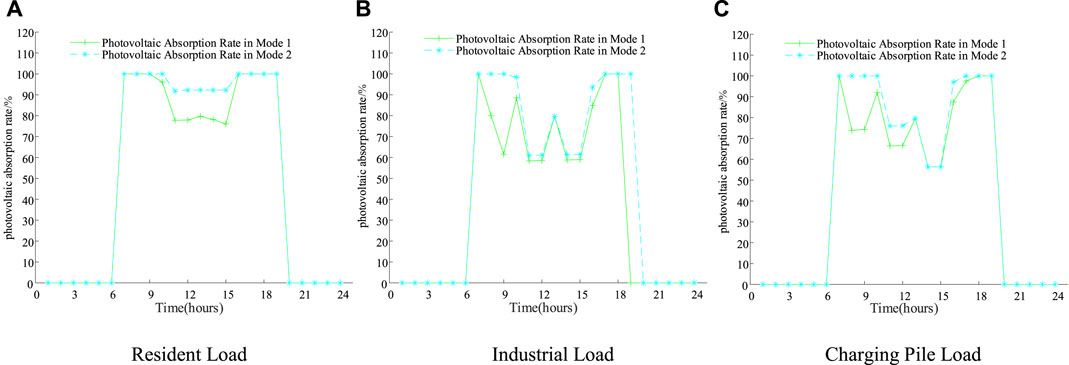
Figure 7 shows the comparison curves of photovoltaic consumption in three types of load scenarios under the two modes.
It can be seen from Figure 7 that the photovoltaic absorption rate of the three types of loads in Mode 1 are only 88.8, 72.8, and 77.7%, the rate is low, and the photovoltaic rejection rate is high. The photovoltaic absorption rate of the three types of loads in Mode 2 compared with that of Mode 1 has improved, reaching 96.1, 82.5, and 84.9%, meeting the requirement of a photovoltaic consumption rate of 80% or more in the low-voltage transformer district. Photovoltaic energy is fully utilized.
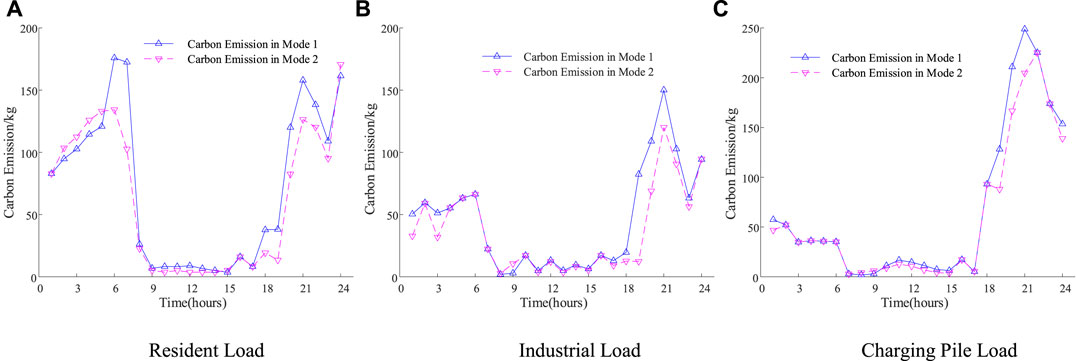
Figure 8 shows the comparison curve of carbon emissions before and after comprehensively considering carbon emissions and differentiated demand response, including the carbon emissions of three types of load scenarios in each period under two modes.
It can be seen from Figure 8 that in Mode 1, the overall carbon emission level of the low-voltage transformer district is relatively high during the dispatch period because the carbon emission factor is not considered. Mode 2 considers carbon emissions in the optimization objective while taking into account carbon constraints. Since the carbon emission of new energy sources such as photovoltaic power generation is very small, the charging and discharging of the battery itself will not produce a lot of carbon emissions, and the carbon emission intensity of external power purchases in the transformer district is relatively high, so it is preferred to use new energy for power generation. The battery will store the excess energy in part of the period for use in the photovoltaic valley period. If the photovoltaic and the battery cannot meet the load demand, the electricity will be purchased from the outside. From the optimization results, it can be seen that in the optimization model of the three scenarios, the photovoltaic power generation increased by 1.0, 0.5,, and 0.6%, the power purchase decreased by 11.7, 20.8,, and 11.0%, and the carbon emissions decreased by 13.1, 18.8,, and 10.7%. It is proved that considering carbon emission targets and constraints in the optimal scheduling of a low-voltage transformer district can reduce the total carbon emissions of the district.
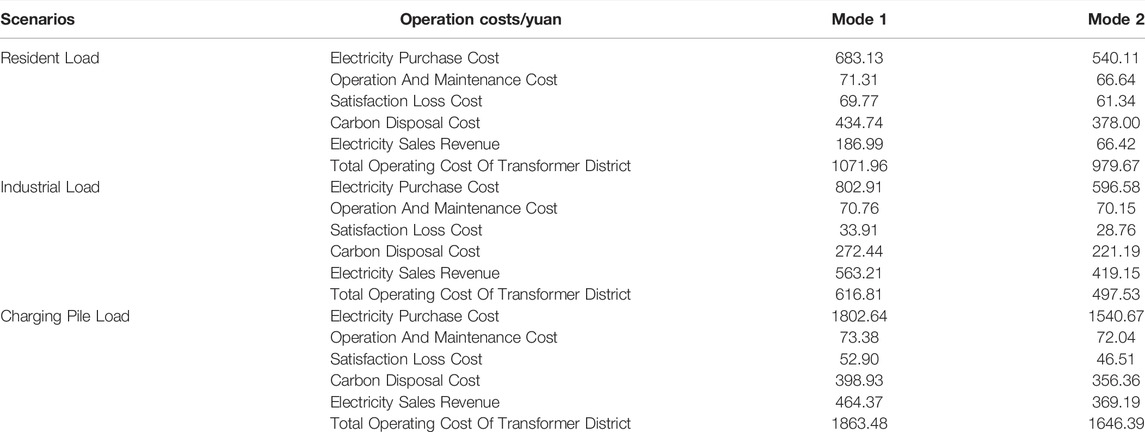
From Table 4, it can be concluded that due to the good economy of DPDR, it has a significant impact on the operation cost of the transformer district, in addition. The dispatch model takes carbon emissions as the optimization target, which reduces the carbon treatment cost of the transformer district and further reduces the total operating cost of the transformer district. Compared with Mode 1, Mode 2 reduces the total operating costs of the three user types by 8.6, 19.3,, and 11.6%, respectively. The scheduling results show that considering carbon emissions and differentiated demand response in the optimal scheduling of the low-voltage transformer district can reduce the total operating cost and carbon emissions of the transformer district, which proves the correctness of the scheduling model.
6 Conclusion
In order to deal with the carbon emission and source-load coordination problems of the low-voltage transformer district under the dual-carbon background, this article takes into account the differences in time-of-use electricity prices and the elasticity of different types of loads and builds a differentiated price-based demand response model. On this basis, considering the carbon emission factor, a low-voltage transformer district optimization model is established with the goal of the lowest total operation cost of the station area, and the MILP method is used to solve the algorithm optimization. The simulation results show that
1) This article proposes a low-voltage transformer district operation optimization method that considers demand response differences and carbon emissions so that demand response resources can be fully utilized, and the output fluctuations of the district are reduced. The optimization method also reduces errors due to PV uncertainty and improves the reliability of the optimal scheduling of the district.
2) The MILP method proposed in this article can efficiently solve the above model, can significantly improve the optimization convergence speed, and has good adaptability to the dynamic environment.
3) The research in this article has important significance for improving the coordination of the source, load, and storage in the low-voltage transformer district. However, this article only considers the differential price demand response and does not consider the incentive demand response. The reliability of optimal dispatch is relatively low. More research is needed in this area in the future.
Data Availability Statement
The original contributions presented in the study are included in the article/Supplementary Material; further inquiries can be directed to the corresponding author.
Author Contributions
DJ designed an optimal scheduling method; YZ carried out experiments; HG and JL analyzed experimental results. YD and GL wrote the manuscript.
Funding
This work was supported by the State Grid science and technology project (5400-202118485A-0-5-ZN).
Conflict of Interest
DJ, HG and JL were employed by State Grid Energy Research Institute Co., Ltd., YZ and ZW were employed by State Grid Jiangsu Electric Power. Co., Ltd.
The remaining authors declare that the research was conducted in the absence of any commercial or financial relationships that could be construed as a potential conflict of interest.
Publisher’s Note
All claims expressed in this article are solely those of the authors and do not necessarily represent those of their affiliated organizations or those of the publisher, the editors, and the reviewers. Any product that may be evaluated in this article or claim that may be made by its manufacturer is not guaranteed or endorsed by the publisher.
References
Al-Ismail, F. S. (2020). Discussion on “A New Formulation of Distribution Network Reconfiguration for Reducing the Voltage Volatility Induced by Distributed Generation”. IEEE Trans. Power Syst. 35 (06), 4974. doi:10.1109/tpwrs.2020.3012366
Chau, T. K., Yu, S. S., Fernando, T., and Iu, H. H.-C. (2018). Demand-Side Regulation Provision from Industrial Loads Integrated with Solar PV Panels and Energy Storage System for Ancillary Services. IEEE Trans. Ind. Inf. 14 (11), 5038–5049. doi:10.1109/tii.2017.2782244
Chen, W., Yan, Y., Kang, M., Chen, Z., Ma, W., and Liu, J. (2020). Generation-Load-Storage Layered Coordinated Control of Distribution Network Considering the Influence of Distributed Generation. Electr. Power Eng. Technol. 39 (05), 113–119. doi:10.12158/j.2096-3203.2020.05.016
Chen, Z., Zhang, Y., Ma, G., Guo, C., and Zhang, J. (2019). Two-Stage Day-Ahead and Intra-day Robust Reserve Optimization Considering Demand Response. Automation Electr. Power Syst. 43 (24), 67–76. doi:10.7500/AEPS20181220001
Cong, Li., Qin, L., and Duan, H. (2022). Research on Reconfiguration of Distribution Network with Photovoltaic Generation Based on Improved Group Search Optimizer. Acta Energiae Solaris Sin. 43 (04), 213–218. doi:10.19912/j.0254-0096.tynxb.2020-0834
Elkayam, M., and Kuperman, A. (2019). Optimized Design of Multiresonant AC Current Regulators for Single-phase Grid-Connected Photovoltaic Inverters. IEEE J. Photovoltaics 9 (06), 1815–1818. doi:10.1109/jphotov.2019.2937386
He, S., Gao, H., Tian, H., Wang, L., Liu, Y., and Liu, J. (2021). A Two-Stage Robust Optimal Allocation Model of Distributed Generation Considering Capacity Curve and Real-Time Price Based Demand Response. J. Mod. Power Syst. Clean Energy 9 (1), 114–127. doi:10.35833/mpce.2019.000174
Huang, D., Wang, X., Yu, N., and Chen, H. (2022). Hybrid Timescale Voltage/Var Control in Distribution Network Considering PV Power Uncertainty[J/OL]. Trans. China Electrotech. Soc., 1–13. doi:10.19595/j.cnki.1000-6753.tces.211188
Huang, M., Zhang, Q., Zhang, S., Yan, Z., Gao, B., and Li, X. (2022). Distribution Network Reconfiguration Considering Demand-Side Response with High Penetration of Clean Energy. Power Syst. Prot. Control 50 (01), 116–123. doi:10.19783/j.cnki.pspc.210284
Jin, P., Shen, Q., Wu, H., and Hu, G. (2020). Evaluation and Treatment of Operational State of Distribution Areas Considering Incentive Demand Response. Electr. Autom. 42 (06), 76–79. doi:10.3969/j.issn.1000-3886.2020.06.024
Khalid, M., Akram, U., and Shafiq, S. (2018). Optimal Planning of Multiple Distributed Generating Units and Storage in Active Distribution Networks. IEEE Access 6, 55234–55244. doi:10.1109/access.2018.2872788
Ma, T., Meng, X., Bai, X., Ge, L., Jia, L., and Zhang, S. (2021). Robust Optimization Planning Method for Distribution Network Considering Large-Scale Distributed PV Access. Power Capacitor React. Power Compens. 42 (02), 183–190. doi:10.14044/j.1674-1757.pcrpc.2021.02.029
Meng, K., Dong, Z. Y., Xu, Z., Zheng, Y., and Hill, D. J. (2019). Coordinated Dispatch of Virtual Energy Storage Systems in Smart Distribution Networks for Loading Management. IEEE Trans. Syst. Man, Cybern. Syst. 49 (04), 776–786. doi:10.1109/tsmc.2017.2690911
Qiu, G., He, C., Luo, Z., Shen, X., Lou, Y., and Zhang, P. (2021). Economic Dispatch of Stackelberg Game in Distribution Network Considering New Energy Consumption and Uncertainty of Demand Response. Electr. Power Autom. Equip. 41 (06), 66–74. doi:10.16081/j.epae.202102021
Shafie-khah, M., Siano, P., Aghaei, J., Masoum, M. A. S., Li, F., and Catalão, J. P. S. (2019). Comprehensive Review of the Recent Advances in Industrial and Commercial DR. IEEE Trans. Industrial Inf. 15 (07), 3757–3771. doi:10.1109/tii.2019.2909276
Shi, W., Lv, L., Gao, H., Li, H., Liu, Y., and Liu, J. (2020). Economic Dispatch of Active Distribution Network with Participation of Demand Response and Electric Vehicle. Automation Electr. Power Syst. 44 (11), 41–51. doi:10.7500/AEPS20190603006
Tan, J., Wang, Y., Ma, Z., Wang, Z., Xu, G., and Sun, G. (2021). Security-Economy Operational Boundary of Flexible District Considering Large-Scale EV Charging Loads. Electr. Power Eng. Technol. 40 (05), 25–33. doi:10.12158/j.2096-3203.2021.05.004
Wei, Z., Pei, L., Chen, S., Zhao, J., and Fu, Q. (2021). Review on Optimal Operation and Safety Analysis of AC/DC Hybrid Distribution Network with High Proportion of Renewable Energy. Electr. Power Autom. Equip. 41 (09), 85–94. doi:10.16081/j.epae.202109039
Zhang, X., Guo, M., Lin, Y., Liang, C., Li, Y., Yang, R., et al. (2021). A Bi-layer Optimal Dispatch Approach for Distribution Networks with Distributed Photovoltaic Considering the Flexibility. J. Electr. Power Sci. Technol. 36 (03), 56–66. doi:10.19781/j.issn.1673-9140.2021.03.007
Zhang, Y., Wang, Y., Li, F., Wu, B., Chiang, Y.-Y., and Zhang, X. (2021). Efficient Deployment of Electric Vehicle Charging Infrastructure: Simultaneous Optimization of Charging Station Placement and Charging Pile Assignment. IEEE Trans. Intell. Transp. Syst. 22 (10), 6654–6659. doi:10.1109/tits.2020.2990694
Zhao, Y., Wu, Z., Qian, Z., Gu, W., Li, D., and Liu, Y. (2019). Distributed Optimal Dispatch of Active Distribution Network Considering Source-Load Temporal and Spatial Correlations. Automation Electr. Power Syst. 43 (19), 68–76. doi:10.7500/AEPS20190423003
Zhu, C., Yang, L., Cui, Y., and Wang, S. (2022). Optimal Scheduling of Active Distribution Network Considering User Participation in Demand Response. Electr. Meas. Instrum., 1–9.
Keywords: low-voltage transformer district, photovoltaic access, load characteristics, differentiated demand response, carbon emission, optimal scheduling
Citation: Jia D, Zhou Y, Wang Z, Ding Y, Gao H, Liu J and Lv G (2022) Optimization for Transformer District Operation Considering Carbon Emission and Differentiated Demand Response. Front. Energy Res. 10:935659. doi: 10.3389/fenrg.2022.935659
Received: 04 May 2022; Accepted: 01 June 2022;
Published: 13 July 2022.
Edited by:
Qinran Hu, Southeast University, ChinaCopyright © 2022 Jia, Zhou, Wang, Ding, Gao, Liu and Lv. This is an open-access article distributed under the terms of the Creative Commons Attribution License (CC BY). The use, distribution or reproduction in other forums is permitted, provided the original author(s) and the copyright owner(s) are credited and that the original publication in this journal is cited, in accordance with accepted academic practice. No use, distribution or reproduction is permitted which does not comply with these terms.
*Correspondence: Ganyun Lv, Z2FueXVuX2x2QG5qaXQuZWR1LmNu
 Dexiang Jia1
 Ganyun Lv