 Intarat Naruemon
 Long Liu
 Qihao Mei
 Yue Wu
 Xiuzhen Ma2
- 1College of Power and Energy Engineering, Harbin Engineering University, Harbin, China
- 2Mechanical Engineering Program, Faculty of Engineering, Thaksin University, Phatthalung, Thailand
- 3Department of Mechanical System Engineering, University of Hiroshima, Higashi-Hiroshima, Japan
In recent studies, it has been established that improvements in the injection rate results in improved mixing, combustion efficiency, and reduced pollutant emissions. Varying injection rates have been observed to find out the optimization injection rate. In this study, split injection with different injection rates was used as the flexible injection to investigate the diesel spray mixing efficiency. Large eddy simulation (LES) was used to investigate the complex diesel mixing processes of unsteady turbulence. The split injection was combined with different fuel injection rates to approximate the ramping-down rate shape. The simulation results of flexible injection rates showed the formation of a highly unstable aerosol vapor structure with the turbulence structure that produces the vortex in the spray area. The powerful injection rates provide a very strong spray turbulence structure and vortex formation. The backflow and vortex are evident when the dwell time of injection is setup. The flexible injection rates have a huge influence on the mixing efficiency of the fuel spray. Basic mixing efficiency predictions revealed that the dwell time of the split injection and inverse injection pressure affect the turbulence structure. Another prediction is that the initial pressure of the injection rate has a significant impact on evaporation and mixing efficiency, even using the same fuel quantity and same condition. The double-rectangular split injection has a slight effect on the spray radial extension, and the spray area grows rapidly while the equivalence ratio is low. The double-drop split injection with a high pressure difference has a great influence on the spray radial extension and spray length. Additionally, the higher injection pressure results in lower equivalence ratios and more efficient mixing.
1 Introduction
At present, there are significant challenges in increasing the mixing efficiency and reducing emissions of diesel engines, for which optimizing the spray formation behavior is essential. Past research has included strategies for improving the efficiency and reducing the emissions of diesel engines, but ultimately the varying injection rates of fuel injection play an important role in improving the new diesel engine. Liu et al. (2015) found that although soot emissions decreased with higher injection times, the combustion efficiency decreased.
Currently, a large amount of research is being focused on improving the injection and injection pattern simultaneously in search of better efficiency of fuel sprays for further effect on mixing and combustion efficiency. Such as Shuai et al. (2009) who suggested from simulation results that the rectangular shape and boot rate geometry can reduce UHC CO and soot emissions. Tay et al. (2017) have supported that the boot injection rate can reduce soot particle size and avoid exchange of NOx and CO, while Knox et al. (2015) have shown that ramp-down injection significantly reduces the equivalence ratio on the axis of the fuel spray. The research by Edzuan Bin Abdullah et al. (2018) and Akiyama et al. (2019) present an inversed-delta injection rate. It shows reduced catch-up, resulting in decreased formation of a rich mixture at the spray tip and enhancing air entrainment in spray (Edzuan Bin Abdullah et al., 2019), supporting fuel–air mixing, thereby enabling good mixing. Liu et al. (2022) developed a spray model to satisfy the diesel spray penetration calculation with different injection rate shapes. The review reveals that there is a fair amount of research into the study of different injection rate patterns on the combustion and emission processes of diesel engines. These research are in line with our previous study (Naruemon et al., 2020) that found the injection rate pattern had the highest initial injection, and it gradually decreases with ultrahigh injection pressure showing the best spray mixing efficiency, which is of the same shape as that of the boot, ramp-down, and inversed-delta injection rates. This shows that the injection rate pattern has a significant influence on the spray efficiency, especially the injection rate with a high initial injection and the unsteady injection rate, but most of the research is still on the general continuous injection rate. And research on the influence of injection rate determination on the dynamic behavior of fuel particles in the spray mixing process are relatively less, with most of it being limited to the typical injection pressure and single-injection rate. Therefore, the study of the flexible injection rate and behavior of the fuel spray process to gain a deeper understanding is much needed.
Using the split injection can represent varying injection rates. Past research has developed a split injection strategy by optimizing the injection time and fuel mass. Research by Cung et al. (2015) and Moiz et al. (2016) presented that those split injections can show a strong interaction between the previously injected combustion jet and the impending cold spray, giving this reaction a strong influence on the ignition process and emissions for the split injection. In addition, Skeen et al. (2015) found that the first injection combustion causes higher temperature gas entrainment, increases pressure and local temperature, creating good conditions for the earlier start of the second injection (Bolla et al., 2017). Although past research have shown that a split injection strategy had been developed, it still uses a general injection rate. Therefore, using split injection can offer a new injection shape that decreases the fuel injection mass post injection, which can represent the high initial injection of varying injection rates. Zheng et al. (2015) found that adopting the pilot injection close to the main injection can effectively reduce the peak of the premixed heat release rate and the maximum pressure rise rate. The pilot main moment had a more pronounced effect on smoke than the pilot injection rate, and smoke emissions decreased as the main pilot period increased. Longer main post-injection interval results in lower heat release rates and longer combustion times, while the post-injection rate had little effect on the post-injection start-up of ignition. Smoke emissions increase first and then decrease with time after retardation post injection.
In addition, our previous study (Naruemon et al., 2020) had found that the injection rate with ultrahigh injection pressure showed greater influence on diesel mixing behavior. In recent years, ultrahigh injection pressure has been widely discussed, such as in the study by Yu (2019) in the atomization of fuel spray using experimental methods under ultrahigh injection pressure in the range of 200–350 MPa. The results showed that the increased fuel injection pressure had an impact on the evolution of aerosols and the penetration of the spray tip was faster and the induced shock waves appeared more clear. Jia et al. (2017) studied an experiment with an injection pressure of 300 MPa and showed that when the injection pressure was higher, a smaller shock wave angle was observed and the Sauter mean diameter (SMD) of the spray was smaller. Yu et al. (2019) who studied diesel injection with an injection pressure of 350 MPa confirmed that under ultrahigh injection pressure conditions, the SMD of all droplets was significantly smaller. In addition, Yu et al. (2017) conducted both experimental and simulated studies of the spray characteristics at an injection pressure of 240 MPa. The results showed that an increase in the vortex at the lower part of the spray was effective in improving atomization. The aforementioned research found that for diesel engines, ultrahigh injection pressure results in a higher spray mixing efficiency. However, there is still a lack of research on ultrahigh injection pressure of intermittent and nonconstant injection rates, hence this study is challenging research of various injection rate patterns with ultrahigh injection pressures. Although the challenge of determining the ultrahigh injection rate is a big problem, the newly developed fuel injection technology has been capable of controlling the injection pressure precisely and generating very high injection pressures. The study by Wang et al. (2019) showed that with ultrahigh voltage test settings, initial testing of the high-pressure system can produce a maximum pressure of approximately 870 MPa.
The current technology can precisely control the injection volume and injection pattern. Hence, controlling a wide range of injection patterns is possible here. Although the fuel injection rate shaping strategy is highly efficient, using a high injection pressure rate and dividing very short injection intervals also presents challenges in itself. According to the author’s knowledge, it can be said that there has not yet been a detailed analytical study of the varying injection rates with ultrahigh injection pressure and short injection duration in terms of the effect on fuel particle dissociation and mixing efficiency, especially the split injection with different injection patterns.
The existing research on the development and improvement of diesel engine performance is often studied in the performance of the entire system of combustion in diesel engines. There have been few studies looking at controlled combustion chamber areas. Diesel spray behavior is the key to mixing and combustion efficiencies, and the diesel spray mixing behavior is very complex and difficult to investigate. Thus, studying such behavior remains challenging. In addition, although there are many studies of technologies for improving and developing diesel engines from past research, the study of diesel spray through a detailed study of the spray behavior, such as breakup, evaporation, turbulence, and mixing, remains limited and has not been studied. The injection rate shape did not determine which shape was the best injection rate shape. Therefore, it is attractive to study the spray behavior to find the most effective new injection rate shaping strategies.
In order to fill in the gaps in the past research, the authors foresee that varying injection rates are influential and significantly effective for mixing and combustion control, but there remains a challenge in shaping complex injection rate patterns. The split injection strategy also plays an important role, no less. Past research that was aimed at the astonishing ability of the injection rate, with a high initial injection rate, offers great difference and excellent performance. In addition, the ultrahigh injection pressure has a great influence on the diesel mixing behavior. Here, split injections are used to represent a variable injection rate. In addition, split injection strategies are created with different injection rates to present a flexible injection pattern that is attractively representative of the varying injection rate studies, and all study conditions of newly flexible injection patterns were using ultrahigh injection pressure. This study applies the concept of using split injection with different injection patterns to improve the spray mixing and combustion efficiency of the diesel engine. However, the spraying and mixing behavior remain a challenge for researchers, and there is a great need to study them in detail.
This article studies the spray formation behavior to understand the spray history with an emphasis on the effect of injection pattern and dwell time on the turbulence structure. In order to consider these phenomena, it is necessary to have a study technique that can study the patterns of multiphase aerosol turbulence that occurs during spraying. We propose a multiphase spray investigation using numerical simulation of the LES model. By this method, it is possible to display the results of different states during the process (liquid and vapor). Matheis and Hickel (2018) showed that the LES model can create a multicomponent model of high-pressure fuel injection, and the study of the vortex flow evolution and fuel cavitation of Piscaglia et al. (2021) showed that the LES model simulations can show the formation of an unsteady vapor structure that agrees with the experimental data. Therefore, in this study, the model created can not only predict the spray area and aerosol dispersion but also be a suitable model and predict the collision effect of aerosols. The created LES model was validated with the baseline information from ECN (Anonymnous, 2021). Finally, the numerical results have been compared quantitatively and qualitatively. The findings of this study are expected to provide useful insights for the injection rate setting of future trials aimed at improving the diesel fuel mixing efficiency.
2 Methodology and numerical methods
The study used numerical simulations to study the behavior of spray and diesel mixing. This study’s approach involved using the LES model in conjunction with the KH-RT model under basic conditions ECN Spray A. The SGS was built using the dynamic structure model. The generated model was used to analyze the spray turbulence structure in the spray behavior to analyze the influence of different flexible injection patterns.
2.1 Spray modeling
The spray of diesel engines is characterized by a short liquid core and rapid atomization. Hence, from the point of view of the modeling of calculation, the fuel (n-dodecane) is injected in a cylindrical volume geometry with the initial droplet size distribution to determine the drips those separate from the upstream wall, then allowing an upstream hot ambient entrainment.
The present study uses the KH-RT model for droplet secondary breakup. The KH-RT model is a hybrid method consisting of the KH wave model and RT, the instability of normal acceleration to the droplet surface. The KH mechanism considers droplets to be liquid jets that have been stripped after being injected into the gas environment, while the RT mechanism is driven by changes in density in the normal direction of the liquid–gas interface. The KH model based on the disruptive growth rate
where
where
2.2 Spray turbulence interactions
The effects of turbulence distribution on spray droplets are significant in engine spray simulation, such as the penetration of liquid and vapor, which are important spray parameters. This study presents in detail the characteristics of the spray flow fields to study the influence of the injection pattern on spray behavior and vortex formation produced from overlapping flow motions. Backflow movement occurs in cases of suspension of injection pressure and injection pressure changes interfere with the surrounding gas pressure. The distribution of fuel and the evolution of vortex with counterflow and radial expansion were investigated. The calculation of turbulent distribution uses velocity fluctuations in each direction of coordinates obtained from the Gaussian probability function, as detailed in Xin et al. (1998). The turbulent distribution of spray droplets is incorporated through a stochastic calculation of drag force fluctuations in droplets. In the context of the LES method used for dispersion caused only by sub-grid turbulence scales when the dispersion caused by the large eddies is captured by the drag force calculated by considering the calculated fluctuations in the velocity that corresponds to the large structure.
3 Computational setup
In this work, the “CONVERGE” CFD software version 2.4 was used to simulate the spraying and atomization of a constant volume combustion chamber as shown in Figure 1. Based on the independent analysis of the mesh, it has been found that the grid size setting should be less than or equal to 125 μm because determining the size of the grid must consider the surrounding context, which is necessary to consider the size of the nozzle diameter. The use of fine grid sizes in the spray appearance area is required as are the rough grids in the noncritical areas (areas without spray presence) to reduce the cost of computation.
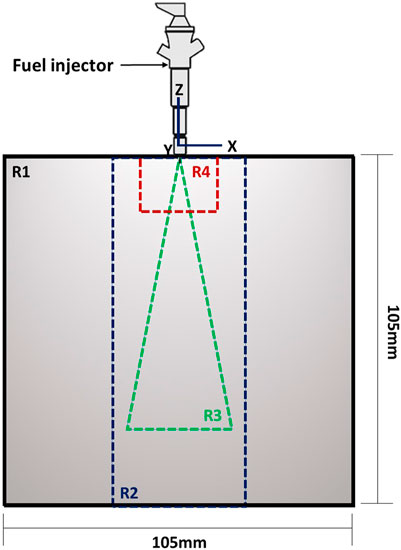
FIGURE 1. Geometry characteristics of the combustion chamber and computational domain of the studied LES.
In this study, the mesh is independent. The simulation results concluded that different grid sizes have a minimal impact on spray penetration when the mesh size of the model created is independent. The finest cell size (125 μm) covers a 15-mm gap between the nozzle and downstream to ensure sufficient resolution in the position where the mixing density takes place, and the rest of the vapor penetration region is set up with a cell size of 250 μm. The computational domain of the studied LES is separated into a mesh with different levels of cell sizes. The adjustment layer is specified with R1, R2, R3, and R4 as shown in Figure 1, which corresponds to the cell sizes 4,000, 2,000, 250, and 125 μm, respectively. The separate domains correspond to the volume of the experimental combustion vessel at the Sandia National Laboratories, which consists of approximately 1.9 million hexahedral cells. The time step in all cases is set to 10 ns.
The spray characterization study was performed using the KH-RT breakup model in conjunction with LES. The modeling and constant values of the numerical parameters used in the fuel injection simulations model are shown in Table 1. The selected values shown in Table 1 are relevant to the initial knowledge of the spatial data on the primary breakup and droplet formation.
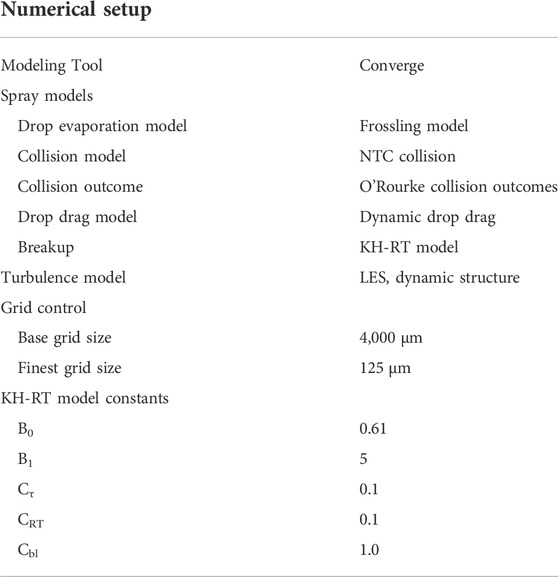
TABLE 1. Modeling and constant values of the numerical parameter.
The current work analyzed different injection rates, while the relationship between the spray cone angle and injection pressure was discussed in our previous work (Naruemon et al., 2020). However, this study used a constant fuel injection quantity and injection duration time for all case studies, therefore the same input data of spray cone angle was used (21°).
4 Results and discussion
4.1 Model validation
To clarify the performance of the model, the generated model was examined under basic ECN Spray A experimental conditions as shown in Table 2. At first, the different ambient temperatures were considered to study the spray formation behavior when the reaction rate varies due to different temperatures, and next, the different injection pressures were considered to study the spray penetration behavior when the velocity rate varies due to different pressures.
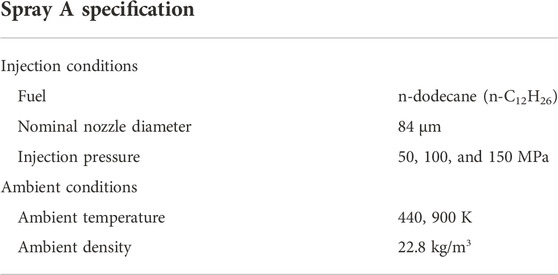
TABLE 2. Operating conditions are based on Spray A from the ECN website.
Current calculations are performed by liquid n-dodecane, injected from a nozzle hole into the combustion vessel with the ambient gas composition: N2, 89.71%; CO2, 6.52%; and H2O, 3.77% under thermodynamic conditions.
Figures 2, 3 show the spray behavior of the simulation result as compared with the experimental data of 440 and 900 K ambient temperatures, respectively. The results in Figure 3 reveal that the simulation result of the spray shape was narrower than the experimental results, but turbulence waves and expanding spray appears to be a real phenomenon. The dispersion density in Figures 2, 3 tend to match the experimental results. It can be stated that the created model is efficient in providing a spray formation behavior capable of displaying an interesting turbulence structure, as well as in presenting the swirling and spray flow.
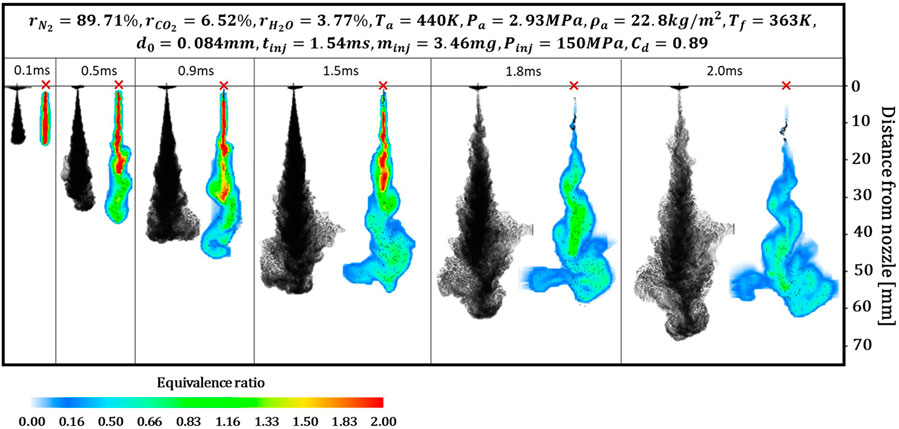
FIGURE 2. Spray shapes and equivalence ratio histories at 440 K ambient temperature.
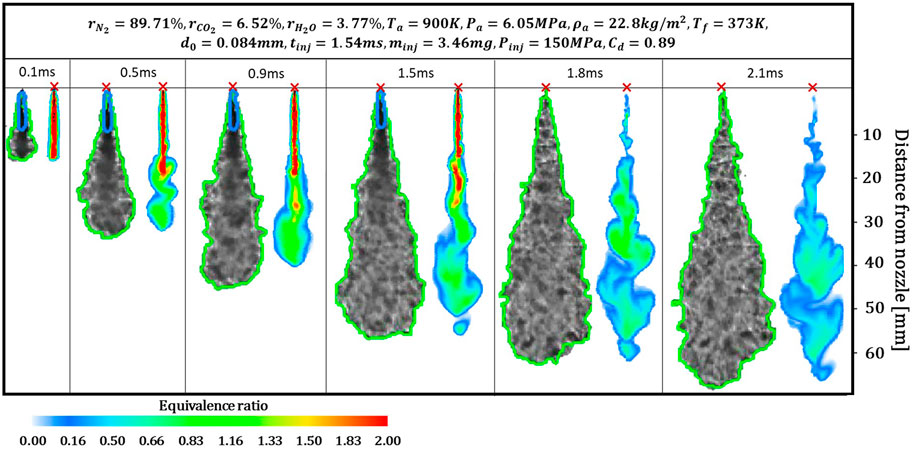
FIGURE 3. Spray shapes and equivalence ratio histories at 900 K ambient temperature (injection pressure, 150 MPa).
In addition, Figure 4 shows the higher deviation of spray penetration length at an ambient temperature of 440 K than at an ambient temperature of 900 K when compared to the experimental data, while the experimental data remains almost the same in both cases. However, in reality, in cases with the same injection pressure but different ambient pressures, the lower ambient pressure should result in longer spray penetration, which is consistent with the simulation result in this study. The initial injection demonstrated that both cases correctly captured the initial ramp for spray penetration. These findings indicate that the generated model performed well in spray simulation under a variety of ambient temperature conditions.
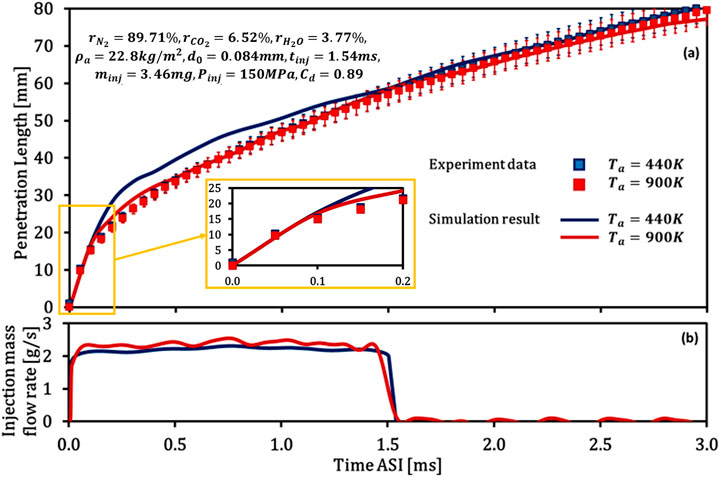
FIGURE 4. Spray penetration under different ambient temperatures. (A) Spray penetration and (B) injection mass flow rate.
To ensure that the generated model was effective enough, this study validates the model with three different injection pressure conditions as shown in Table 2. The comparison results of the spray behavior and the equivalence ratio histories of injection pressure 150, 100, and 50 MPa conditions are shown in Figures 3, 5, 6, respectively. The results of the comparison show that the spray shape and turbulence characteristics matched those of the experimental data. Although the spray width and spray penetration length do not match 100%, the simulation results can show clear transient turbulence of the spray structure since the nozzle exit includes the backflow and vortex formations.
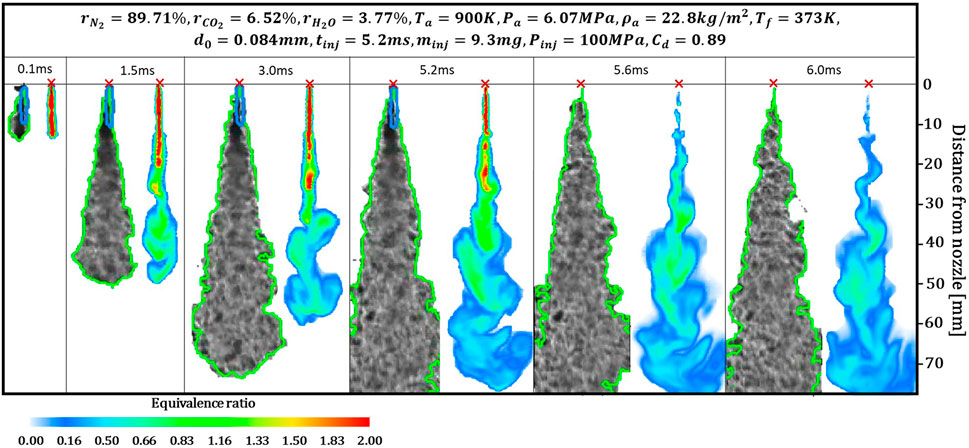
FIGURE 5. Spray shapes and equivalence ratio histories of case injection pressure: 100 MPa.
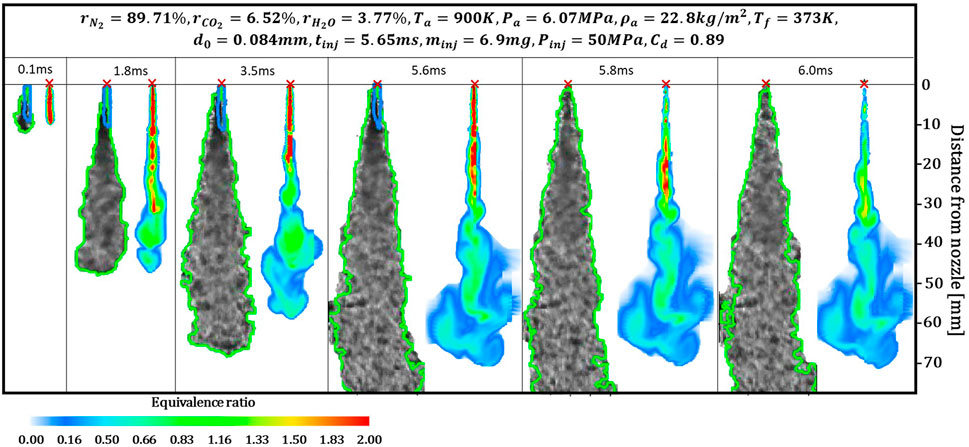
FIGURE 6. Spray shapes and equivalence ratio histories of case injection pressure: 50 MPa.
Figure 5 shows that the simulation results of the vapor penetration are shorter than the experiment data, starting from injection time 3.0 ms, while Figure 6 shows that vapor penetration results are shorter than 3.5 ms. However, the overall simulation results of the different injection pressures show good agreement with the experimental data; in particular, the results of the injection pressure 150 MPa condition (Figure 3).
In addition, Figure 7 compares the spray penetration length under various injection pressure conditions. It can be seen that the spray penetration length at injection pressure 150 MPa shows good simulation results, while the injection pressure 100 and 50 MPa are in good agreement with the experimental data at the start of injection. These results can be explained by the spray transient turbulent formation using different cell size layers. Such a design produces poor simulation results for longer injection duration cases while producing excellent simulation results for the short injection duration cases. This is because the spray usually disperses near the nozzle exit shortly after injection begins. When spray expands due to turbulence structural waves and move downstream, it implies that these phenomena must take time and adjust the grid size level. For longer injection durations, such phenomena might result in simulation performance errors. The discrepancy result was a model error after the end of the injection approximately twice the injection duration of the case of injection pressure 150 MPa. Therefore, the model created was effective enough to predict spray behavior both during the injection process and after the end of the injection at no more than the estimated 3.0-ms injection duration time.
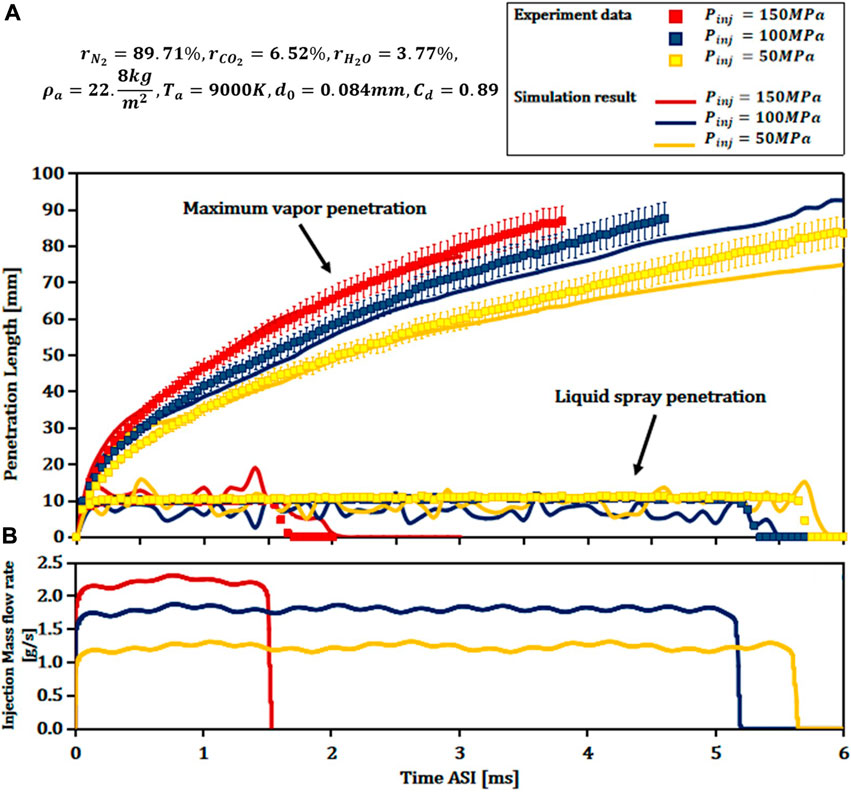
FIGURE 7. Spray penetration of different injection pressures. (A) Spray penetration and (B) injection mass flow rate.
It has been observed that the LES could obtain a temporary spray structure in relation to the fractional distribution of the mixture, temperature, and pressure. The simulation results of the LES model showed the momentum exchange behavior between the hot gas in the combustion chamber and the spray injected more clearly than the simulation result of the RANS model from our previous study (Naruemon et al., 2020). More importantly, the LES can capture multiple spray change points, and the LES can depict turbulence waves of the shear force at the interface between the fuel spray and the surrounding air. The next section presents the characteristics and behavior of the flow and mixing patterns of fuel sprays with different injection patterns.
4.2 Effect of injection rate
This study examines the effect of the injection rate on spray behavior. Before going any further, it is worth clarifying that since there is no oxygen concentration in all study cases. This study analysis only considers fuel mixing with gas flow, and the intensity shown is the fuel density. This section examines the study condition operation under the same conditions with the experimental conditions of the ambient temperature of 900 K and injection pressure 150 MPa.
Figure 8 shows five different injection patterns, where RECT represents the typical fuel injection pattern, QIGD represents the peak injection rate at initial injection duration as in our previous study (Naruemon et al., 2020). The 2QIQD represents the same injection rate as that of the QIQD but is divided into two injections (t1st0.77 ms/tdwell0.30 ms/t2nd0.77 ms) to represent the split injections, while the L2RECT represents the 2QIQD represents the two rectangular injection rates (t1st0.80 ms/tdwell0.30 ms/t2nd0.44 ms) to study the different injection patterns, and the two rectangular injection rates of the H2RECT are the same as those of the L2RECT (t1st0.77 ms/tdwell0.30 ms/t2nd0.47 ms) but have larger differences between the first and second injection rates to study the effect of the initial pressure. The L2RECT and H2RECT injection rates shape the injection rates to study the influence of the initial injection rate. The injection rates of the L2RECT and H2RECT were clearly different from the first injection rate, where the L2RECT injection rate has a lower first injection rate than that of the H2RECT injection rate. The injection duration of RECT, QIGD, L2RECT, and H2RECT are the same (1.54 ms), while the injection duration of the 2QIQD was set at 1.84 ms. In this study, the RECT, QIGD, L2RECT, and H2RECT injection rates used the same injection duration and the same injection quantity in all cases, with just differences in the setting of the injection rates. This is because the timing and amount of fuel injection are often the important factors in engine control. The main purpose of this research is to study the influence of different fuel injection rates. Therefore, setting the same fuel injection timing and amount in all cases is an effective control variable for studying the influence of the fuel injection rate. In addition, different injection patterns were employed at different peak injection pressures. Peak injection pressures were set at 150, 600, 600, 266, and 470 MPa for the RECT, QIGD, 2QIQD, L2RECT, and H2RECT, respectively. However, although the maximum injection pressure of 600 MPa exceeds current technology, the review shows that creating ultrahigh pressure fuel injection is practical. We also calibrated and validated the spray model using experimental data with different injection pressures. We concluded that the generated model could predict spray behavior when injection rates and injection pressures change. Hence, five injection patterns were used to study the influence of flexible injection on spray behavior and the spray mixing process.
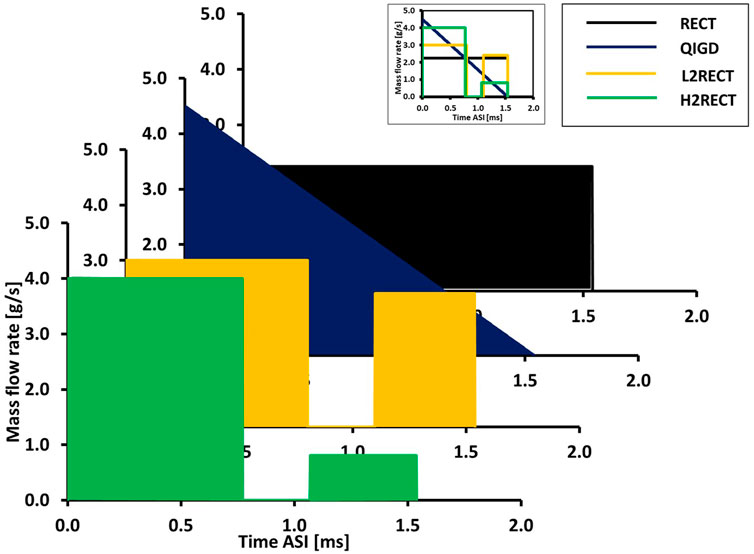
FIGURE 8. Varying injection patterns.
4.2.1 Influence of initial injection rate
Although past research have shown interest in different injection rates in groups of the boot, ramp-down, or even inversed-delta injection patterns those represent high initial injection rates, most of the past research had been focused on the general injection rate with normal injection pressure. In this study, interest has been shown in studying the short injection rate with ultrahigh injection pressure to find out outstanding advantages of the new flexible injection rate. This section presents the results of a comparative study of the RECT and QIGD in understanding the influence of the initial injection rate.
The TKE of RECT and QIGD are compared in Figure 9. It can be seen that the TKE of QIGD is higher at the start and gradually decreases until it is equal to the TKE of RECT, while the TKE distribution behavior of the QIGD is significantly larger. This is because the ultrahigh injection pressure of the QIGD causes a lot of turbulence in the spray field.
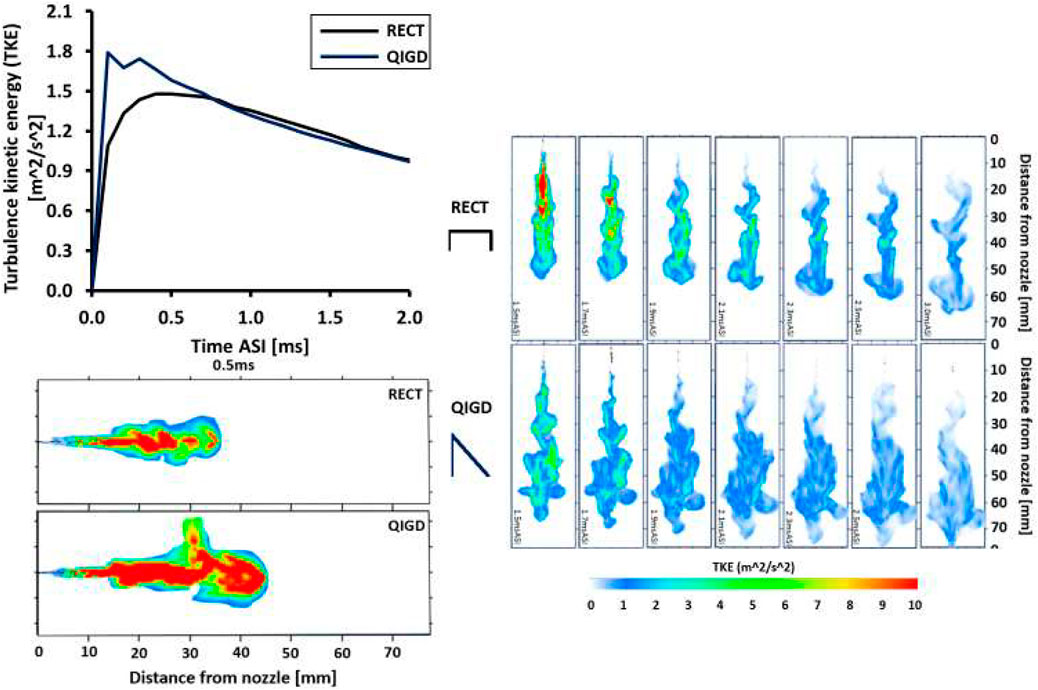
FIGURE 9. TKE values and TKE distribution for RECT and QIGD.
In addition, Figure 10 shows that the fluid penetration distances are similar in both cases, although there was a very high change in injection pressure at the start, while the vapor behavior of the QIGD expands wider and longer with higher injection pressure. The QIGD with ultrahigh initial injection pressure also represents the equivalence ratio behavior that quickly dilutes and distributes, as shown by the direction of dispersion by the influence of velocity on the velocity arrow vector. This means that the gas mass flow rate can be increased as the injection pressure increases.
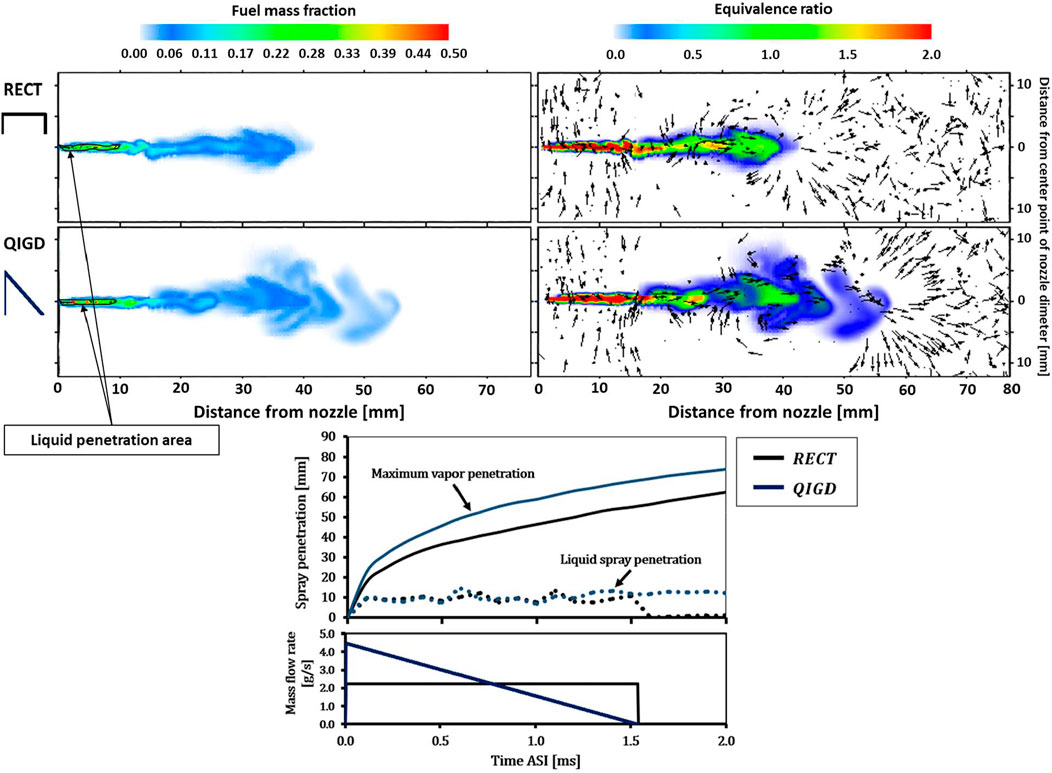
FIGURE 10. Comparisons of distribution of liquid, fuel mass fraction, and equivalence ratio at 0.9 ms ASOI, and spray penetration of RECT and QIGD.
Figure 11 shows that the QIGD has a bigger spray area and spray angle than that of the RECT. The spray area at the section near the nozzle exit shows a small spray angle. This is because increasing the injection pressure increases the radial speed from the ambient gas retention, the spray area quickly moves to the center and the spray tip, which causes a larger expansion of the spray tip. This section shows that the ultrahigh initial injection pressure influences the terms of spray spread and turbulence.
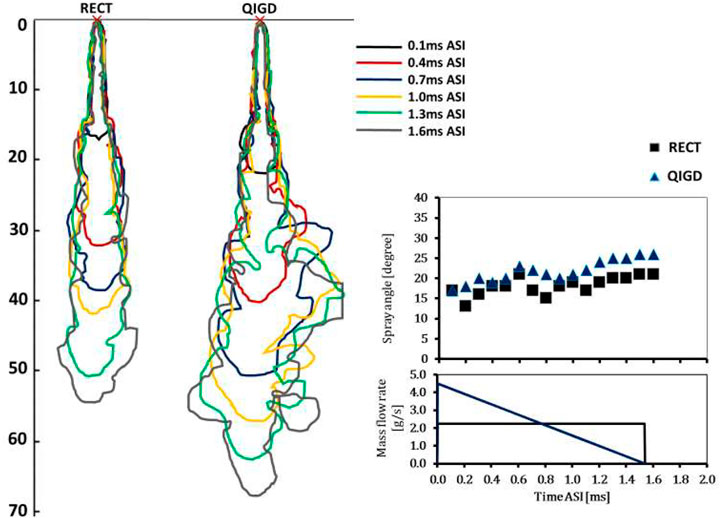
FIGURE 11. Comparisons of spray area boundaries and spray angle of RECT and QIGD.
4.2.2 Influence of split injections
The varying injection rates are an important effective strategy for controlling mixing and combustion efficiency, but there are still limitations in the formulation of various injection rates. Therefore, the split injection strategy has emerged as the leading option that can serve this purpose. The split injection strategy can offer increase–decrease injections to create varying injection rate patterns. In this section, the QIGD and 2QIQD were examined for the effect of split injection.
The simulation result in Figure 12 shows that the spray penetration of QIGD and 2QIGD has different shapes due to the effect of the split injections. Figure 12 shows that after the dwell time (1.3 ms), the spray behavior of the 2QIGD injection rate case shows a velocity vector with a reverse direction of spray flow. This is because the fuel pressure is weakened during the dwell time of injection, causing the surrounding gas pressure to beat the injection pressure, demonstrating the potential for eddy current formation, causing the air entrainment and formation of a spray mixing, which causes the faster dilution equivalence ratio. It can be said that this behavior will complete the mixing process faster.
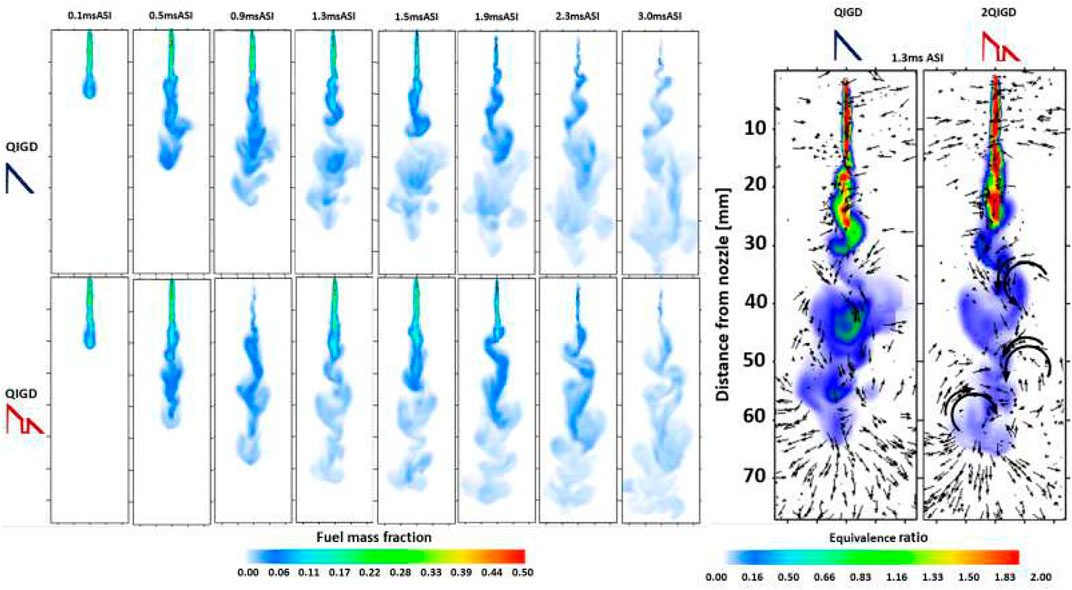
FIGURE 12. Fuel mass fraction history, equivalence ratio history, and velocity vector of QIGD and 2QIGD.
In addition, Figure 13 shows that the liquid phase is only available in a small area near the nozzle for both shapes, a phenomenon attributed to an increase in the injection pressure. Meanwhile the 2QIGD shows higher TKE values due to the dwell time. Clearly, with double injection, the temperature absorbing is increased due to the local temperature absorption that the second spray is affected by the previous injection, where the second injection penetrates through the preexisting environment, greatly reducing the resistance of the second injection, causing the faster increase of the axial velocity for the second spray.
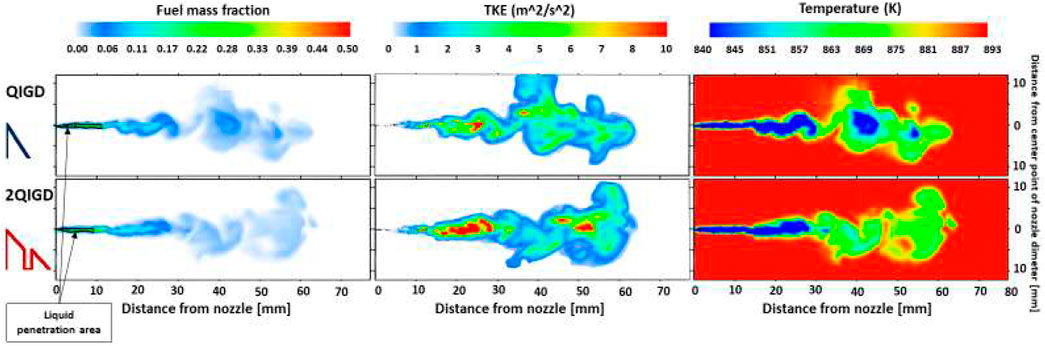
FIGURE 13. Comparisons of distribution of liquid, fuel mass fraction, TKE, and temperature history of QIGD and 2QIGD at 1.3 ms.
Therefore, the split injections with ultrahigh injection pressure strategy become one of the strategies for improving the fuel injection system, which will discuss the influence of split injection with different injection patterns in the next section.
4.2.3 Influence of different flexible injection patterns
In addition to raising awareness that the injection pattern plays an important role in the proposed spray behavior. Flexible injection rates are represented by the split injections with different injection patterns. Due to the complexity of this injection pattern, the complexity of the resulting process cannot be avoided. Therefore, the study of spray behavior and complex mixing processes were analyzed in this section. In this section, the 2QIGD, L2RECT, and H2RECT representing the split injection with different injection patterns were examined and compared with the influence of different flexible injection patterns.
The vortex formation behavior is shown with the direction of the velocity vector in Figure 14. It has been found that sustained higher injection pressure at the starting point of the H2RECT increases vortex formation and spray area. This phenomenon has been shown to produce a wider dispersed spray shape. These reveal that the spray penetration length and the spray diffusion width depend on the spray injection mass flow rate. In addition, Figure 14 shows that the highest initial injection pressure of the 2QIGD yields a long spray tip penetration, while the H2RECT with a slightly lower initial injection pressure but sustained high initial injection pressure shows longer spray tip penetration. Also, the H2RECT has superior efficiency in the spray diffusion behavior, showing the largest spray area boundary as compared to the other cases. It can be seen that the initial injection pressure shows a great influence on the spray penetration behavior. The effect of multiple injections shows an increase in turbulence at the first injection when the second injection was joined.
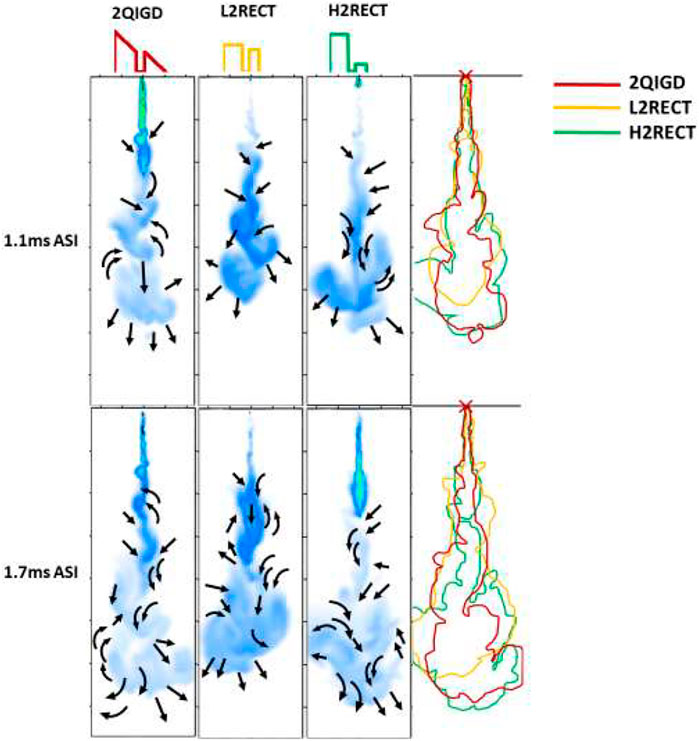
FIGURE 14. Velocity vector direction of vortex and spray area boundary.
In addition, different flexible injection patterns of split injections exhibit different spray shapes as shown in Figure 15. The simulation results in Figure 15 show the clear expansion of the radial spray area, especially for the H2RECT with a continuous very high first injection and low second injection, and this is due to the phenomenon of pressure inversion. When considering the boundary area at the end of the injection point, the L2RECT shows the narrowest radial spray expansion and the shortest spray tip penetration. This is because the injection pressure settings of the first and second injections are not largely different; this behavior is due to the weakness of pressure inversion, while the other two injection patterns show a high-pressure reversal from a large pressure difference. However, the simulation result shows that the spray penetration length depends on the peak injection, in which the QIGD is the longest, the H2RECT is second, then the L2RECT. Overall, Figure 15 shows that the continuous high injection pressure has a small effect on the radial spray expansion, but the high inverse injection pressure and the peak injection show a significant effect on both radial extension and spray penetration length.
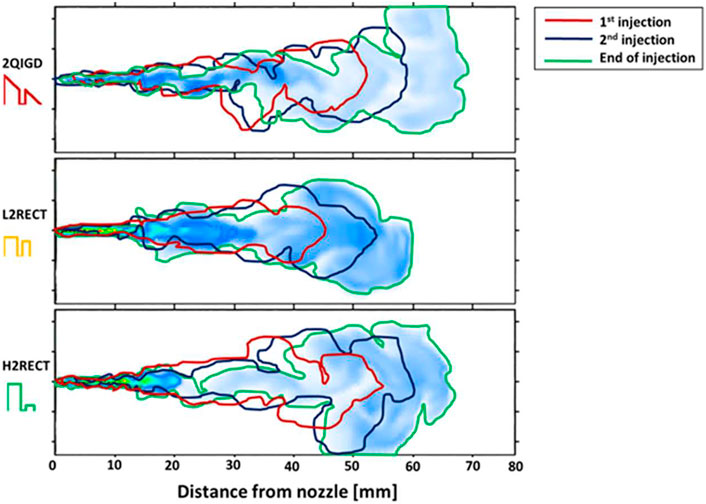
FIGURE 15. Spray area boundary for different spraying ranges. The first injection boundary is shown at the end of the first injection. The second injection boundary is shown at the beginning of the second injection. The end of the injection boundary is shown at the end of the injection point, which is different in each case.
4.3 Effective injection pattern
As the past findings show, the effective injection rate is the injection rate with ultrahigh injection pressure, high initial injection rate, and split injection, which include a combination of such strategies.
Finally, this section discusses the overall influence of all the different injection patterns in order to present the most effective injection patterns on the mixing efficiency of diesel spray. Figure 16 shows that the axial movement of the spray is directly proportional to the initial injection pressure. It can be seen that the injection pattern with a low initial injection rate shows a shorter spray penetration, and the dwell time increases the vortex interval as shown by the direction of the velocity vector. In addition, the higher peak injection has shown a faster dilute equivalence ratio.
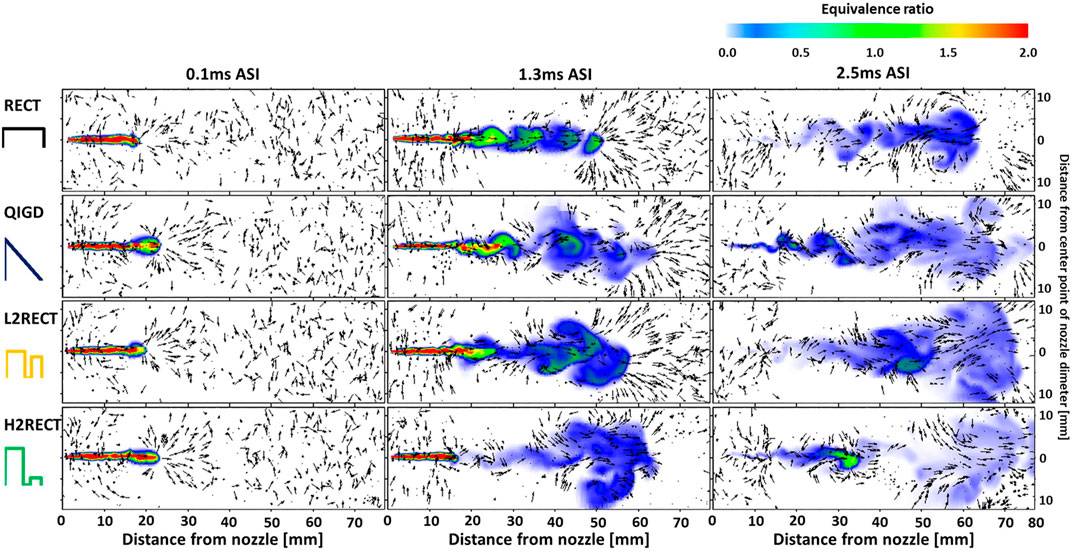
FIGURE 16. History of equivalence ratio and spray velocity vector direction at various injection rates.
Figure 16 shows that the H2RECT injection rate has the rapid dilution equivalence ratio at the spray tip, which has a positive effect on reducing liquid fuel collisions with combustion chamber walls. This result shows that an injection rate of continued high initial injection with sufficiently high injection pressure causes the droplets to spread throughout the fuel spray area and results in a lower equivalence ratio, thereby inhibiting the formation of soot precursors causing good mixing and combustion efficiency.
Figure 17 shows the spray penetration history results of spray penetration for understanding well the spray breakup process. The H2RECT injection rate shows the longest vapor penetration length in the final stage, while the RECT injection rate shows the shortest. This is because vapor penetration increases with injection acceleration rate and continues to increase with the injection rate before EOI. It can be seen that as the injection rate breaks down during the dwell time, the liquid spray penetration length drops to almost zero. However, it is clear that in the QIGD and 2QIGD injection rate cases with high peak injection rates, the injection pressure decreases steadily and decreases at the second injection, showing that the liquid spray penetration length was still visible after the EOI. This behavior can be explained by the influence of injection pressure that results in the particle’s shear force. A decreased shear force of the particles is not enough to change the liquid state to vapor state. The remaining liquid after the EOI is significant and may affect pollution due to the possibility of unburned residual fuel.

FIGURE 17. Simulated spray penetration of different injection patterns.
To understand the relationship between the fuel injection rate and fuel droplet breakup efficiency, Figure 18 presents the simulation results of the evaporation ratio under different injection patterns. It shows clear rapid evaporation in the QIGD, 2QIGD, and H2RECT injection rate cases than in the other injection patterns. However, the L2RECT injection rate case shows the same evaporation ratio as the aforementioned cases just after 0.15 ms ASI, while the RECT injection rate case shows the lowest evaporation ratio; this is because of the lower peak injection pressure. The QIGD, 2QIGD, L2RECT, and H2RECT injection rate cases have different peak injection pressures; the high enough peak injection pressure effect is of a good evaporation ratio. This is consistent with the results of the discussion of predicting the value of the equivalence ratio.
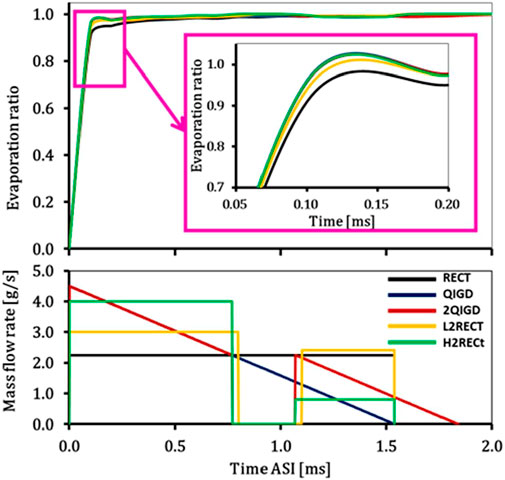
FIGURE 18. Evaporation ratio of different injection patterns.
The detailed information of the spray field region and spray angle is significant for a complete understanding of spray mixing. Figure 19 shows different spray angles, and it can be observed that the spray angle depends on the injection rate in each period. The H2RECT injection rate has the largest spray angle in the first injection period, and this is because evaporation is faster than in other cases which causes high spray distribution. Meanwhile the L2RECT injection rate shows the largest spray angle in the second injection phase. However, the QIGD injection rate shows a bigger spray angle than the second injection phase of the 2QIGD injection rate case. This is because the QIGD injection rate case has a continuous injection, while in the cases of 2QIGD and H2RECT injection rates, the fuel is injected in the second injection, resulting in a new high in-cylinder pressure and renewed spray expansion. This demonstrates that the injection rate and dwell time have a significant effect on spray distribution. The effect of dwell time on the spray angle is an interesting observation. The larger the spray angle, the higher the gas entrainment.
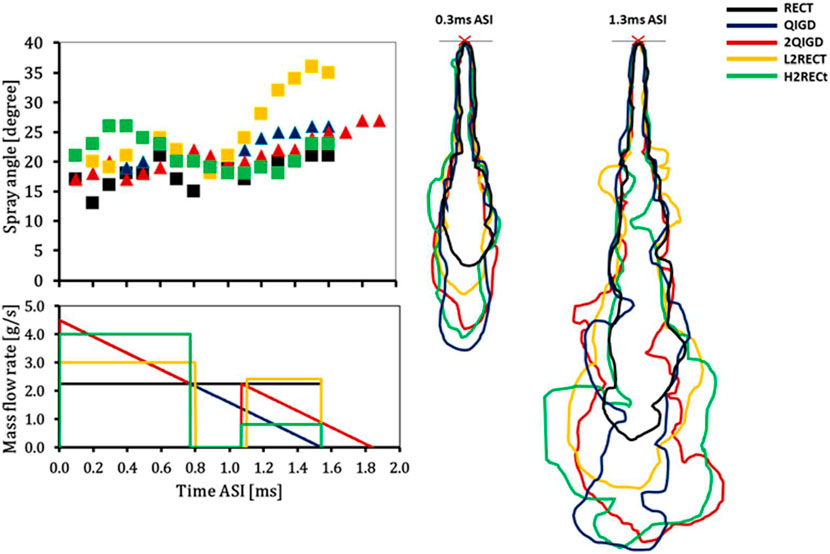
FIGURE 19. Comparison of spray angle of different injection patterns.
Figure 20 shows the temperature history in equivalence ratio, and the scatter points represent the equivalence ratio effect on the temperature history. Figure 20 shows the weak scatter of the equivalence ratio at high temperature and longer injection time, especially for the QIGD and 2QIGD cases, showing stronger scatter than for the RECT, L2RECT, and H2RECT cases. They show strong scatter at low temperatures for all considered cases, and this is due to the lower temperatures presenting incomplete mixing processes, when the temperature increases result in increasing the mixing efficiency. This phenomenal observation from changing the injection rate because the RECT, L2RECT, and H2RECT cases have a high injection rate from the beginning results in a high temperature and causes strong mixing. Until after the EOI, all study cases show a low value of equivalence ratio with high temperature, which shows the weakest scatter due to almost complete mixing. However, the results in the case of QIDG and 2QIDG still show some scatter of the equivalence ratio at this part because of the low injection rate before the EOI, assuming that these cases might give incomplete mixing. In this section, results show that higher injection causes higher temperature and higher mixing efficiency, as well as causing reduced ignition delay and resulting in faster combustion.
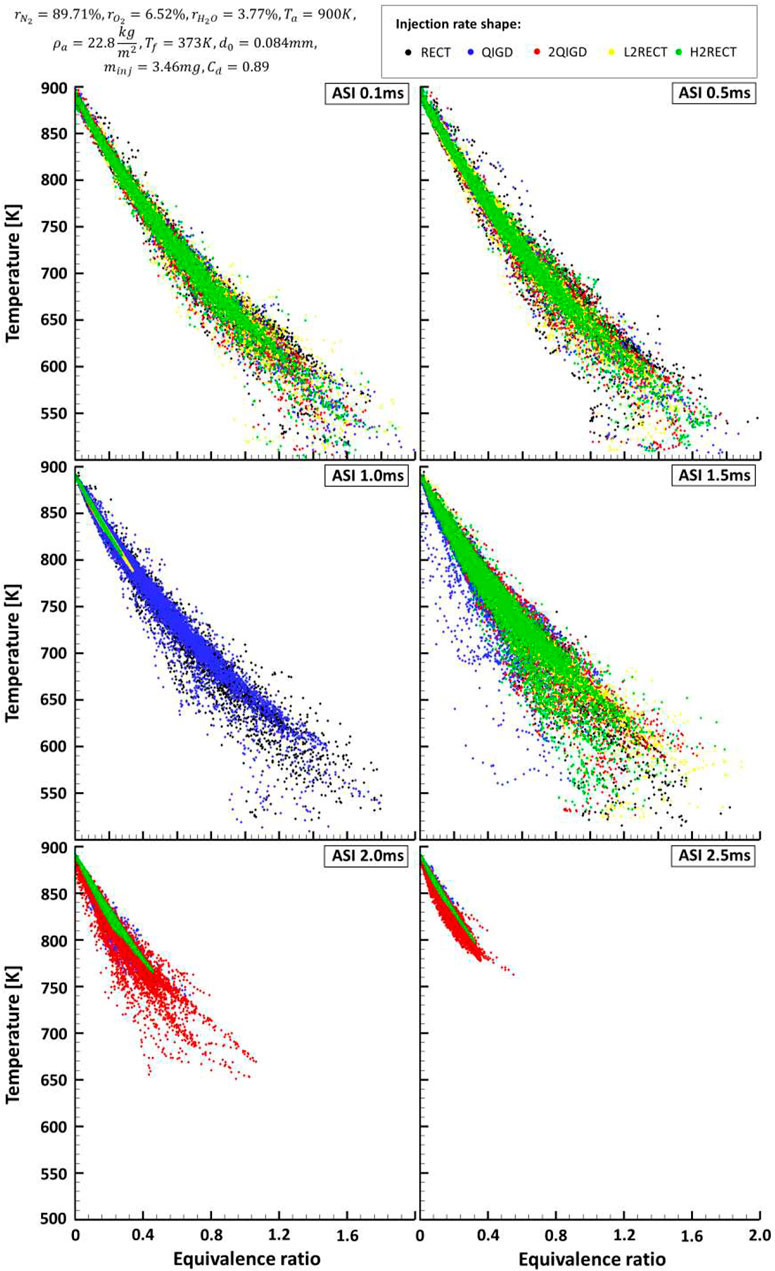
FIGURE 20. Spray temporal evolution in the resolution of equivalence ratio and temperature for different injection patterns.
The intensity of the turbulent movement in the spray process was investigated in the TKE as shown in Figure 21 to explain the phenomenon of the equivalence ratio. The result shows that the TKE is highest at the peak injection rate for all cases. During the first injection, the H2RECT injection rate case shows a stronger TKE that lasts longer than for the other cases, and additional TKE distribution histories is considered in Figure 22. The turbulent process produces a small vortex that circulates the mixture, thus having a different mixing. Figure 22 shows that changes in injection rates have a significant effect on turbulence behavior. Higher injection rates increase the fuel mass flux and the turbulence wave results in increased mixing efficiency.
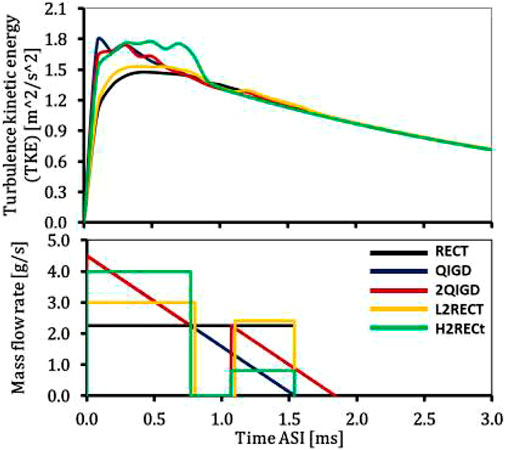
FIGURE 21. TKE of different injection patterns.
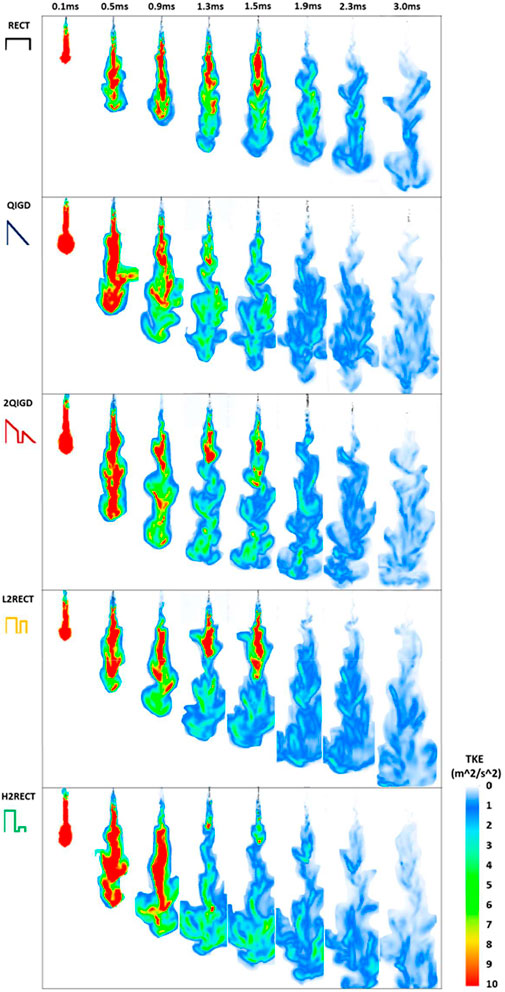
FIGURE 22. TKE distribution for different injection patterns.
5 Conclusion
In this study, the generated model using the LES model under basic conditions of ECN Spray A that investigated the effects of various injection patterns by split injection with different injection patterns on the spray characteristics can be concluded as follows:
1) Split injection has a great effect on spray boundary occurrence and the emergence of the spray vortex movement. The spray angle of the L2RECT injection rate shape increases by approximately 76% in the second injection when compared with the RECT injection rate shape (typical shape). The dwell time poses a significant effect on spray expansion, which results in higher gas entrainment because the fuel pressure is weakened during the dwell time, causing a faster dilution equivalence ratio, quickly completing the mixing process.
2) A maintained high injection rate shows low equivalence ratio and reveals rapid growth of the spray area due to the development of turbulence structure from the velocity effect, resulting in better mixing. The injection rate with a sufficiently high injection pressure causes the droplets to spread throughout the fuel spray area and results in a lower equivalence ratio, resulting in good mixing and combustion efficiency and inhibiting the formation of soot precursors. The H2RECT injection rate shape shows the highest amount of heat released, which can give a better mixing process and complete combustion.
3) The continuous high injection pressure and the different high injection pressures of the double injection show a significant effect on both the radial extension and spray tip length. The H2RECT injection rate shape shows that the vapor penetration increased by approximately 26.7% from the RECT injection rate shape (typical shape) and increased about 20% more than that from the L2RECT injection rate shape. Due to the influence of the injection pressure and a maintained high injection rate, the resulting particle’s shear forces the droplets to spread throughout the fuel spray area causing a low equivalence ratio, resulting in better mixing and combustion efficiency and inhibiting the formation of soot precursors.
4) The injection rate and dwell time have a great effect on spray distribution. The spray turbulence behavior is an indicator of airflow in the spray, while the spray angle is an indicator of the movement of the mixture. The formation of turbulence structure that results in the formation of the vortex at the spray head creates a lean equivalence ratio which creates a good mixing behavior, causing as a result a larger spray angle that results in higher gas entrainment.
5) The split injection and initial injection rates play a key role in evaporation, turbulence kinetics, and reaction processes. The H2RECT injection rate shape is the most effective in diesel spray mixing because the ultrahigh injection pressure of split injection with a high first injection and small second injection is effective to create a ready-mix from the first injection, resulting in quick complete mixing.
Finally, the results from the simulation show that the structure of the spray mixing is significantly affected by the flexible injection patterns. The split injection with different injection patterns have shown remarkable efficacy in this study, where the split injection and initial injection rates play a key role in evaporation, turbulence kinetics, and reaction processes.
Data availability statement
The original contributions presented in the study are included in the article/Supplementary Material; further inquiries can be directed to the corresponding author.
Author contributions
Conceptualization: LL. Methodology: IN. Software: IN. Validation: IN, QM, and YW. Formal analysis: LL, XM, and KN. Data curation: IN. Writing—original draft preparation: IN. Writing—review and editing: LL. Project administration: XM.
Funding
This work was supported by the Natural Science Foundation for Distinguished Young Scholars of Heilongjiang Province (Grant No. JQ2020E005), and the International Exchange Program of Harbin Engineering University for Innovation-oriented Talents Cultivation. The experimental data are referenced from the Engine Combustion Network website that is maintained and operated by the Engine Combustion Department of Sandia National Laboratories.
Conflict of interest
The authors declare that the research was conducted in the absence of any commercial or financial relationships that could be construed as a potential conflict of interest.
Publisher’s note
All claims expressed in this article are solely those of the authors and do not necessarily represent those of their affiliated organizations, or those of the publisher, editors, and reviewers. Any product that may be evaluated in this article, or claim that may be made by its manufacturer, is not guaranteed or endorsed by the publisher.
Supplementary material
The Supplementary Material for this article can be found online at: https://www.frontiersin.org/articles/10.3389/fenrg.2022.933591/full#supplementary-material
References
Akiyama, S., Toyama, Y., Saruwatari, S., Shimada, T., Noguchi, Y., and Aizawa, T. (2019). TAIZAC -TAndem Injectors zapping activation- towards thermal efficiency improvement of diesel engine. Soc. Automot. Eng. Jpn. 50 (2), 279–284. doi:10.11351/jsaeronbun.50.279
Anonymnous, Author. Home page: Engine combustion network (ECN): Experimental diagnostics and experimental data: Available at: https://ecn.sandia.gov/diesel-spray-combustion/. (Accessed 16.01.2021).
Bolla, M., Chishty, M. A., Hawkes, E. R., and Kook, S. (2017). Modeling combustion under engine combustion network Spray A conditions with multiple injections using the transported probability density function method. Int. J. Engine Res. 18 (1-2), 6–14. doi:10.1177/1468087416689174
Cung, K., Moiz, A., Johnson, J., Lee, S.-Y., Kweon, C.-B., and Montanaro, A. (2015). Spray–combustion interaction mechanism of multiple-injection under diesel engine conditions. Proc. Combust. Inst. 35 (3), 3061–3068. doi:10.1016/j.proci.2014.07.054
Edzuan Bin Abdullah, M. F., Shinobu, A., Tomoki, K., and Aizawa, T. (2019). Effects of inversed-delta injection rate shaping on diesel spray flame liquid length, lift-off length and soot onset. Fuel 258, 116170. doi:10.1016/j.fuel.2019.116170
Edzuan Bin Abdullah, M. F., Toyama, Y., Takahara, K., SaruwatariAkiyama, S,S., Akiyama, S., Shimada, T., et al. (2018). Optical diagnostics of inversed-delta rate shaping diesel spray flame toward reduction of late combustion. SAE Technical Paper 2018-01-1793. doi:10.4271/2018-01-1793
Jia, T.-M., Yu, Y.-S., and Li, G.-X. (2017). Experimental investigation of effects of super high injection pressure on diesel spray and induced shock waves characteristics. Exp. Therm. Fluid Sci. 85, 399–408. doi:10.1016/j.expthermflusci.2017.03.026
Knox, B. W., Genzale, C. L., Pickett, L. M., Garcia-Oliver, J. M., and Vera-Tudela, W. (2015). Combustion recession after end of injection in diesel sprays. SAE Int. J. Engines 8 (2), 679–695. doi:10.4271/2015-01-0797
Liu, H., Ma, S., Zhang, Z., Zheng, Z., and Yao, M. (2015). Study of the control strategies on soot reduction under early-injection conditions on a diesel engine. Fuel 139, 472–481. doi:10.1016/j.fuel.2014.09.011
Liu, L, Mei, Q, and Jia, W (2022). A flexible diesel spray model for advanced injection strategy. Fuel 314, 122784. doi:10.1016/j.fuel.2021.122784
Matheis, J., and Hickel, S. (2018). Multi-component vapor-liquid equilibrium model for LES of high-pressure fuel injection and application to ECN Spray A. Int. J. Multiph. Flow 99, 294–311. doi:10.1016/j.ijmultiphaseflow.2017.11.001
Moiz, A. A., Ameen, M. M., Lee, S.-Y., and Som, S. (2016). Study of soot production for double injections of n-dodecane in CI engine-like conditions. Combust. Flame 173, 123–131. doi:10.1016/j.combustflame.2016.08.005
Naruemon, I., Liu, L., Liu, D., Ma, X., and Nishida, K. (2020). An analysis on the effects of the fuel injection rate shape of the diesel spray mixing process using a numerical simulation. Appl. Sci. 10 (14), 4983. doi:10.3390/app10144983
Piscaglia, F., Giussani, F., Hèlie, J., Lamarque, N., and Aithal, S. M. (2021). Vortex flow and cavitation in liquid injection: A comparison between high-fidelity CFD simulations and experimental visualizations on transparent nozzle replicas. Int. J. Multiph. Flow 138, 103605. doi:10.1016/j.ijmultiphaseflow.2021.103605
Shuai, S., Abani, N., Yoshikawa, T., Reitz, R. D., and Park, S. W. (2009). Evaluation of the effects of injection timing and rate-shape on diesel low temperature combustion using advanced CFD modeling. Fuel 88 (7), 1235–1244. doi:10.1016/j.fuel.2009.01.012
Skeen, S., Manin, J., and Pickett, L. M. (2015). Visualization of ignition processes in high-pressure sprays with multiple injections of n-dodecane. SAE Int. J. Engines 8 (2), 696–715. doi:10.4271/2015-01-0799
Tay, K. L., Yang, W., Zhao, F., Yu, W., and Mohan, B. (2017). A numerical study on the effects of boot injection rate-shapes on the combustion and emissions of a kerosene-diesel fueled direct injection compression ignition engine. Fuel 203, 430–444. doi:10.1016/j.fuel.2017.04.142
Wang, L., Lowrie, J., Ngaile, G., and Fang, T. (2019). High injection pressure diesel sprays from a piezoelectric fuel injector. Appl. Therm. Eng. 152, 807–824. doi:10.1016/j.applthermaleng.2019.02.095
Xin, J., Ricart, L., and Reitz, R. D. (1998). Computer modeling of diesel spray atomization and combustion. Combust. Sci. Technol. 137 (1-6), 171–194. doi:10.1080/00102209808952050
Yu, S., Yin, B., Jia, H., and Yu, J. (2017). Numerical research on micro diesel spray characteristics under ultra-high injection pressure by Large Eddy Simulation (LES). Int. J. Heat Fluid Flow 64, 129–136. doi:10.1016/j.ijheatfluidflow.2017.03.003
Yu, Y. (2019). Experimental study on effects of ethanol-diesel fuel blended on spray characteristics under ultra-high injection pressure up to 350 MPa. Energy 186, 115768. doi:10.1016/j.energy.2019.07.098
Yu, Y., Lin, W., Li, L., and Zhang, Z. (2019). Effects of hydrogen addition on the combustion characteristics of diesel fuel jets under ultra-high injection pressures. Int. J. Hydrogen Energy 45 (17), 10592–10601. doi:10.1016/j.ijhydene.2019.08.242
Zheng, Z., Yue, L., Liu, H., Zhu, Y., Zhong, X., and Yao, M. (2015). Effect of two-stage injection on combustion and emissions under high EGR rate on a diesel engine by fueling blends of diesel/gasoline, diesel/n-butanol, diesel/gasoline/n-butanol and pure diesel. Energy Convers. Manag. 90, 1–11. doi:10.1016/j.enconman.2014.11.011
Nomenclature
ECN engine combustion network
CFD computational fluid dynamics
EOI end of injection
ASI after start of injection
SMD Sauter mean diameter
TKE turbulence kinetic energy
RANS Reynolds-averaged Navier–Stokes
LES large eddy simulations
SGS sub-grid scale
NTC no time counter model
KH Kelvin–Helmholtz instability model
RT Rayleigh–Taylor instability model
NOx nitrogen oxides
CO carbon monoxide
CO2 carbon dioxide
C12H26 n-dodecane
Cd steady flow discharge coefficient
B0 KH model breakup size constant
B1 KH model breakup time constant
Keywords: spray mixing, large eddy simulation, split injection, different injection rates, ultrahigh injection pressure
Citation: Naruemon I, Liu L, Mei Q, Wu Y, Ma X and Nishida K (2023) Investigating the effects of split injection with different injection patterns on diesel spray mixing. Front. Energy Res. 10:933591. doi: 10.3389/fenrg.2022.933591
Received: 01 May 2022; Accepted: 07 September 2022;
Published: 09 January 2023.
Edited by:
Lei Luo, Harbin Institute of Technology, ChinaReviewed by:
Xiongbo Duan, Hunan University, ChinaHaifeng Liu, Tianjin University, China
Lei Shi, Shanghai Jiao Tong University, China
Copyright © 2023 Naruemon, Liu, Mei, Wu, Ma and Nishida. This is an open-access article distributed under the terms of the Creative Commons Attribution License (CC BY). The use, distribution or reproduction in other forums is permitted, provided the original author(s) and the copyright owner(s) are credited and that the original publication in this journal is cited, in accordance with accepted academic practice. No use, distribution or reproduction is permitted which does not comply with these terms.
*Correspondence: Long Liu, bGl1bG9uZ0BocmJldS5lZHUuY24=