 Zhenfeng Liang
 Jing Wang1
- 1Department of Electrical Engineering, Xi’an University of Technology, Xi’an, China
- 2M&T Center of CSG EHV Company, Guangzhou, China
A micro-phasor measurement unit (μPMU) configuration optimization approach is proposed in this article, considering the numerous operation modes of distribution network reconfiguration. The PSO algorithm with dynamic adaptability is used to optimize the setup of μPMU and improve the accuracy of state estimation for each distribution network operation mode. The configuration nodes of various operation modes are grouped and assessed by K-means according to the shortest distance, and the weights of the evaluation indexes are calculated by the AHP-CRITIC subjective and objective combination weighting method. The node with the highest comprehensive evaluation index is selected as the configuration node. The probability of multiple operation modes is then introduced. Finally, using the IEEE 118-bus distribution system as an example, the simulation demonstrates the proposed method’s effectiveness in improving distribution network state estimate.
Introduction
With the large-scale access of distributed power sources, the structure and operation mode of the distribution network system are complex and changeable (Majdoub et al., 2018), and the volatility and randomness of the high proportion of distributed generation also bring great challenges to the operation and control of the distribution network (Huang et al., 2022). Therefore, the “observable” and “controllable” capability of the distribution network is of vital importance to ensure the economic and safe operation of the system (Liu et al., 2020), and high accuracy state estimation is an important prerequisite for analyzing the operation state of the distribution network.
The existing measurement devices in the distribution network, including advanced measurement system (AMI) and supervisory control and data acquisition (SCADA), can no longer meet the operational control requirements of the distribution network. The micro-phasor measurement unit (μPMU) is a GPS-based real-time measurement device that calculates electrical parameter of the distribution network, including the magnitude and phase angle of the node voltage and the branch current, in real time by collecting voltage and current phase quantities, and transmits data faster, usually 10 ms or 20 ms (Zhang et al., 2021), which can significantly improve the distribution system’s observability and measurement accuracy.
The existing measurement devices cannot cover the needs of distribution network condition assessment in terms of data collection duration and accuracy due to the dispersed installation of distribution network measurement devices and the lack of real-time measurement data. With the emergence and wide application of μPMU, many scholars have used the μPMU for state estimation. μPMU is not economical for distribution networks with large node size to achieve system observability just by installing the μPMU (Kandenkavil and Bhattacharya, 2018), a method of combining traditional measurement data with μPMU data to build a hybrid measurement state estimation method is provided. The hybrid weighted least squares state estimation algorithm based on PMU and SCADA is proposed in the study by Skok et al. (2016), Silva et al. (2017), and Santos and Orillaza (2018) for the three-phase unbalanced distribution network system, which not only ensures the global observability of the system, but also satisfies the economy and improves the accuracy of state estimation. A fast three-phase state estimation method based on hybrid measurements is proposed in He et al. (2021). The redundancy of state estimation is significantly increased by increasing the voltage pseudo-measurements through μPMU measurements. A hybrid weighted minimum absolute state estimation algorithm based on SCADA and μPMU is proposed in the study by Santos and Orillaza (2018), which has better stability than the weighted least square method. The study proposes a three-phase distribution system state estimation method based on Bayesian inference (Massignan et al., 2022). It uses Bayesian information fusion to combine different types of data and time scales for state estimation, which improves the accuracy of state estimation pseudo measurement data.
Because of the huge scale, complicated, and changing structure of distribution networks, the configuration optimization problem of μPMUs is a practical challenge that has to be solved quickly. Most problems for optimal μPMU configuration are currently solved by using optimization algorithms to take the network-wide observable and minimum number as the objective function, consider different practical situations, or emergent conditions as constraints, and use network-wide observable and minimum number as the objective function. The mixed integer programming algorithm is used to solve the problem by Teimourzadeh et al. (2019), with the minimum number of μPMUs as the objective function and the observability of the system under the normal operation and the observability under emergency conditions as constraints. Under the condition of ensuring the observability of the system and the minimum number of installations, the influence of the current channel is considered in the study by Elaziez et al. (2020). The optimal configuration result of μPMU is solved with the selection of current channel as the constraint condition. Compared with transmission networks, network reconfiguration is an important process that distribution networks often undergo. Most of the existing distribution network μPMU optimal configurations are optimized based on the fixed network topology during normal operation, without considering the complex and variable topology of the distribution network. Now, a μPMU device has been used in distribution network state estimation to improve the accuracy of state estimation. A new method of μPMU optimal configuration for the distribution system based on a high precision state perception is proposed in the study by Tian et al. (2019). And simulation results show the effectiveness of the proposed method in improving state estimation accuracy.
If the distribution line fails, when the fault occurs, the breaking and clearing of the fault are generally completed within milliseconds, and the state estimation period is generally 1–5 min, sometimes tens of seconds, so the influence on the state estimation is small. After the fault occurs in the distribution network, the system automatically removes and isolates the fault, and restores the power supply in the non-fault area generally requires 3–10 s shorter time, less impact on distribution network state estimation. The method in this paper is suitable for the operation mode of topology change after distribution network fault reconstruction.
In addition, fault information is used in a lot of current research for state estimation and parameter identification. Li et al. (2018) proposed to extend the line parameters and fault information (fault distance and voltage phasor of fault point) to state variables, and conduct state estimation together with the original node state variables to realize online parameter identification. Wang et al. (2020) established the overall model of the faulted active distribution network, where the fault location was introduced as the state of the system. The state estimate approach is then utilized to pinpoint the location of the problem. Some people use the substation current and voltage values to determine all possible short-circuit locations based on impedance. In the case of multiple locations, in addition to the voltage and current measured in the substation, the state estimation will also use some bus available voltage measurements. For each case, the location and fault current calculated by the impedance-based method are used as inputs to the estimator, which provides the fault location based on the normalized residual analysis. Kume et al. (2020) proposed that the impedance-based method uses the current and voltage values of the substation to determine all possible short-circuit positions. In the case of multiple locations, in addition to the voltage and current measured in the substation, the state estimation will also use some bus available voltage measurements. For each case, the location and fault current calculated by the impedance-based method are used as inputs to the estimator, which provides the fault location based on the normalized residual analysis. Öner and Göl (2016) used the PMU measurement value recorded during the fault (before the circuit breaker is disconnected). These measurements are used to determine the fault current flowing on the fault line, and the weighted least squares are used for state estimation and fault location.
A μPMU configuration optimization research is proposed in this article, which takes into account numerous distribution network operation modes with reconfiguration. Firstly, the configuration of μPMU is optimized for various topologies. Then, the K-means clustering algorithm is introduced, and the obtained configuration nodes are clustered at the shortest distance, and the four indexes of node degree, node compactness, node importance, and node betweenness are evaluated. The weight of the four indexes is solved using the subjective and objective combination weighting technique of AHP and CRITIC, and the comprehensive index of nodes is obtained. In each cluster, the node with the greatest comprehensive index is chosen, and the final configuration scheme is created. The node is fully re-evaluated on this basis, considering the possibility of alternative distribution network operating modes. For simulation verification, the IEEE-118 node distribution network system is employed.
Micro-Phasor Measurement Unit Configuration Optimization
Micro-Phasor Measurement Unit Configuration Optimization Mathematical Model
The node without power injection is referred to as a zero-injection node in distribution network modeling, and the current is nearly zero. The best configuration goal of μPMU is to obtain the maximum state estimate accuracy, with zero-injection nodes as the constraint, in the scenario where the whole network is totally visible. The objective function of the best μPMU design for a system with nodes is illustrated in Eq. 1.
where
The system node correlation matrix is a binary matrix whose elements are defined as in Eq. 3.
Micro-Phasor Measurement Unit Configuration Optimization Algorithm
The optimization objective model is solved by the improved particle swarm optimization algorithm. The inertia factor, which is based on the current particle swarm evolution speed factor and aggregation factor, is dynamically changed by the weight of its speed and position update (Zhang et al., 2005). It can not only make the algorithm have dynamic adaptability, but also improve the convergence performance of the algorithm.
The following are the steps of the improved particle swarm algorithm:
1) Initialization: To begin, the maximum number of iterations, the number of objective function independent variables, the maximum particle velocity, and the number of populations are all specified. The maximum particle velocity
2) Calculating the fitness: The fitness function in this article is set to the error value of voltage amplitude and phase angle of each node, and the expression is
3) The individual optimal fitness and global optimal solution calculation: The best fitness value of each individual is to find the historical optimal location information for each particle, and find the global optimal solution from these historical optimal solutions. Then compared with the historical global optimal solution, the minimum value is selected as the current historical optimal solution.
4) Update the particle position and velocity: Update the expression as shown in Eqs 4, 5.
where
where
Distribution Network Node Centrality Assessment
K-Means Node Clustering
The K-means clustering technique is the most widely used unsupervised learning clustering algorithm. The idea is to partition a data set containing N variables into k distinct groups. The K-means clustering algorithm uses Euclidean distance as a measure of similarity between data. The Euclidean distance expression between two data
The objective function of K-means clustering algorithm is the minimum loss function as in Eq. 10.
where
Node Evaluation Metrics
The importance of nodes, the degree of nodes, the tightness of nodes, and the betweenness of nodes are all considered in this article while evaluating the node centrality of a distribution network.
1) The node of importance (Zeng et al., 2021): It refers to the numerical relationship between the new network cohesion and the original network cohesion after shrinking a node. The node importance is expressed as Eq. 11.
where
Network cohesion (Li et al., 2012) is defined as Eq. 12.
where
2) The degree of nodes (Liu et al., 2021): The degree of a node, also called node correlation degree, is the number of edges associated with that node. The degree of nodes is defined as shown in Eq. 13.
where
3) The tightness of nodes: Node tightness is used to describe the closeness of a node to other nodes in the distribution network system. In this article, the branch impedance modulus is used as the weight of the edge to form an undirected weighted network. The tightness of nodes index is expressed as Eq. 14.
where
4) The betweenness of nodes (Xu et al., 2010): It refers to the total number of shortest paths in the network divided by the number of paths going through the edge, which accounts for the ratio of the total number of shortest paths, demonstrating the role, and influence of the corresponding nodes or edges in the entire network. Eq. 15 shows the definition of node betweenness.
where N is the total number of system nodes;
Determination of Indicator Weights
Taking into account the benefits and drawbacks of subjective and objective weighting methods, as well as decision makers’ preferences for attributes, while minimizing subjective arbitrariness in attribution, in order to achieve a balance of subjectivity and objectivity in attribute attribution, resulting in true, and reliable decision results. In this article, the combination of subjective and objective weighting method, AHP and CRITIC method, is used to determine the weight of the four indicators.
AHP is a classical subjective weighting method (Zhang et al., 2021). The specific steps are as follows:
1) Construct judgment matrix A.
2) The relative weight between layers is obtained from the judgment matrix. The corresponding feature vector
3) Calculation of consistency indicators. The calculation formulas are shown in Eqs 17 and 18.
where
The CRITIC approach is a comprehensive estimate of the objective weight of the indicators based on their relative strength and the conflict between them (Zhang et al., 2022). The following are the specific steps in the calculation:
1) Assuming that there are M evaluation indexes and N evaluation objects, the original index data matrix is as follows:
where
2) It is required to do dimensionless treatment for each index in order to eliminate the impact of different dimensions on the evaluation results. Eq. 20 shows the dimensionless calculation formula for the positive evaluation index data.
where
3) Indicator variability: It is expressed by standard deviation, as shown in Eq. 21.
where
4) Conflict of indicators: The expression is given as Eq. 22.
where
5) Information quantity: The more information there is, the more important it is to the overall evaluation index system, and it should be given more weight. Eq. 23 shows the calculating formula.
6) Objective weight: The objective weight of the index j is shown in Eq. 24.
The calculation of the combined weight coefficient is shown in Eq. 25.
where
Optimization Process Considering Multiple Operation Modes
In order to meet the rationality of configuration optimization of μPMU measurement device under various operation modes, the optimization scheme after reconstruction is considered. Various operation modes include the normal operation mode and reconstructing operation mode. The configuration optimization scheme of the μPMU is obtained under different operation modes, and the model diagram of configuration node is shown in Figure 1.
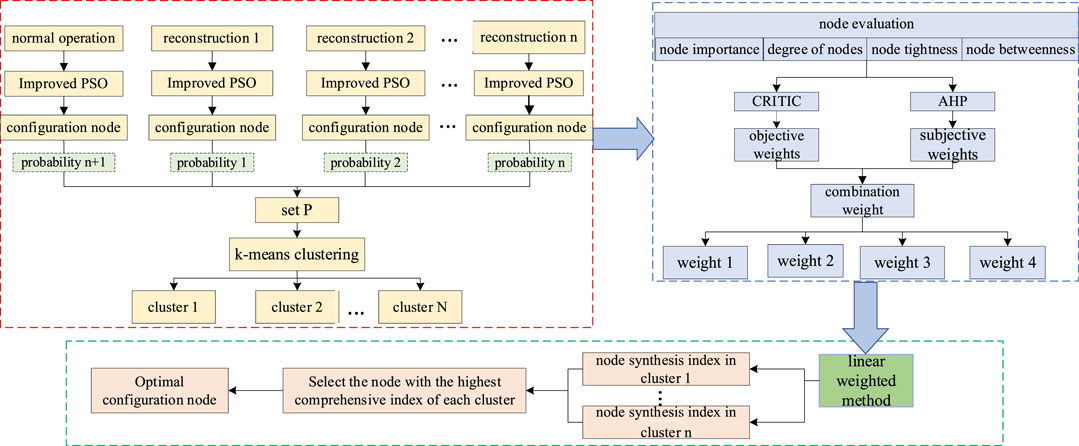
FIGURE 1. Optimization process model diagram.
μPMU configuration optimization nodes are chosen according to the following principles, as shown in Figure 1:
1) Create an empty set P as a node set to record the μPMU configuration scheme’s node number.
2) The modified PSO method is used to optimize the configuration of the μPMU according to the present normal system architecture, as illustrated in Figure 2, and the configured node number is stored in the set P.
3) The present distribution network is reconstructed using the reconstruction rules, and the topology is re-optimized using μPMU configuration, with the configured nodes being placed in set P.
4) K-means grouping is used to group the configured nodes by shortest distance, with the number of clusters equal to the number of configured nodes.
5) The node importance, degree of nodes, node tightness, and node betweenness of each cluster are calculated using Eqs 11–15, and the comprehensive index of the node is obtained using the subjective and objective comprehensive weights of AHP and CRITIC, and the node with the highest comprehensive index is selected.
6) The configured nodes are thoroughly re-evaluated in light of the possibility of various operation modes. If a node appears in multiple operation modes, its probability is the sum of the operation mode’s probabilities.
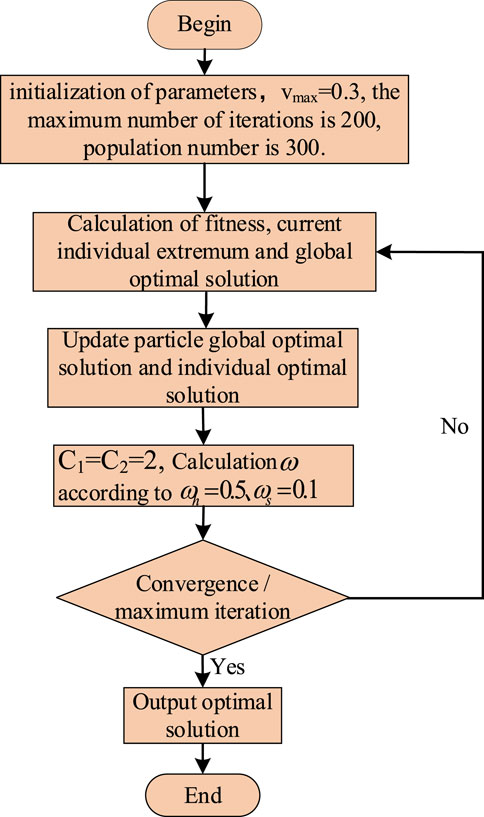
FIGURE 2. Improved PSO optimization flow chart.
Example Analysis
The IEEE-118 node test system is used as an example in this work. Figure 3 depicts the IEEE-118 node test system. There are 132 branches, 118 nodes, and 15 interconnection switches in the system.
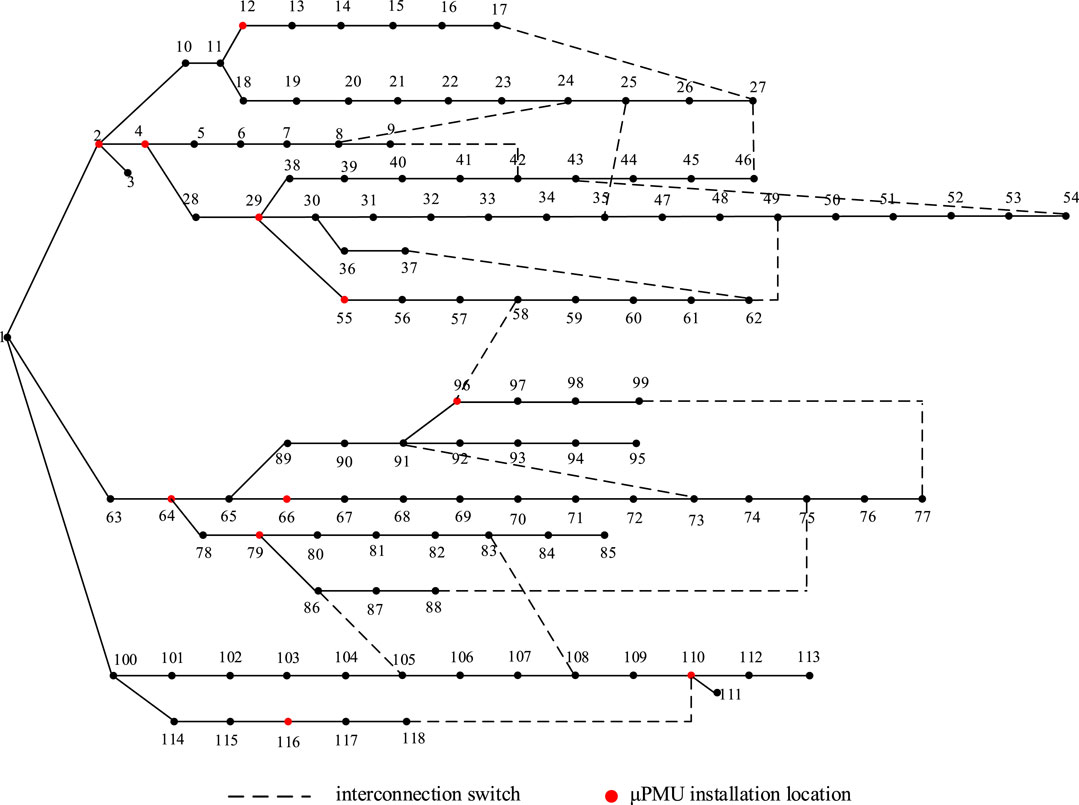
FIGURE 3. IEEE-118 node test system.
To begin, the IEEE-118 distribution network system is 10 times recreated, and the μPMU installation places of ten different topologies are optimized. Table 1 shows the switching positions before and after 10 different types of reconstruction.
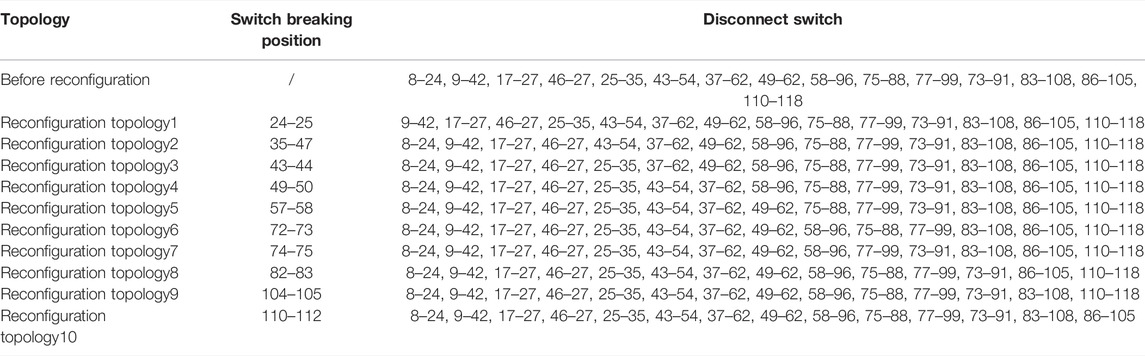
TABLE 1. IEEE-118 system topology Reconfiguration.
The configuration results using the μPMU optimization configuration method for the ten topology reconfigurations in this article are shown in Table 2.
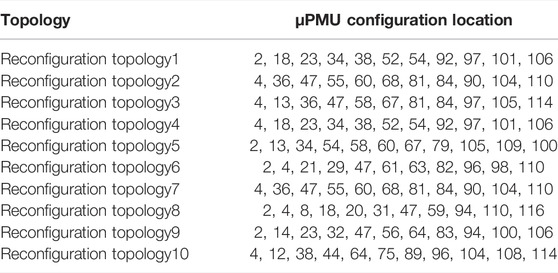
TABLE 2. μPMU configuration scheme.
The nodes are classified into eleven categories based on the shortest distance in the synthesis of ten types of reconstruction μPMU configurations illustrated in Table 2. And Table 3 displays the clustering results.
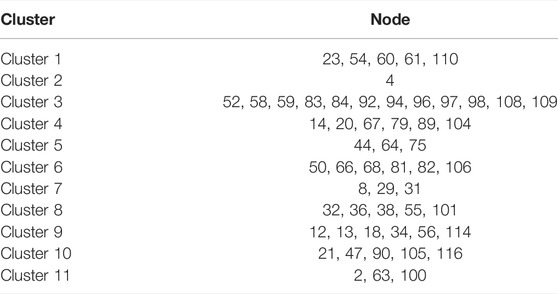
TABLE 3. Clustering results.
For nodes in 11 clusters, four node indices were calculated, and the nodes were then thoroughly examined. A node with the highest index is chosen from 11 clusters based on the size of the comprehensive assessment index. Table 4 shows the results of the node indicator evaluation.
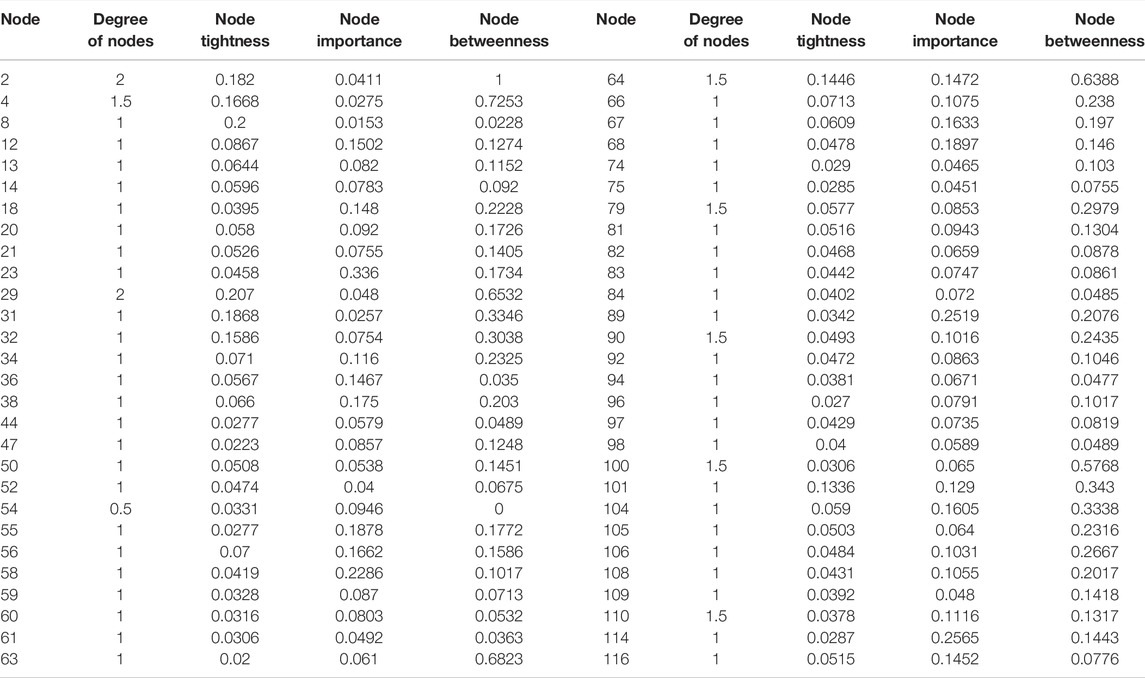
TABLE 4. Indicator assessment results.
The subjective and objective weights of the four indicators of node degree, node compactness, node importance, and node betweenness of these nodes are determined using the AHP and CRITIC methods, respectively. The judgment matrix’s creation is shown in Eq. 26.
The obtained subjective weights are the degree of node
The parameters and objective weights calculated by the CRITIC objective weighting method are shown in Table 5.
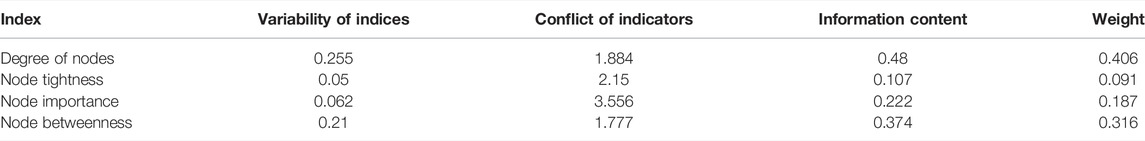
TABLE 5. CRITIC weighting calculation results.
The combination weights are the degree of node
On the basis of reconfiguration, the probability of normal operation and reconfiguration is considered. The comprehensive index of nodes is derived with a 50% likelihood of normal operation and a 5% probability of each reconfiguration. As illustrated in Figure 4, a comprehensive index of nodes with various operating modes is evaluated.
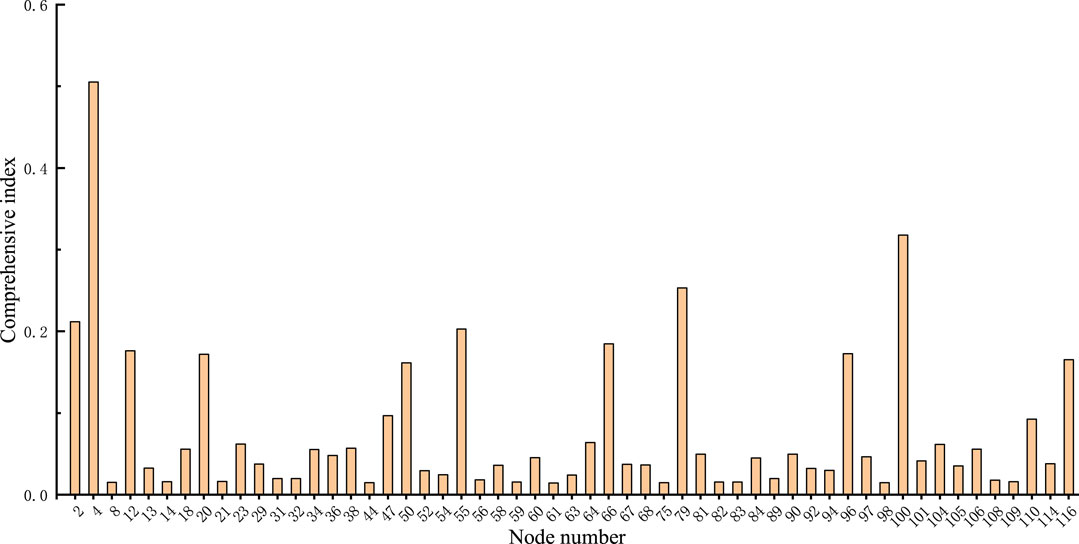
FIGURE 4. Node centrality index after adding probability.
It can be seen from Figure 4 that the nodes with the highest comprehensive index value in each cluster are 2, 4, 12, 29, 55, 64, 66, 79, 96, 110, and 116, respectively. As a result, μPMU devices are installed at these 11 nodes, and the state estimate results are compared using the probability of different operation modes and without using the probability of different operation modes, as shown in Table 6.
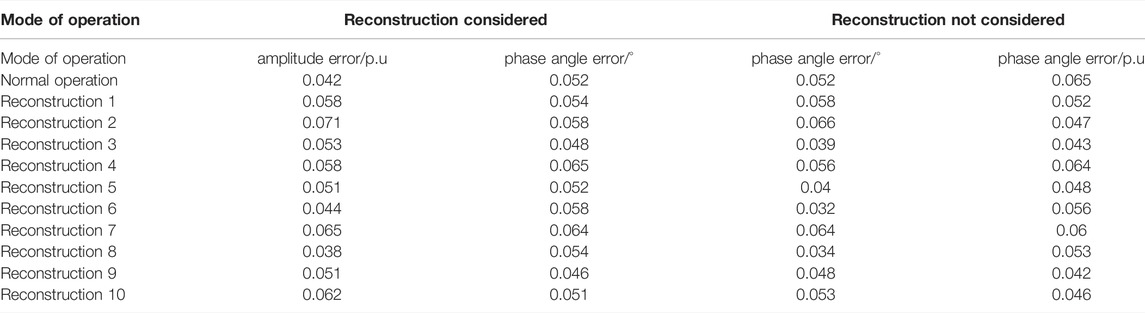
TABLE 6. State estimation results considering operation mode probability.
Table 6 shows that the proportion of reconstruction is small after considering the operation probability, and the comprehensive index of reconstruction configuration is small in the node evaluation, because the probabilities of all operation modes are the same without considering the operation probability. As a result, when considering the operation probability, the state estimate results are better than when not considering the operation probability. However, the state estimation accuracy in the system reconstruction without considering the operation probability is higher than when considering the operation probability because without considering the operation probability, the proportion of each after operation is the same as the normal operation, and thus the weight of the comprehensive index of all nodes is the same. The weight of the comprehensive index of the μPMU configuration node in the reconstruction is small when considering the operation probability, whereas the weight of the comprehensive index of the μPMU configuration node in the normal operation is large, resulting in a high state estimation accuracy without considering the probability.
Conclusion
In this article, the μPMU configuration optimization of topology changes after distribution network reconfiguration is considered. The probability of various operating modes is estimated based on reconfiguration, and the μPMU configuration and node comprehensive assessment are re-carried out. Using the IEEE-118 distribution network node as an example, the following conclusions may be drawn:
1) A μPMU configuration optimization approach is provided that considers topology changes following reconfiguration. μPMU configuration optimization that takes into account distribution network reconfiguration and the probability of different operating modes is more in line with the actual condition of distribution network systems, making the scheme more practical and relevant.
2) The state estimation accuracy of the reconstructed operation mode is improved, and the μPMU configuration optimization method obtained in this article meets the accuracy requirements for the state estimation results of the normal operation mode. It is also suitable for distribution systems with large nodes.
Data Availability Statement
The raw data supporting the conclusions of this article will be made available by the authors, without undue reservation.
Author Contributions
All authors listed have made a substantial, direct, and intellectual contribution to the work and approved it for publication.
Conflict of Interest
YZ was employed by M&T Center of CSG EHV Company.
The remaining authors declare that the research was conducted in the absence of any commercial or financial relationships that could be construed as a potential conflict of interest.
Publisher’s Note
All claims expressed in this article are solely those of the authors and do not necessarily represent those of their affiliated organizations, or those of the publisher, the editors, and the reviewers. Any product that may be evaluated in this article, or claim that may be made by its manufacturer, is not guaranteed or endorsed by the publisher.
References
Elaziez, A. A., Mohamed, M. A., AbdelRaheem, M., and A.Nayel, M. (2020). “Optimal μPMU Placement and Current Channel Selection Considering Running Cost for Distribution Grid,” in 2020 IEEE International Conference on Power Electronics, Smart Grid and Renewable Energy (PESGRE2020), Cochin, India, 02-04 January 2020. doi:10.1109/PESGRE45664.2020.9070613
Elsayed, A. A. E., Mohamed, M. A., Abdelraheem, M., and Nayel, M. A. (2020). Optimal ΜPMU Placement Based on Hybrid Current Channels Selection for Distribution Grids. IEEE Trans. Ind. Appl. 56 (6), 6871–6881. doi:10.1109/TIA.2020.3023680
He, X., Li, C., Du, M., Dong, H., and Li, P. (2021). Hybrid Measurements-Based Fast State Estimation for Power Distribution System. IEEE Access 9, 21112–21122. doi:10.1109/ACCESS.2021.3055223
Huang, M., Wei, Z., Sun, G., and Zang, H. (2022). Review of Distribution System Situation Awareness Based on Data Mining: Modeling, Algorithms and Challenges. Proc. CSEE.
Kandenkavil, S. V., and Bhattacharya, K. (2018). “Optimization Approaches to Distribution System State Estimation for Optimal Meter Placement,” in 2018 IEEE Electrical Power and Energy Conference (EPEC), Toronto, ON, Canada, 10-11 October 2018, 1–6. doi:10.1109/EPEC.2018.8598297
Kume, G. Y., Momesso, A. E. C., and Asada, E. N. (2020). “Combined Impedance and Branch Current State Estimation Method for Fault Location in Electric Power Distribution Systems,” in 2020 IEEE Power & Energy Society General Meeting (PESGM), Montreal, QC, Canada, 02-06 August 2020, 1–5. doi:10.1109/PESGM41954.2020.9281953
Li, B.-x., Li, M.-j., Sun, D.-y., Li, J., and Li, W.-j. (2012). “Evaluation Method for Node Importance Based on Node Condensation in Terrorism Networks,” in 2012 IEEE International Conference on Intelligence and Security Informatics, Washington, DC, USA, 11-14 June 2012, 193. doi:10.1109/ISI.2012.6284301
Li, J., Wang, X., Ren, X., Zhang, Y., and Zhang, F. (2018). “Augmented State Estimation Method for Fault Location Based on On-Line Parameter Identification of PMU Measurement Data,” in 2018 IEEE 2nd International Electrical and Energy Conference (CIEEC), Beijing, China, 04-06 November 2018, 105–109. doi:10.1109/CIEEC.2018.8745813
Liu, D., Huang, K., Hu, Q., and Wu, S. (2021). “Node Importance Measurement and Simulation of Complex Network Based on K-Index Expansion,” in 2021 5th International Conference on Automation, Control and Robots (ICACR), Nanning, China, 25-27 September 2021. doi:10.1109/ICACR53472.2021.9605177
Liu, H., Bi, T., and Xu, Q. (2020). Scheme and Prospect of High-Precision Synchrophasor Measurement Technology for Distribution Network.
Majdoub, M., Boukherouaa, J., Cheddadi, B., Belfqih, A., Sabri, O., and Haidi, T. (2018). “A Review on Distribution System State Estimation Techniques,” in 2018 6th International Renewable and Sustainable Energy Conference (IRSEC), Rabat, Morocco, 05-08 December 2018, 1–6. doi:10.1109/IRSEC.2018.8702952
Massignan, J. A. D., London, J. B. A., Bessani, M., Maciel, C. D., Fannucchi, R. Z., and Miranda, V. (2022). Bayesian Inference Approach for Information Fusion in Distribution System State Estimation. IEEE Trans. Smart Grid 13 (1), 526–540. doi:10.1109/TSG.2021.3128053
Oner, A., and Gol, M. (2016). “Fault Location Based on State Estimation in PMU Observable Systems,” in 2016,IEEE Power & Energy Society Innovative Smart Grid Technologies Conference (ISGT), Minneapolis, MN, USA, 06-09 September 2016, 1–5. doi:10.1109/ISGT.2016.7781178
Santos, R. Z. S., and Orillaza, J. R. C. (2018). “Distribution System State Estimator Using SCADA and μPMU Measurements,” in 2018 IEEE Innovative Smart Grid Technologies - Asia (ISGT Asia), Singapore, 22-25 May 2018, 558–562. doi:10.1109/ISGT-Asia.2018.8467853
Silva, R. S., Laburu, F. M., and Almeida, M. (2017). “On the Use of μPMU for State Estimation in Distribution Systems,” in 2017 IEEE Power & Energy Society General Meeting (PESGM), Chicago, IL, USA, 16-20 July 2017. doi:10.1109/PESGM.2017.8274411
Skok, S., Ivankovic, I., and Cerina, Z. (2016). Hybrid State Estimation Model Based on PMU and SCADA Measurements. IFAC-PapersOnLine 49 (27), 390–394. doi:10.1016/j.ifacol.2016.10.764
Teimourzadeh, S., Aminifar, F., and Shahidehpour, M. (2019). Contingency-Constrained Optimal Placement of Micro-PMUs and Smart Meters in Microgrids. IEEE Trans. Smart Grid 10 (2), 1889–1897. doi:10.1109/TSG.2017.2780078
Tian, J., Liang, D., Ge, L., Li, K., Wang, S., and Li, Z. (2019). Placement of Microphasor Measurement Units in Distribution Systems for Highly Accurate State Perception. Power Syst. Technol. 43 (7), 2235–2242. doi:10.13335/j.1000-3673.pst.2019.0474
Wang, B., Liu, Y., Zhao, J., Jia, Y., and Chen, X. (2020). “State Estimation Based Fault Location Method for Active Distribution Networks,” in 2020 IEEE Power & Energy Society General Meeting (PESGM), Montreal, QC, Canada, 02-06 August 2020, 1–5. doi:10.1109/PESGM41954.2020.9281665
Xu, L., Wang, X., and Wang, X. (2010). Cascading Failure Mechanism in Power Grid Based on Electric Betweenness and Active Defence. Proc. CSEE 30 (13), 61–68. doi:10.13334/j.0258-8013.pcsee.2010.13.010
Zeng, S., Wu, K., and Li, X. (2021). Multi-stage Optimal Configuration of PMU Considering Changes in Distribution Network Topology: GUANGDONG ELECTRIC POWER.
Zhang, X., Du, Y., Qin, G., and Tan, Z. (2005). Adaptive Particle Swarm Algorithm with Dynamically ChangingInertia Weight. Journal of Anqing Teachers College (Natural Science Edition) 39 (10), 1253–1257. doi:10.3321/j.issn:0253-987X.2005.10.001
Zhang, Y., Lu, Y., Yang, G., and Hang, Z. (2022). Multi-Attribute Decision Making Method for Node Importance Metric in Complex Network. Appl. Sci. 12 (4), 1944. doi:10.3390/app12041944
Keywords: distribution network, micro-phasor measurement unit, multi-operating conditions, AHP-CRITIC, optimized configuration, node evaluation
Citation: Liang Z, Wang J, Wang X and Zhang Y (2022) Research on μPMU Configuration Optimization Considering Multiple Operation Modes of Distribution Network. Front. Energy Res. 10:932072. doi: 10.3389/fenrg.2022.932072
Received: 29 April 2022; Accepted: 10 June 2022;
Published: 26 July 2022.
Edited by:
Zaibin Jiao, Xi’an Jiaotong University, ChinaReviewed by:
Wenquan Shao, Xi’an Polytechnic University, ChinaJie Gao, Xi’an Jiaotong University, China
Copyright © 2022 Liang, Wang, Wang and Zhang. This is an open-access article distributed under the terms of the Creative Commons Attribution License (CC BY). The use, distribution or reproduction in other forums is permitted, provided the original author(s) and the copyright owner(s) are credited and that the original publication in this journal is cited, in accordance with accepted academic practice. No use, distribution or reproduction is permitted which does not comply with these terms.
*Correspondence: Zhenfeng Liang, bHpmQHhhdXQuZWR1LmNu