 Kun Huang1,2
 Fuhai Chi
- 1School of Electronic Science and Engineering, Southeast University, Nanjing, China
- 2NARI Technology Co., Ltd, Nanjing, China
- 3State Grid Shanghai Electric Power Company, Shanghai, China
- 4State Grid Shanghai Electric Power Company Electric Power Research Institute Shanghai, Shanghai, China
The penetration of renewables has been increasing nowadays. The traditional transformer can no longer meet the requirements of utilities. For this reason, a power electronic transformer (PET) is proposed as one of the promising alternatives. However, there are coupling issues between the PET and the connected converters in the low-voltage grid. To study the issues effectively, this article developed impedance models of the PQ node, PV node, and PET. Based on the models, the system stability under different scenarios is assessed by the generalized Nyquist criterion. The effects of the line impedance and control parameters on system stability are studied. Moreover, a comprehensive parameter sensitivity analysis was carried out to reveal the coupling mechanism between converters. Simulations are given to validate the effectiveness of the theoretical analyses.
Introduction
With the high penetration of renewable generation systems in the grid, the configuration of the grid and the voltage level is increasingly complex. The traditional transformer no longer meets people’s need (Chena et al., 2021). Due to its significant advantages, such as isolation protection and improvement of voltage quality, the PET gradually substitutes the traditional transformer in the distributed grid (Lu et al., 2016; Li et al., 2018; Chen et al., 2021). However, the PET low-level side converter will cause coupling problems with connected converters. It is necessary to analyze the characteristics of the PET-based distributed grid.
To well study the characteristics of the PET-based distributed grid, the first step was to establish an impedance model of converters. Basically, the small-signal modeling method is used to model the system and is divided into two categories (Chen et al., 2018; Xiong et al., 2020): the time-domain method based on the state-space model and the frequency-domain method based on the impedance model. Compared with the time-domain method, the frequency-domain method can easily get the system output impedance. Thus, the frequency-domain method has received extensive attention. Wen et al. (2016), Wen et al. (2013), and Zou and Liserre (2020) have investigated the impedance model of the grid-following converter by considering the phase-locked loop (PLL). Based on the original impedance model of the grid-following converter, Zeng et al. (2020) proposed the simplified impedance model, and it could be used to assess the system stability. Wang et al. (2018) studied the unified impedance model of the grid-following converter under three-phase balanced and unbalanced conditions. Cavazzana et al. (2019) studied the impedance model of the grid-forming converter, and impedance measurement was used to verify it. Liu et al. (2022) proposed the unified modeling method for the grid-following converter and grid-forming converter. Wang et al. (2020) established the model among voltage, current, phase angle, and the dynamic characteristics of parallel grid-forming converters were analyzed.
Based on impedance models, the system stability can be analyzed. Wen et al. (2016) investigated the influence of control parameters in the grid-following converter when the converter was connected to the grid. Liu et al. (2022) investigated the stability of a radial grid that contained different converters, and the parameter sensitivity was proposed to analyze parameters’ influence on system stability. Zou et al. (2021) investigated the stability of two parallel grid-following converters. The authors mainly investigated the coupling mechanism between two converters. Chen et al. (2019) investigated the stability of PET under an unbalanced load. Currently, most researchers mainly focus on the stability when converters are connected to the grid and the stability of a single PET. Few literature reports study the system stability when converters are connected to PET.
To bridge this gap, this article first established impedance models of the PQ node, PV node, and slack bus, which correspond to the grid-following converter, grid-forming converter, and PET, respectively, in the distributed grid. Based on impedance models, the closed-loop poles are used to assess the system stability. The effect of line impedance and kpv on system stability when PET is connected to different nodes are investigated, especially the effect of the impedance ratio R/X. In order to analyze the coupling mechanism between the line length and kpv, the parameter sensitivity is proposed. Finally, the abovementioned models and theories are verified by simulations.
Impedance Model of the PET-Based Distributed Grid
Impedance Model of the PQ Node
The output power of the grid-following converter is constant (Du et al., 2021), and it is seen as a PQ node. Its typical configuration is shown in Figure 1A. When small-signal perturbations are added to the grid voltage, the controller d-q frame is no longer aligned with the system d-q frame. There exists a difference between two d-q frames. The relationship between vectors in two frames is
where c represents symbols in the controller d-q frame, s represents symbols in the system d-q frame, vd and vq represent voltage perturbation in d frame and q frame, and Vd and Vq represent voltage stable values in the d frame and q frame, respectively. For clarity, uppercase letters (for example, Vd) in this article are used to denote voltage and current stable values, and lowercase letters (for example, vd) represent the small-signal perturbation.
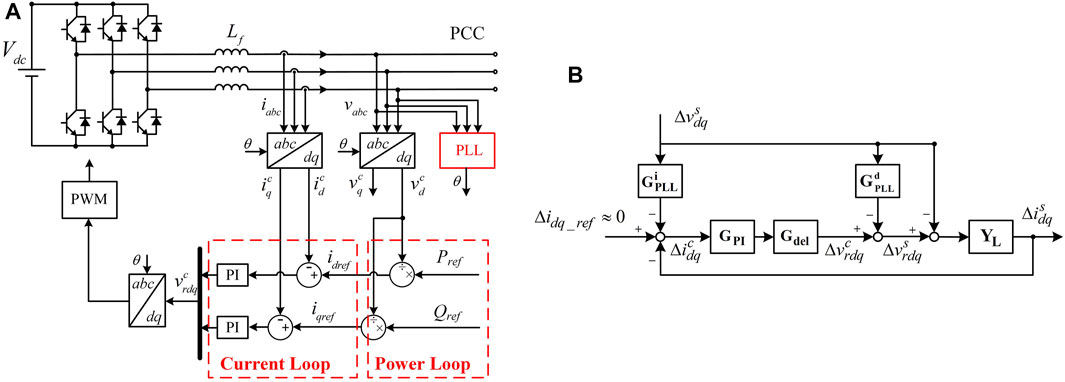
FIGURE 1. PQ node configuration and impedance model: (A) configuration, (B) impedance model.
Δθ is related to PLL, which is
where GPLL is the PLL closed-loop transfer function, which is as follows (Wen et al., 2016):
By adding (2) to (1)
Then,
For current and converter output voltage, the similar equations can be derived as follows:
Then,
According to (4), (6), and (7), the small-signal model of the PQ node is developed in Figure 1B. Solving the equations represented by Figure 1B, the output impedance of the PQ node is as follows:
where YL represents the filter transfer function matrix, Gdel represents time delay due to digital control and PWM, GPI represents the PI controller in the current loop, and E represents the second-order identity matrix. The detailed expressions of the abovementioned transfer matrices are shown in the Supplementary Appendix.
Impedance Model of the PV Node
The output active power and voltage amplitude are constant in the grid-forming converter, and it is seen as a PV node. The configuration of the PV node is shown in Figure 2A. Different from the PQ node, the transformation phase angle is provided by the power loop, and Δθ is related to active power.
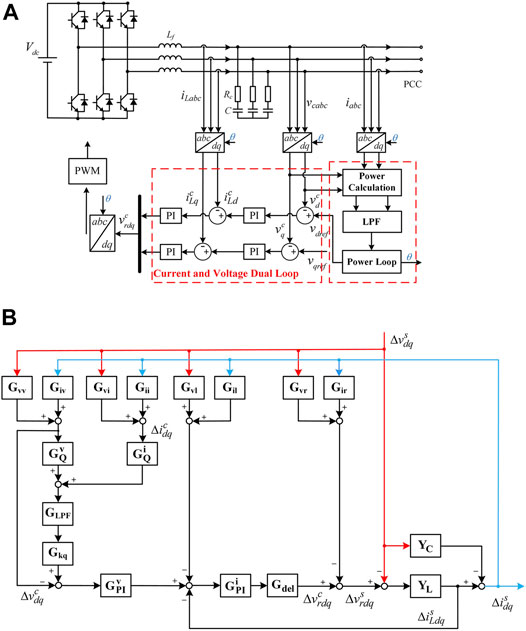
FIGURE 2. PV node configuration and impedance model: (A) configuration, (B) impedance model.
However,
Combining (11) and (12), similar small-signal equations can be determined for voltage and current in the PV node, which yields
Gi (i = vv,iv … … ,ir) models the small-signal perturbation path from system vectors to controller vectors. Figure 2B shows the small-signal model of the PV node. GvQ and GiQ model the small-signal perturbation path from the voltage and current to reactive power. GLPF represents the low-pass filter transfer function matrix. Gkq represents the reactive power drop coefficient transfer function matrix. GvPI and GiPI represent the PI controller in the voltage loop and current loop, respectively. YC represents the capacitor transfer function. The detailed expressions of the abovementioned transfer functions are shown in the Supplementary Appendix.
The output impedance can be derived from Figure 2B, which is
Impedance Model of PET
Due to the existence of large capacitors in PET, the middle-voltage side and low-voltage side can achieve decoupling. Thus, the middle-voltage side can be equivalent to constant DC voltage. The simplified PET configuration is shown in Figure 3A. Due to the constant output voltage amplitude and frequency, PET is seen as a slack bus. Different from PQ and PV nodes, the transformation phase angle in a slack bus is constant, and two d-q frames are aligned together, which means Δθ is zero. According to Figure 3A, the small-signal model of a slack bus is developed in Figure 3B. The output impedance of the slack bus is derived from Figure 3B, which is
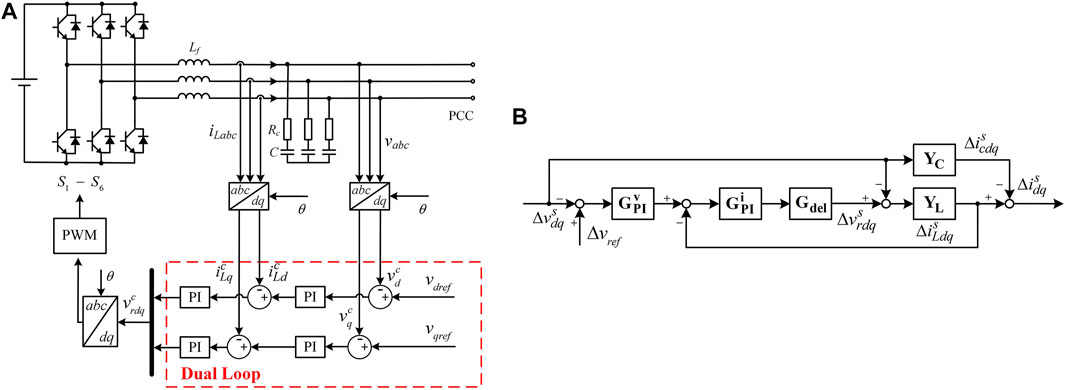
FIGURE 3. PET configuration and impedance mode: (A) configuration, (B) impedance model.
Stability Analysis
The configuration of the PET-based distributed network is shown in Figure 4. ZL is the line impedance that varies with the line length. For the PQ node, the system closed-loop transfer function is as follows (Sun, 2011):
where Zload is the load impedance, Zvsi is the node impedance, and E is the second-order identity matrix. For the PV node, the system closed-loop transfer function is as follows (Sun, 2011):
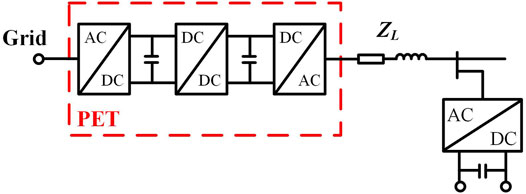
FIGURE 4. System configuration.
The system stability is related to the poles of H(s). The system is stable unless the poles of H(s) are in the left-half plane.
Stability Analysis of the PQ Node
The system parameters are given in Table 1. When PET connects to the PQ node, the root loci with the change of the line length are shown in Figure 5. As shown in Figure 5A, when the R/X ratio is smaller than 1, the root locus enters the right-half plane, and the system becomes unstable by an increase in the line length. As shown in Figure 5B, when the R/X ratio is larger than 1, the phenomenon is the same as that when the R/X ratio is smaller than 1. This is because the grid-following converter is suitable for the strong grid. By an increase in the line length, the grid is weaker than before, and the grid-following converter becomes unstable.

TABLE 1. Conclusions.
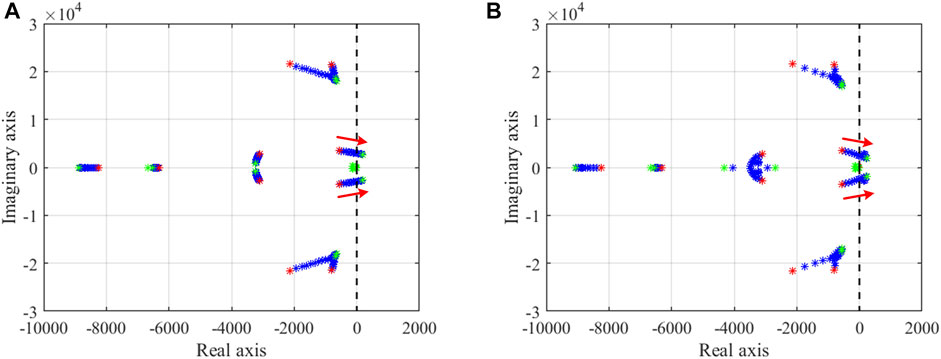
FIGURE 5. Root locus with the change of the line impedance (PQ node): (A) R/X ratio is smaller than 1, (B) R/X ratio is larger than 1.
In addition to the influence of the line length, the R/X ratio also affects system stability. In order to investigate the influence of the R/X ratio, the stability margin is introduced and defined as the distance between the closed-loop dominant pole and imaginary axis. The stability margin is high if the closed-loop dominant pole is far away from the imaginary axis. The relationship between the R/X ratio and stability margin is shown in Figure 6. Comparing Figure 6A and Figure 6B, the R/X ratio larger than 1 is more beneficial for system stability in most cases which means this system is suitable for the resistive line.
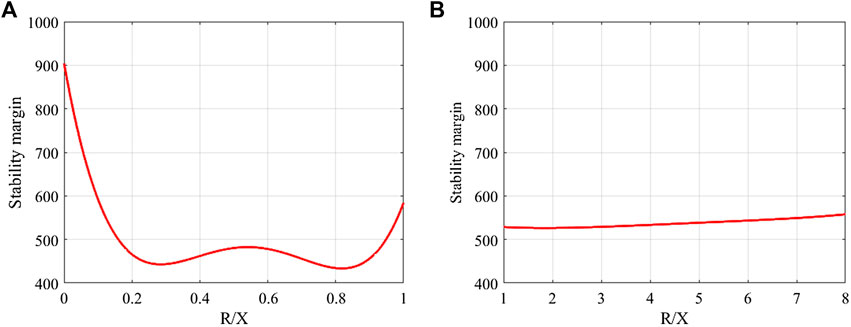
FIGURE 6. Relationship between impedance ratio and stability margin (PQ node): (A) R/X ratio is smaller than 1, (B) R/X ratio is larger than 1.
The low-voltage side converter in PET will cause coupling problems with the connected converters, and its parameters also affect the system stability. Figure 7 shows the influence of the voltage loop proportional gain kpv in PET. By increase of kpv, the system becomes unstable. This indicates that the lower value of kpv is beneficial for the system stability.
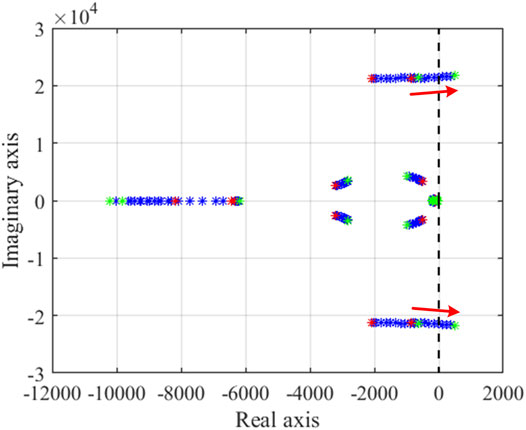
FIGURE 7. Root locus with the change of kpv (PQ node).
Stability Analysis of the PV Node
When PET connects to the PV node, the root loci with the change of the line length are shown in Figure 8. As shown in Figure 8A, when the R/X ratio is smaller than 1, the root locus enters the left-half plane, and the system becomes stable by an increase in the line length. As shown in Figure 8B, when the R/X ratio is larger than 1, the phenomenon is the same as that when the R/X ratio is smaller than 1. Under different R/X ratios, by an increase in the line length, the root locus enters the left-half plane, and the system becomes stable. This is because the grid-forming converter is suitable for the weak grid. By an increase in the line length, the connected grid is weaker, and the grid-forming converter is more stable.
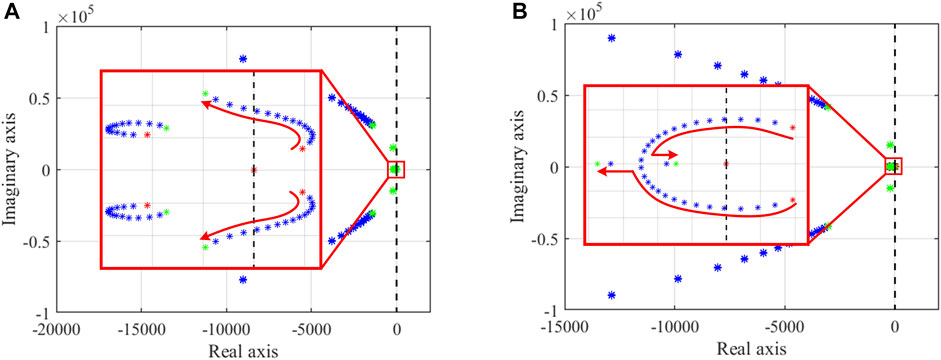
FIGURE 8. Root locus with the change of the line impedance (PV node): (A) R/X ratio is smaller than 1, (B) R/X ratio is larger than 1.
The relationship between the R/X ratio and stability margin is shown in Figure 9. The R/X ratio smaller than 0 shows that the system is unstable under this circumstance. Comparing Figure 9A and Figure 9B, the R/X ratio smaller than 1 is more beneficial for system stability in most cases, which means that this system is suitable for the inductive line.
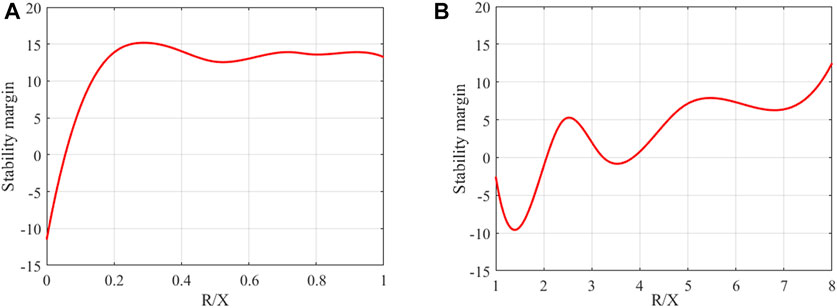
FIGURE 9. Relationship between impedance ratio and stability margin (PV node): (A) R/X ratio is smaller than 1, (B) R/X ratio is larger than 1.
Figure 10 shows the influence of kpv. By increase of kpv, the system becomes unstable. It indicates that the larger kpv is not beneficial for system stability.
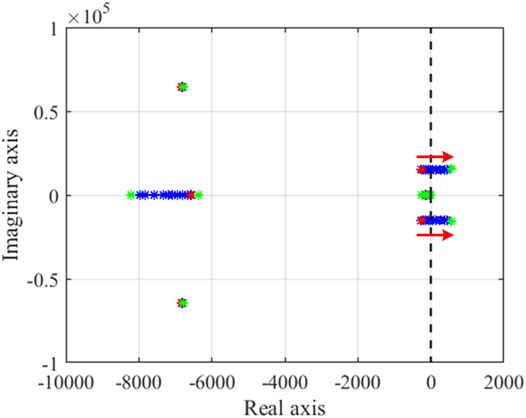
FIGURE 10. Root locus with the change of kpv (PV node).
Parameter Sensitivity Analysis
In this section, a parameter sensitivity analysis is performed, which investigates the effects of parameter variations on system stability and the coupling effect among parameters. Among all the control parameters in the system, kpv and line length are investigated. The parameter sensitivity is defined as dσ/dx, where σ is the real part of the closed-loop dominant pole, and x is kpv and line length. The parameter sensitivity smaller than 0 represents this parameter is not conductive to the system stability. The parameter sensitivity larger than 0 represents this parameter improves the system stability.
When PET and PQ nodes are connected, the parameter sensitivity of kpv and line length are shown in Figure 11A and Figure 11B, respectively. As shown in Figure 11A, a small range of kpv will result in a large change in the system stability, and its influence on stability varies with the line length. This indicates that kpv plays a major impact on system stability, and the line length will influence the effect of kpv on system stability. Comparing Figure 11A and Figure 11B, kpv sensitivity is larger than that of the line length, which means it is more important to set a proper value of kpv in designing the system.
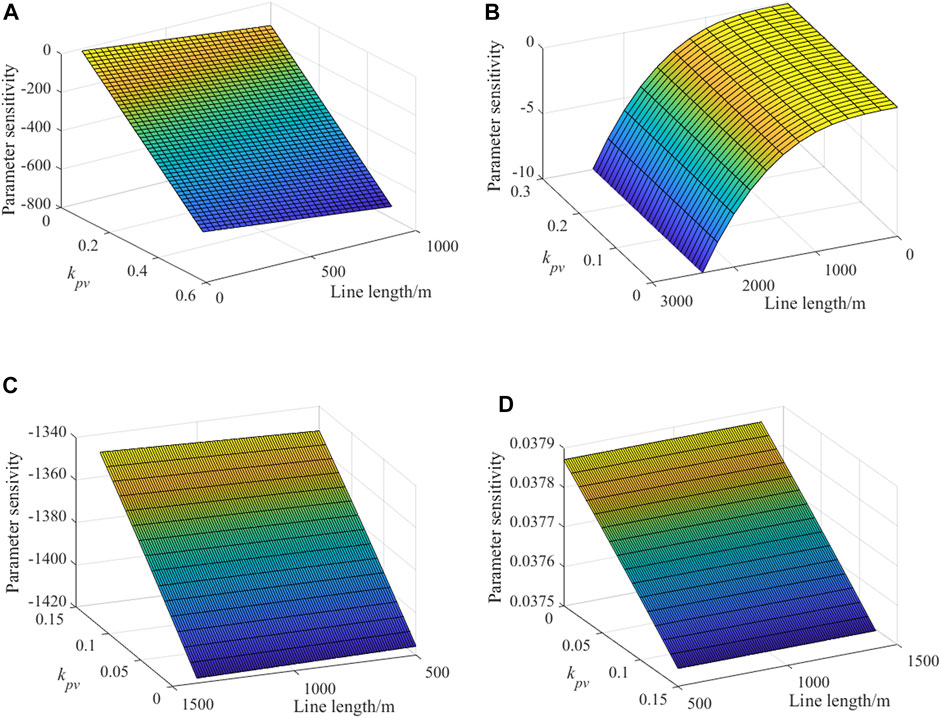
FIGURE 11. Parameter sensitivity: (A) kpv (PQ node), (B) line length (PQ node), (C) kpv (PV node), (D) line length (PV node).
When PET and PV nodes are connected, the parameter sensitivity of kpv and line length are shown in Figure 11C and Figure 11D, respectively. As shown in Figure 11D, the parameter sensitivity is larger than 0. This corresponds with the previous analysis. The increase in the line length improves system stability. Comparing Figure 11C and Figure 11D, kpv sensitivity is larger than that of the line length.
Overall, the aforementioned conclusions are shown in Table 1.
Simulation Verification
In order to validate the previous conclusions, the system stability is assessed by MATLAB/Simulink. Simulation parameters are shown in Table 2.
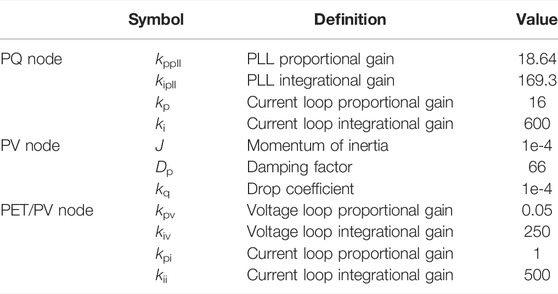
TABLE 2. Simulation parameters.
When PET and PQ nodes are connected, the PET output voltage and current with the change in the line length are shown in Figure 12A and Figure 12B. As shown in Figure 12A, when the R/X ratio is smaller than 1, the system becomes unstable by an increase in the line length. As shown in Figure 12B, when the R/X ratio is larger than 1, the system becomes unstable by an increase in the line length. With the change in the line length, high-frequency instability occurs. Comparing Figure 12A and Figure 12B, the unstable harmonic frequency when the R/X ratio is smaller than 1 is larger than that when the R/X ratio is larger than 1. By increase of kpv, the output voltage and current are shown in Figure 12C. With the change in kpv, the system becomes unstable immediately.
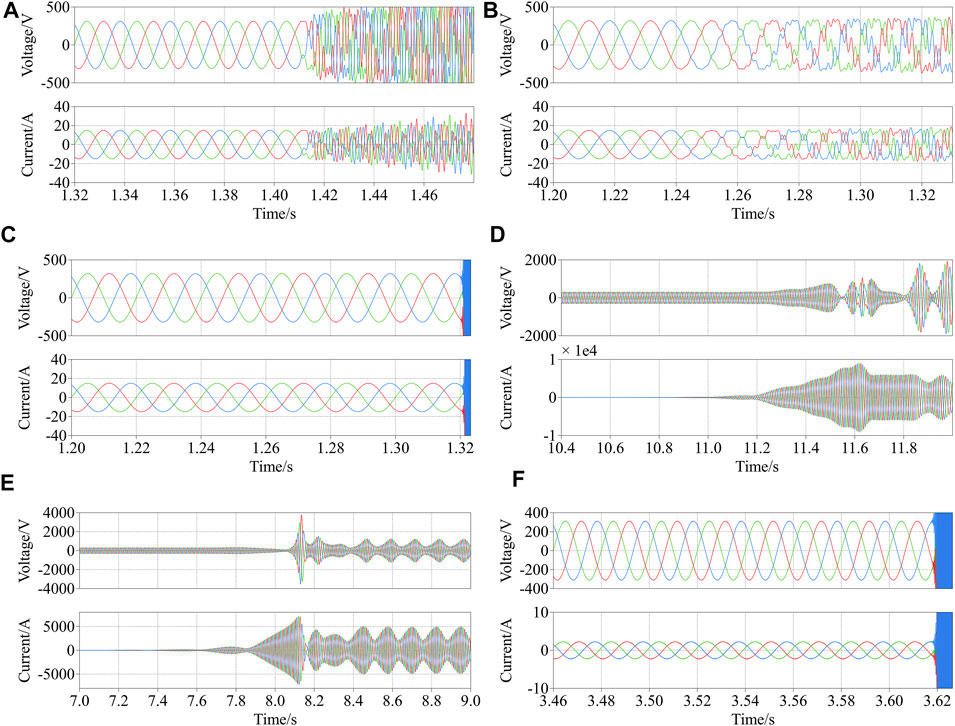
FIGURE 12. Voltage and current waveforms: (A) R/X ratio is smaller than 1 (PQ node), (B) R/X ratio is larger than 1 (PQ node), (C) kpv (PQ node), (D) R/X ratio is smaller than 1 (PV node), (E) R/X ratio is larger than 1 (PV node), (F) kpv (PV node).
When PET and PV nodes are connected, the PET output voltage and current with the change in the line length are shown in Figure 12D and Figure 12E. As shown in Figure 12D, when the R/X ratio is smaller than 1, the system becomes unstable by a decrease in the line length. As shown in Figure 12E, when the R/X ratio is greater than 1, the system becomes unstable by a decrease in the line length. The decrease in the line length under different R/X ratios causes low-frequency instability. By increase of kpv, the output voltage and current are shown in Figure 12F. With the change of kpv, the system becomes unstable immediately. Simulation results correspond to previous theoretical analysis.
Conclusion
Impedance models of the generalized PQ node, PV node, and PET are developed in this article. Based on several impedance models, the influence of the line impedance and PET control parameters on system stability is discussed; in particular, the influence of the R/X ratio on stability has been analyzed. This indicates that the PQ node is suitable for the resistive electric network, and the PV node is suitable for the inductive network. The increase of kpv of the PET can compromise system stability. Moreover, a comprehensive parameter sensitivity is analyzed. This revealed the sensitivity of system stability to the variation of each parameter. The stability is more sensitive to the control parameter than that of the system parameter.
Data Availability Statement
The original contributions presented in the study are included in the article/Supplementary Material, further inquiries can be directed to the corresponding author.
Author Contributions
Conceptualization, KH and FC; methodology, ZD; software, MF; validation, CL and ZY; formal analysis, KH; investigation, ZY; resources, CL; data curation, ZD; writing—original draft preparation, KH; writing—review and editing, KH and FC; visualization, MF; supervision, KH and FC; project administration, ZD; funding acquisition, MF. All authors have read and agreed to the published version of the manuscript.
Funding
This research was funded by the STATE GRID, grant number is 52094021N00R.
Conflict of Interest
Authors KH, FC, MF, and CL were employed by NARI Technology Co., Ltd
The remaining authors declare that the research was conducted in the absence of any commercial or financial relationships that could be construed as a potential conflict of interest.
Publisher’s Note
All claims expressed in this article are solely those of the authors and do not necessarily represent those of their affiliated organizations, or those of the publisher, the editors, and the reviewers. Any product that may be evaluated in this article, or claim that may be made by its manufacturer, is not guaranteed or endorsed by the publisher.
Supplementary Material
The Supplementary Material for this article can be found online at: https://www.frontiersin.org/articles/10.3389/fenrg.2022.930708/full#supplementary-material
References
Cavazzana, F., Khodamoradi, A., Abedini, H., and Mattavelli, P. (2019). “Analysis of an Impedance Modeling Approach for Droop-Controlled Inverters in System DQ Frame,” in 2019 IEEE Energy Conversion Congress and Exposition (ECCE), Baltimore, CD, USA, 29 Sept.-3 Oct. 2019. doi:10.1109/ECCE.2019.8913275
Chen, J., Liu, M., De Carne, G., Zhu, R., Liserre, M., Milano, F., et al. (2021). Impact of Smart Transformer Voltage and Frequency Support in A High Renewable Penetration System. Electr. Power Syst. Res. 190, 106836. doi:10.1016/j.epsr.2020.106836
Chen, J., Liu, M., OrDonnell, T., and Milano, F. (2021). Modelling of Smart Transformers for Power System Transient Stability Analysis. IEEE J. Emerg. Sel. Top. Power Electron., 1. doi:10.1109/JESTPE.2021.3101123
Chen, J., Yang, T., O'Loughlin, C., and O'Donnell, T. (2019). Neutral Current Minimization Control for Solid State Transformers under Unbalanced Loads in Distribution Systems. IEEE Trans. Ind. Electron. 66, 8253–8262. doi:10.1109/TIE.2018.2883266
Chen, X., Wang, Y., Gong, C., Sun, J., He, G., Li, G., et al. (2018). Overview of Stability Research for Grid-Connected Inverters Based on Impedance Analysis Method. Proc. CSEE 38, 2082–2094. (in Chinese). doi:10.13334/j.0258-8013.pcsee.171259
Du, W., Tuffner, F. K., Schneider, K. P., Lasseter, R. H., Xie, J., Chen, Z., et al. (2021). Modeling of Grid-Forming and Grid-Following Inverters for Dynamic Simulation of Large-Scale Distribution Systems. IEEE Trans. Power Deliv. 36, 2035–2045. doi:10.1109/TPWRD.2020.3018647
Li, Z., Gao, F., Zhao, C., Wang, Z., Zhang, H., Wang, P., et al. (2018). Research Review of Power Electronic Transformer Technologies. Proc. CSEE 38, 1274–1289. (in Chinese). doi:10.13334/j.0258-8013.pcsee.172575
Liu, X., Zou, Z., Yang, J., Tang, J., Liu, Z., Buticchi, G., et al. (2022). Stability Assessment of A Radial Grid with Power Converters. IEEE Open J. Power Electron. 3, 61–74. doi:10.1109/OJPEL.2021.3138509
Lu, Z., Zhao, G., Yang, D., and Zeng, X. (2016). Overview of Research on Power Electronic Transformer in Distribution Network. Proc. CSU-EPSA. 8, 48–54. (in Chinese). doi:10.3969/j.issn.1007-3175.2021.07.002
Sun, J. (2011). Impedance-Based Stability Criterion for Grid-Connected Inverters. IEEE Trans. Power Electron. 26, 3075–3078. doi:10.1109/TPEL.2011.2136439
Wang, S., Liu, Z., and Liu, J. (2020). Terminal-characteristics Based Small-Signal Modeling and Stability Analysis for Parallel Droop-Controlled Inverter System. J. Power Supply 18, 83–94. (in Chinese). doi:10.13234/j.issn.2095-2805.2020.2.83
Wang, X., Harnefors, L., and Blaabjerg, F. (2018). Unified Impedance Model of Grid-Connected Voltage-Source Converters. IEEE Trans. Power Electron. 33, 1775–1787. doi:10.1109/TPEL.2017.2684906
Wen, B., Boroyevich, D., Burgos, R., Mattavelli, P., and Shen, Z. (2016). Analysis of D-Q Small-Signal Impedance of Grid-Tied Inverters. IEEE Trans. Power Electron. 31, 675–687. doi:10.1109/TPEL.2015.2398192
Wen, B., Boroyevich, D., Mattavelli, P., Shen, Z., and Burgos, R. (2013). “Influence of Phase-Locked Loop on Input Admittance of Three-phase Voltage-Source Converters,” in Influence of phase-locked loop on input admittance of three-phase voltage-source converters. 2013 Twenty-Eighth Annual IEEE Applied Power Electronics Conference and Exposition (APEC), Long Beach, CA, USA, March 2013, 17–21. doi:10.1109/APEC.2013.6520317
Xiong, L., Liu, X., Liu, Y., and Zhuo, F. (2020). Modeling and Stability Issues of Voltage-Source Converter Dominated Power Systems: A Review. Csee Jpes, 1–18. doi:10.17775/CSEEJPES.2020.03590
Zeng, Z., Xiao, H., Gao, B., Ding, J., Wang, Z., Hua, W., et al. (2020). Simplified Small-Signal Modeling Method of Grid-Connected Inverters and its Applications. Proc. CSEE 40, 7002–7012. (in Chinese). doi:10.13334/j.0258-8013.pcsee.191617
Zou, Z.-X., and Liserre, M. (2020). Modeling Phase-Locked Loop-Based Synchronization in Grid-Interfaced Converters. IEEE Trans. Energy Convers. 35, 394–404. doi:10.1109/TEC.2019.2939425
Keywords: PET, stability, parameter sensitivity, PQ node, PV node
Citation: Huang K, Chi F, Dou Z, Yang Z, Fu M and Liu C (2022) Stability Assessment of the PET-Based Distributed Grid. Front. Energy Res. 10:930708. doi: 10.3389/fenrg.2022.930708
Received: 28 April 2022; Accepted: 09 May 2022;
Published: 19 July 2022.
Edited by:
Liansong Xiong, Nanjing Institute of Technology (NJIT), ChinaReviewed by:
Wenzhou Lu, Jiangnan University, ChinaJunru Chen, Xinjiang University, China
Ying Zhu, Hohai University, China
Copyright © 2022 Huang, Chi, Dou, Yang, Fu and Liu. This is an open-access article distributed under the terms of the Creative Commons Attribution License (CC BY). The use, distribution or reproduction in other forums is permitted, provided the original author(s) and the copyright owner(s) are credited and that the original publication in this journal is cited, in accordance with accepted academic practice. No use, distribution or reproduction is permitted which does not comply with these terms.
*Correspondence: Fuhai Chi, Y2hpZnVoYWlAc2dlcHJpLnNnY2MuY29tLmNu