 Lanfei He1
 Lie Li
- 1State Grid Hubei Electric Power Co.,Ltd., Economic and Technological Research Institute, Wuhan, China
- 2School of Electrical Engineering and Automation, Wuhan University, Wuhan, China
The reliability of a high-capacity power transformer is fundamental to the stable operation of power systems. However, characterization of the transformer aging process is a difficult task, considering the diverse aging factors in its life cycle. This prevents effective management of such equipment. In the work, we study the aging phenomenon of power system transformers, whose representative degeneration variables are extracted from real transformer operational data. Combining with the average life of the equipment, the extracted features are used as indicators for the transformer reliability evaluations. We developed a deep learning–based approach using a convolutional neural network for effective equipment life prediction. The performance of the transformer life prediction model is verified using field-test data, which demonstrates the superior accuracy of the presented approach.
Introduction
The model power system quickly evolved with the accelerated marketization incentives. In this process, the safety and reliability of the power system became important concerns to be addressed. With the narrower profit margin, the system operators face multiple challenges: ensuring safety, reducing electricity prices, and increasing efficiency. In recent years, the system operator of China, State Grid, has found a relatively low age among scrapped samples and a relatively high proportion of over-aged samples among the transformer equipment. The problems are as follows: First, the scrapping age of substation equipment is usually 6–10 years, and the average service life of main equipment is lower than the transformer depreciation period and the pricing depreciation period. To a certain extent, this will result in a waste of depreciation costs. It is difficult to fully incorporate into the cost of transmission and distribution prices. Second, the over-aged transformers have accounted for 10% of the original value of the physical assets of the power grid. Some of the over-aged transformers can still operate normally. Under strict supervision and examination requirements, the over-aged transformers cannot be depreciated, which reduces the electricity price level and the company’s investment capacity.
Reliability is an important indicator for verifying the safe operation of equipment (Song and Cheng, 2015). It refers to the ability or possibility of equipment to perform specified functions without failure within a certain period and under certain conditions (Song, 2001). Overall, the operating life of primary equipment in the power grid is significantly different, and this difference increases the difficulty of primary equipment reliability assessment and reasonable life estimation. Particularly in the field of reasonable life prediction of transformers, this difference in phenomena is rarely studied in current research.
Transformers are the current representative of large-power equipment, which include multiple failure forms such as discharge, overheating, or both (Castro and Miranda, 2005; Jongen et al., 2007; Zheng et al., 2012; Fox et al., 2019). The reasonable life estimation of the transformer also belongs to the category of fault prediction. The main method is to predict the possible future failures through the historical data obtained by monitoring and to ascertain the remaining life. At present, transformer life prediction models can be divided into physical failure mechanism models and data-driven models (Abu-Elanien and Salama, 2012; Zhou, 2013; Ignacio et al., 2018; Zhang et al., 2018). The physical failure mechanism model is based on the transformer failure mechanism and mathematically characterizes the material failure process. Chen and Liu (2020) proposed a transformer life prediction model based on the hidden Markov model. Shi et al. (2020) established the Arrhenius equation based on the degradation mechanism of variable activation energy and then predicted the remaining life of the transformer. Based on the data-driven life model, the operating parameters that can characterize the degree of transformer degradation are obtained mainly based on the monitoring technology, and the operating trend of the parameters is directly predicted (Hu et al., 2022). Common operating parameters include vibration signal, noise signal, and insulating oil content (Bacha et al., 2012; Ma et al., 2013; Tian et al., 2013; Guo et al., 2017; Yan et al., 2020). This method does not involve a specific failure mechanism, so it has a wider scope including the long-short-term memory network–based life prediction model (Dai et al., 2021), the life prediction model based on the SVM algorithm with RBF as the kernel function, etc. (Wang, 2021).
However, both the physical failure mechanism model and the data-driven model are based on the specific operating conditions of the transformer, that is, monitoring the parameter distribution of the equipment in the time series and space series and predicting the life through the model (Ishak, 2010; Husnayain et al., 2016; Qian et al., 2018). However, the model established based on the aforementioned method has some limitations because the parameters are derived from a single device, so the application object is also limited to a specific type of device. State Grid’s transformers have the characteristics of a large number of equipments, wide distribution, and complex sources. It is difficult to use traditional methods to evaluate the life of all equipment.
Based on a convolutional neural network, this article proposes a transformer life prediction method considering the difference in transformer life. First, according to the factory information and scrap age information of scrapped transformers provided by a company, four types of data of rated capacity, voltage level, manufacturer, and workplace are screened out. The characteristics of its life distribution are analyzed, respectively, and data of average life, life concentration, and the proportion of high-life equipment and low-life equipment were obtained. The aforementioned total of 16 data were taken as input, and the transformer age was taken as output. The convolutional neural network was trained to obtain the life prediction model. Compared with the traditional life prediction model, the advantages of the model proposed in this article are 1) considering the influence of the life difference phenomenon on the reliability of the transformer, the prediction accuracy is improved; 2) since the input is the equipment delivery and operation information and does not involve the specific operation conditions, the life prediction can be carried out before operation, and the operation and maintenance strategy can be formulated as soon as possible according to the prediction results.
Life Difference Phenomenon
Statistical statistics are carried out on the decommissioned, scrapped, and to-be-scrapped transformers of a power supply company, and a statistical graph is drawn, as shown in Figure 1. It can be found that the life distribution of the transformer is close to the normal distribution. Most of the equipment life is in the middle interval, and there are few high-life equipment and low-life equipment. However, this phenomenon increases the difficulty of equipment operation and maintenance. For possible low-life equipment, it should be the focus of attention and is necessary to increase the frequency of maintenance, timely maintenance, and improve equipment reliability. For possible long-life equipment, appropriate attention can be reduced to save costs, analyzing the life distribution chart; dividing the equipment into older equipment, normal equipment, and younger equipment according to the distribution law of equipment life; and counting their proportions in the total equipment respectively; and summarizing the distribution law of equipment life. The equipment is divided into 5-year intervals. With the increase in service life, the service life in this interval increases first and then decreases; The pieces of equipment with a service life of 11–15 years are more than twice that of 6–10 years, and the increase is significantly greater than that in other ranges. The pieces of equipment with a service life of 36–40 years are less than 1/2 of that of 31–35 years, and the decrease is significantly greater than that in other intervals. Therefore, equipment with a service life of 10 years or less (main transformer and disconnector) is defined as low-life equipment, equipment with a service life of 36 years or more is defined as high-life equipment, and other equipment is defined as normal equipment.
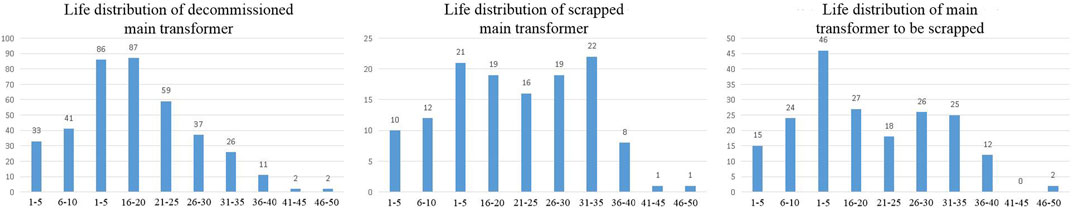
FIGURE 1. Life distribution.
When the equipment is put into operation, it is necessary to evaluate the reliability of the equipment to facilitate the formulation of the operation and maintenance strategy. Due to the lack of operational data as the basis for evaluation, the equipment can only be roughly evaluated through historical data, such as manufacturer and operation city before the equipment is put into operation. Due to different production processes, equipment produced by different manufacturers will also have different characteristics in reliability. Similarly, different operating cities will have different working environments, which will further affect the reliability of the equipment. The extraction of reliable data from this kind of text information is key to the reliable evaluation of equipment before operation.
Extraction of Transformer Aging Factors
In the transformer operation and maintenance data, the average life is the most intuitive embodiment of equipment reliability, and it is also important data that can be used for life prediction. However, the data on average life cannot reflect the impact of life differentiation. Therefore, it is necessary to extract the aging factors that can reflect the phenomenon of life differentiation from the transformer life distribution data to improve the accuracy of reasonable life prediction.
The life differentiation characteristics of equipment can be described by three parameters: life concentration, the proportion of high-life equipment, and low-life equipment. Life concentration indicates the concentration degree of transformer life distribution. The more the proportion of main transformers is close to the average life, the higher the life concentration. The proportion of high life and low life is the proportion of transformers with a life of more than 35 years and less than 10 years in the total number, which can be obtained directly through statistics.
Because the Weibull distribution can be used to describe the characteristics of equipment life distribution, life concentration and average life can be expressed by the relevant characteristics of the Weibull distribution (Zhou et al., 2013). The Weibull distribution was proposed by Swedish physicist W. Weibull in 1939. It is mainly used to describe the probability distribution of material fatigue strength. The Weibull distribution is widely used in reliability engineering, especially in the distribution form of cumulative wear failure of electromechanical products. Due to the ease of inferring the distribution parameters using the probability value, it is widely used in the data processing of various life tests. The probability density of the Weibull distribution is shown in Eq. (1).
where α is the scale parameter and
The fitting method of the Weibull distribution characteristic parameters is as follows:
1) The service lives of n different equipment with the same feature were arranged from short to long, which are
2) Eq. (3) was used to calculate the unbiased estimation of fatigue cumulative distribution
3) Eq. (4) was fitted to obtain an unbiased estimation of
Now, the reliability information such as the rated capacitance, voltage grade, manufacturer and affiliated company of the main transformer, and the corresponding proportional parameters are counted, respectively; scale parameter,
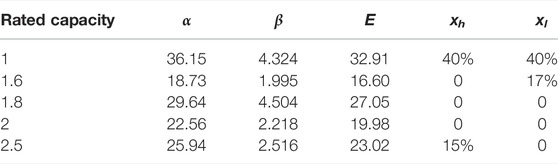
TABLE 1. Corresponding parameters of equipment with rated capacity.
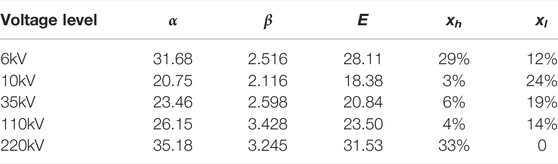
TABLE 2. Corresponding parameters of equipment at each voltage level.
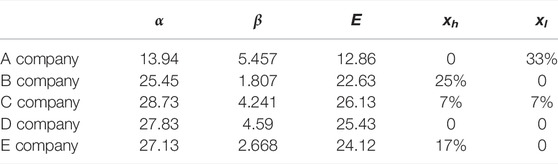
TABLE 3. Corresponding parameters of equipment of each manufacturer.
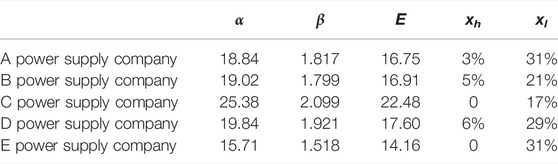
TABLE 4. Corresponding parameters of equipment of all affiliated companies.
Next, according to the aforementioned data and combined with the life distribution of equipment, a reasonable life prediction model of transformers based on a convolutional neural network is established.
AI-Based Approach to the Life Prediction Model
Convolutional Neural Network
In recent years, with the rapid development of the computer field, deep learning has been applied to all aspects. The convolutional neural network possesses a considerable ability for face recognition and image recognition and has great application prospects in the field of transformer fault diagnosis. In this article, a reasonable life prediction model of a transformer is constructed based on a convolutional neural network. A convolutional neural network generally includes an input layer, convolution layer, pooling layer, full connection layer, and output layer (Zhou et al., 2017). Taking one-dimensional data as an example, its general structure is shown in Figure 2.

FIGURE 2. Convolutional neural network.
The input layer is the input data of some characteristic quantities, including rated capacity, voltage level, manufacturer, and workplace. These are transformed into digital features using the Weibull distribution as input, such as
The convolution layer is equivalent to a feature-extraction process. The important features are extracted through the convolution kernel during the movement of the input layer, as shown in Figure 2. Taking the 1*3 convolution kernel as an example, the calculation process is as follows:
where x is input,
The pooling layer mainly reduces the amount of calculation in the neural network, as shown in Figure 2. Taking the 1*2 maximum pooling layer as an example, the calculation process is as follows:
The full connection layer is the neural network, as shown in Figure 2. Its calculation steps are as follows:
Similarly, the calculated results can use Relu, Tanh, and other activation functions as the output of each neuron in the whole connection layer, that is,
The calculation process of the output layer is the same as that of the full connection layer. As shown in Eq. 9, the Softmax function is used in the activation function, and the expression is as follows:
Life Prediction Model
The life prediction model is shown in Figure 3. First, the four characteristic quantities of voltage grade, rated capacity, manufacturer, and workplace are obtained using the Weibull distribution, and a total of 16 characteristics are used as the input layer of the model. The data output from the convolution layer is fused through the data, integrated into one-dimensional data, and sent to the fully connected neural network. The life prediction is divided into eight intervals. 1–5 years is the first interval, and the probability of the result falling into this interval is P1. 6–10 years is the second interval, and the probability of the result falling into this interval is P2, and so on. The last interval is 35–40 years, and the probability of the result falling into this interval is P8. The activation layer of the convolutional neural network adopts the Relu function, the fully connected neural network adopts the Tanh function, and the output layer adopts the Softmax function (see Table 5 for specific parameters).
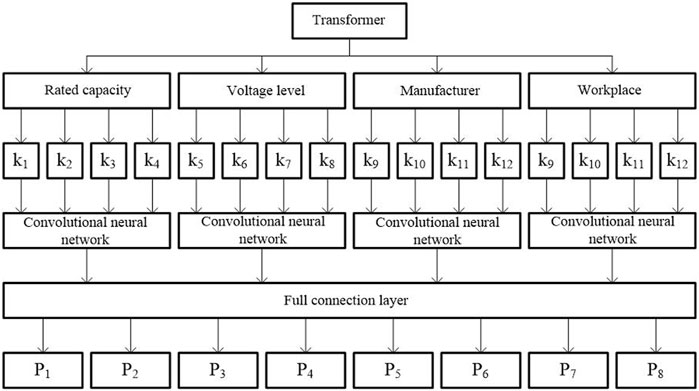
FIGURE 3. Life prediction model.

TABLE 5. Life prediction model parameters.
Accuracy Verification of Life Prediction Model
Verification of AI-Based Approach to the Life Prediction Model
K-fold cross-validation is adopted for the data set. That is, the data set is divided into k copies, of which k-1 is used as training data and the remaining one is used as test data. There are 501 groups of transformer data in total. A total of 100 groups were considered test data and the rest as training data. The training process is shown in Figure 4.
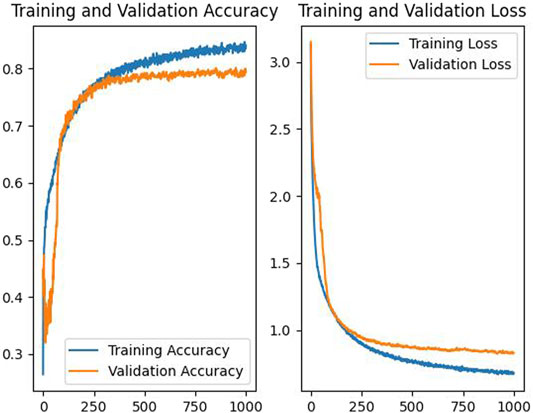
FIGURE 4. Training process.
The prediction results of the last 100 test data are shown in Figure 5. Through TSNE visualization, the classification results of 100 data types are displayed, as shown in Figure 6.
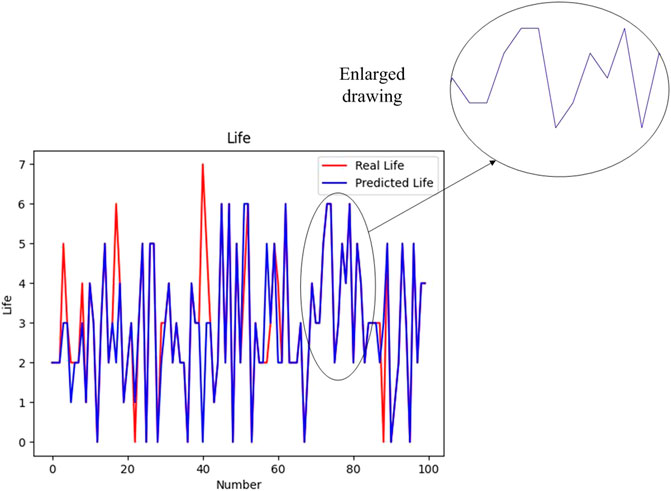
FIGURE 5. Prediction results.
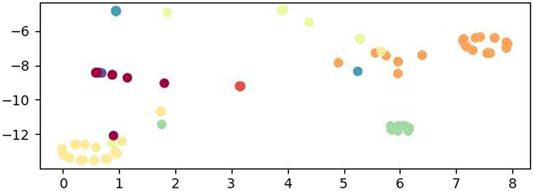
FIGURE 6. TSNE visualization results.
It can be seen from Figure 5 that most of the prediction results are consistent. Each color in Figure 6 represents a prediction interval. It can be seen that the graphs of each interval are well distinguished. It shows that the life prediction model has high accuracy, and the life prediction confusion matrix of each classification is shown in Figure 7.
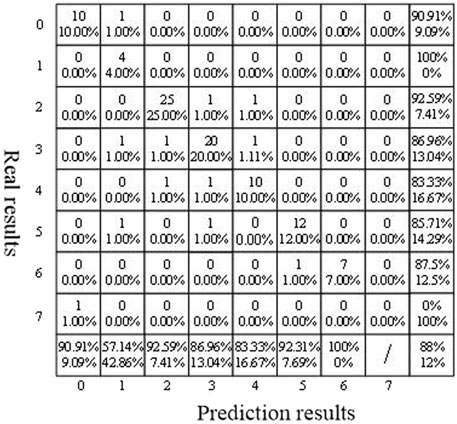
FIGURE 7. Confusion matrix.
The accuracy is low due to the small number of training and tests in the eighth division. The prediction accuracy of other life intervals is high, which is more than 80%.
Comparison With Other Models
To verify the superiority of the model in transformer life prediction, the model is compared with the following other models.
1) Prediction results of different models
To verify the ability of the convolutional neural network in life prediction, decision tree, random forests, support vector machine, neural network, and deep confidence network were used to simulate the same data. The simulation results are shown in Table 6.
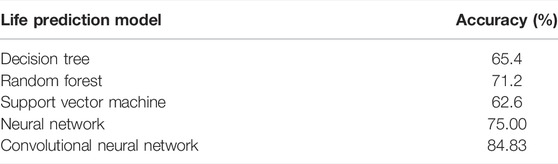
TABLE 6. Comparison of different life prediction models.
It can be seen from Table 6 that a convolutional neural network has higher prediction accuracy in transformer life prediction. Compared with the current common prediction algorithms, the accuracy is improved by more than 10%.
2) Influence of life differentiation on life prediction results
To verify the impact of life differentiation on life prediction results, only the average life in the data of rated capacity, voltage level, manufacturer, and the working city was considered. Four data of k1, k5, k9, and k11 were used as the input of the convolutional neural network. The training results are shown in Figure 8.
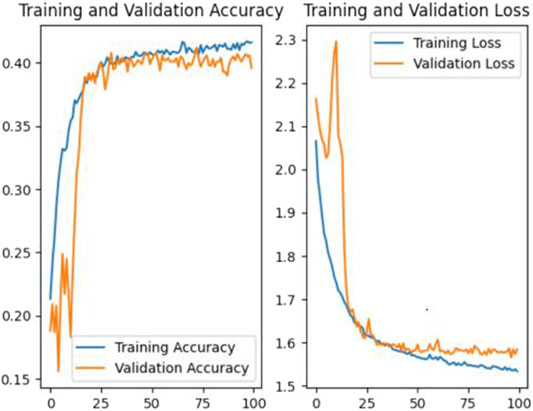
FIGURE 8. Model training process without considering life difference.
According to the results, the prediction accuracy of the transformer life prediction model without considering the phenomenon of life differentiation can only reach 40.37%. Compared with the model proposed in this article, the accuracy was reduced by 52.41%. This is because more characteristic information was extracted from the transformer life distribution data, which improved the identification of the training data and thus improved the final accuracy.
Conclusion
Based on the statistics of the scrapped data of transformers provided by power supply companies, this article analyzes the impact of life differentiation on the reliability evaluation of transformers. According to this phenomenon, the information containing life-differentiation information is extracted from the data and used as the input of the life prediction model based on a convolutional neural network. Compared with other prediction algorithms, the superiority of the convolutional neural network in life prediction is verified. In comparison with the life prediction model without considering the phenomenon of life differentiation, it is verified that the life prediction model considering the phenomenon of life differentiation has higher prediction accuracy.
In the future, the transformer life prediction method based on an AI approach will become the mainstream in the industry. However, it still needs to overcome the dependence on the data sample size. The data source of this article was limited, and more aging factors were not considered, which need to be further improved.
Data Availability Statement
The raw data supporting the conclusions of this article will be made available by the authors, without undue reservation.
Author Contributions
LL—paper writing and submission; LH—data acquisition; ML—model building; ZL—data validation; and XW—proofreading.
Conflict of Interest
Authors LH, ML, and ZL were employed by the State Grid Hubei Electric Power Co., Ltd.
The remaining authors declare that the research was conducted in the absence of any commercial or financial relationships that could be construed as a potential conflict of interest.
Publisher’s Note
All claims expressed in this article are solely those of the authors and do not necessarily represent those of their affiliated organizations, or those of the publisher, the editors, and the reviewers. Any product that may be evaluated in this article, or claim that may be made by its manufacturer, is not guaranteed or endorsed by the publisher.
References
Abu-Elanien, A. E. B., and Salama, M. M. A. (2012). A Monte Carlo Approach for Calculating the Thermal Lifetime of Transformer Insulation. Int. J. Electr. Power and Energy Syst. 43 (1), 481–487. doi:10.1016/j.ijepes.2012.06.054
Bacha, K., Souahlia, S., and Gossa, M. (2012). Power Transformer Fault Diagnosis Based on Dissolved Gas Analysis by Support Vector Machine. Electr. Power Syst. Res. 83 (1), 73–79. doi:10.1016/j.epsr.2011.09.012
Castro, A. R. G., and Miranda, V. (2005). Knowledge Discovery in Neural Networks with Application to Transformer Failure Diagnosis. IEEE Trans. Power Syst. 20 (2), 717–724. doi:10.1109/tpwrs.2005.846074
Chen, C., and Liu, Y. (2020). Remaining Useful Life Analysis of Transformer Based on Hidden Markov Model. J. Shenyang Univ. Technol. 42 (4), 5. doi:10.7688/j.issn.1000-1646.2020.04.10
Dai, M., Tang, H., and Xu, K. (2021). A Prediction Method of Residual Life of Railway Transformer Based on Long-Term and Short-Term Memory Network. Sci. Technol. Innovation (28), 17–19. doi:10.3969/j.issn.1673-1328.2021.28.007
Fox, J. C., Hadidi, R., Laflair, N., Leonard, J., and Hodges, J. (2019). Heat Generation and Failure in Padmount Transformers Due to Zero Sequence Saturation. IEEE Trans. Ind. Appl. 55 (5), 4500–4506. doi:10.1109/tia.2019.2928252
Guo, Y., Wang, Z. K., and Liu, L. (2017). Failure Mechanism Analysis and Preventive Measures of High Voltage Sleeve Head Seal of 500kV Main Transformer. J. Anhui Electr. Eng. \ Tech. Coll 22 (1), 38–41. doi:10.3969/j.issn.1672-9706.2017.01.007
Hu, B., Deng, X., and Jia, S. (2022). Transformer Life Estimation and State Assessment Based on ANFIS. Electr. Meas. Instrum. 59 (01), 61–68. doi:10.19753/j.issn1001-1390.2022.01.008
Husnayain, F., Latif, M., and Garniwa, I. (2016). Transformer Oil Lifetime Prediction Using the Arrhenius Law Based on Physical and Electrical Characteristics. International Conference on Quality in Research. IEEE. Lombok, Indonesia, 10-13 Aug. 2016.
Ignacio, A., Stephen, M. A., Brian, S., Brandon, L., Games, G. C., and Victoriya, M. C. (2018). Adaptive Power Transformer Lifetime Predictions through Machine Learning & Uncertainty Modelling in Nuclear Power Plants. IEEE Trans. Industrial Electron. 66 (6), 4726–4737. doi:10.1109/TIE.2018.2860532
Ishak, T. M . (2010). Simulation Study on Influencing Parameters of Thermal Ageing for Transformer Lifetime Prediction. Cheminform 22 (18), 115–115. doi:10.1002/chin.199118115
Jongen, R., Morshuis, P., Smit, J., and Janssen, A. (2007). A Statistical Approach to Processing Power Transformer Failure Data. Cired 19th International Conference on Electricity DistributionCired 19th International Conference on Electricity Distribution.
Ma, H., Di, Z., Chen, K., Wang, C., Li, K., and Li, Y. (2013). A New Method of Winding Deformation Fault Diagnosis of Power Transformer Based on Vibration . Automation Electr. Power Syst. 37 (08), 89–95. doi:10.7500/AEPS201209202
Qian, Y. H., Xiao, H. Z., Nie, M. H., Zhao, Y.-H., Luo, Y.-B., and Gong, S.-L. (2018). Lifetime Prediction and Aging Behaviors of Nitrile Butadiene Rubber under Operating Environment of Transformer. J. Electr. Eng. Technol. 13 (2), 918–927. doi:10.19487/j.cnki.1001-8425.2017.11.006
Shi, J., Zhao, D., Hao, W., and Wang, X. (2020). Life Evaluation Model for Transformer Insulating Paper Based on Variable Activation Energy. Insul. Mater. 53 (09), 52–57. doi:10.16790/j.cnki.1009-9239.im.2020.09.009
Song, Z., and Cheng, L. (2015). Operation Reliability Analysis of Primary Equipment in UHV DC. Electr. Eng. (06), 110–112+118. doi:10.3969/j.issn.1673-3800.2015.06.025
Song, Z. (2001). Discussion on Failure and Fault Interpretation. China Termin. 3 (3), 20–23. doi:10.3969/j.issn.1673-8578.2001.03.008
Tian, K., You, D. H., Li, Y. L., Pan, K., and Wang, K. (2013). Analysis of a Transformer Time-Varying Outage Model for Operational Risk Assessment. Amr 732-733, 993–998. doi:10.4028/www.scientific.net/amr.732-733.993
Wang, H. (2021). Research on Life Loss of Transformer Based on Machine Learning Algorithms. Electrotech. Appl. 40 (01), 72–78. doi:10.3969/j/issn.1672-9560.2021.01.014
Yan, H., Zhang, Y., Zhao, J., and Yu, Z. (2020). An Oil-Paper Insulation Life Prediction Model Based on Dissolved Products Analysis in Oil. Guangxi Electr. Power 43 (04), 1–6+23. doi:10.16427/j.cnki.issn1671-8380.2020.04.001
Zhang, M., Liu, J., Chen, X., and Liao, L. (2018). Residual Life Assessment Method of Transformer Oil-Paper Insulation Aging Based on Wiener Modle. Trans. China Electrotech. Soc. 33 (21), 11. doi:10.19595/j.cnki.1000-6753.tces.171587
Zheng, Y., Sun, C., and Jian, Li. (2012). Association Rule Analysis on Confidence of Features for Transformer Faults. High. Volt. Eng. 38 (1), 7. doi:10.3969/j/issn.1003-6520.2012.01.012
Zhou, D., Chengrong, L. I., and Wang, Z. (2013). Comparison of Parameter Estimation Methods for Transformer Weibull Lifetime Modelling. High. Volt. Eng. 39 (5), 1170–1177. doi:10.3969/j.issn.1003-6520.2013.05.022
Zhou, D. (2013). Comparison of Two Popular Methods for Transformer Weibull Lifetime Modelling. Int. J. Adv. Res. Electr. Electron. Instrum. Eng. 2 (4).
Keywords: Transformer, life differentiation phenomenon, life prediction, convolutional neural network, aging factors
Citation: He L, Li L, Li M, Li Z and Wang X (2022) A Deep Learning Approach to the Transformer Life Prediction Considering Diverse Aging Factors. Front. Energy Res. 10:930093. doi: 10.3389/fenrg.2022.930093
Received: 27 April 2022; Accepted: 31 May 2022;
Published: 12 July 2022.
Edited by:
Yushuai Li, University of Oslo, NorwayReviewed by:
Yin Yao, Shanghai University of Electric Power, ChinaYuan Chen, Anhui University, China
Hengrui Ma, Qinghai University, China
Tongmao Zhang, The University of Manchester, United Kingdom, in collaboration with reviewer HM
Copyright © 2022 He, Li, Li, Li and Wang. This is an open-access article distributed under the terms of the Creative Commons Attribution License (CC BY). The use, distribution or reproduction in other forums is permitted, provided the original author(s) and the copyright owner(s) are credited and that the original publication in this journal is cited, in accordance with accepted academic practice. No use, distribution or reproduction is permitted which does not comply with these terms.
*Correspondence: Lie Li, bGlsaWVAd2h1LmVkdS5jbg==