 Qiankun Jia1
 Wei Du
- 1School of Energy Science and Engineering, Harbin Institute of Technology, Harbin, China
- 2Aero Engine Academy of China, Beijing, China
A numerical method was used to investigate the reaction degree effects on the aerodynamic performance and flow structure of the single-stage transonic turbine. The SST-γ-θ turbulence model was employed to predict a transition for the boundary layer near the blade surface. This work utilized a public PW-E3 blade profile from NASA. Five different reaction degrees were adopted, corresponding to
1 Introduction
More power and higher efficiency are considered to be the permanent goals for high-performance gas turbine design (Sandberg and Michelassi, 2022). The high turbine inlet temperature and highly loaded means high efficiency and power for the gas turbine (Wei et al., 2022; Luo et al., 2022). By increasing the stage load of a turbine, the number of turbine stages is reduced and the turbine expansion ratio is increased, which can improve the work capacity of the turbine effectively and a higher thrust-to-weight ratio is obtained. However, the turbine exit Mach number is raised inevitably due to the increase of the turbine expansion ratio. Therefore, the turbine components are operated on high load and transonic speed conditions.
The shock waves are generated in the transonic turbine cascade channels with high exit Mach number and high expansion ratio. In particular, due to the high exit Mach number conditions, shock waves are found at the trailing edge, which can cause a shock loss and also interference with the wake (Yao and Carson, 2006). Trailing edge shock waves are thought to be one of the most important reasons for the losses in transonic turbine cascades, and controlling the shock loss in transonic turbines can improve the aerodynamic performance of the turbine effectively. Thus, it is quite necessary to study transonic turbines with high exit Mach number and high expansion ratio, especially single-stage transonic turbines. Recently, many researchers have investigated the flow characteristics and loss mechanisms in transonic turbine cascades (Zhang et al., 2014; Rehman et al., 2019). A high-fidelity large eddy simulation was used to study some of the complex flow phenomena occurring in bladed components by Hou et al. (2010), Lu and Dawes (2015). The moving shock, shock-boundary layer interaction, and shock-wake interaction were accurately described and analyzed for the transonic turbine cascades. Börner and Niehuis (2021) investigated the dynamics of the interaction between the shock waves and the laminar separation flow in a transonic turbine by using high-speed schlieren and surface hot-film sensor. Their results indicated that the low frequencies characteristic of the shock wave motions and the pulsations of the separated bubbles were found by statistical analysis of the schlieren images, and an unsteady shock wave on the suction surface was observed at the upstream of the trailing edge. Zhao et al. (2016) discussed a variety of blade losses for transonic turbines. They concluded that the negative curvature design of the blade suction surface profile was beneficial to reduce the trailing edge losses. Duan et al. (2018) used the RANS (Reynolds-Averaged Navier-Stokes) method to evaluate the loss characteristics of two representative transonic turbine blades. The results showed that the boundary layer losses and trailing edge losses determined the loss level in the subsonic flow region. However, the losses generated by the shock waves seemed to play a decisive role in the supersonic flow region. Furthermore, the losses increased gradually with the rising of the exit Mach number. Teia (2020) proposed a new supersonic loss model for transonic turbines by analyzing data from schlieren images and experimental measurements. Their main results showed that pitch to chord ratio has a powerful influence on the shock system. Therefore, the manner by which shock loss and shock-induced mixing loss were distributed to constitute the overall supersonic losses. Clark et al. (2018) discussed relied on the physics of shock reflections itself to achieve a bowed airfoil and circumferentially asymmetric vane spacing. It also predicted that two methods of forcing reduction could reduce the unsteady pressures on the blade as intended. Liu et al. (2022) studied the transition process of turbulent wakes. They found that the viscous effect got weakened for the supersonic flow with a high Reynolds number, generating the large scale vortex streets.
Pau and Paniagua (2010) found that there were serious aerodynamic losses due to the injection of coolant at the trailing edge in transonic turbines, and reduced the turbine’s performance. Denton (1993) predicted that trailing edge shock losses were probably the largest single loss in transonic turbine Cascades. Gao et al. (2019) showed that there was an optimal flow to ensure that the injection at the trailing edge could increase the static pressure at the tail of the suction side. Therefore, the blade load and trailing edge loss were reduced effectively. Sieverding (1983) used experimental and numerical simulations. It was found that coolant injection through the trailing edge had a positive impact on the base pressure at the trailing edge. The maximum base pressure rise was up to 15% of the downstream dynamic pressure at the transonic exit Mach number. Therefore, the coolant injection at the trailing edge could increase the base pressure and eventually reduce the aerodynamic losses. Moreover, Raffel and Kost (1998) utilized the PIV (Particle Image Velocimetry) technology to quantitatively measure the transient flow field. The results indicated that the shock waves caused the separation of the boundary layer on the suction surface in the supersonic flow field, which not only increased the viscous losses but also increased the secondary flow losses. In particular, it had a negative influence on the cooling performance of the suction surface. Carnevale et al. (2014) investigated the coupling between film cooling and shock system in a transonic flow field. It confirmed that the maximum uncertainty level was observed downstream of the region where the shock waves interacted with the boundary layer. Especially, the shock generated complex flow structures. A number of researchers have discussed and evaluated the blade tip leakage losses in transonic turbines (Zhang et al., 2011; Atkins et al., 2012), and analyzed the aerodynamic thermal characteristics (De Maesschalck et al., 2014; Arisi et al., 2015). In particular, the Very Large Eddy Simulation approach was conducted to predict the Over-Tip Leakage (OTL) flow of the transonic turbine cascades by Wang et al. (2021). It was found that the flow structure of separated vortices and shock waves became more complex in the clearance cavity with the increase of the blade tip clearance. In particular, a change of the reaction degree affected the leakage flow in turbine blades due to the variation in the blade loading (Yoon, 2013). For the optimal design of transonic turbine blade shapes, Joly et al. (2010) introduced a Multi-Objective Optimization which was applied to the redesign of a transonic blade. The objective of the steady-flow optimization was to attenuate the propagation of shock waves downstream of the vane while reducing the losses. Subsequently, a multi-objective optimization method was applied to the three-dimensional design of transonic turbine blade rows by Puente et al. (2015). The decrease of the rotor dynamic pressure was verified by unsteady numerical simulations of multi-stage blades. In addition, Ji et al. (2017) selected three transonic turbine cascades and used the adjoint method to optimize the design of turbine cascades with different back pressures to find the geometric parameters with the best aerodynamic performance. Meanwhile, the adjoint method was also used to analyze the evident shock features in the turbine cascade. Sonoda et al. (2004) introduced a numerical optimization concept for aerodynamic design based on evolutionary algorithms. A stronger trailing edge excitation was split into several weaker trailing edge excitations by optimal design. Thus, the flow losses in the turbine cascade were probably reduced. To attenuate the downstream static pressure transition caused by trailing edge shocks, artificial intelligence combined with an adaptive mesh CFD solver was used to design and optimize the transonic turbine blade shapes (Shelton et al., 1993). The results showed that the shock intensity on the suction surface near the trailing edge was reduced and the outlet flow field was more uniform.
From the previous studies, it was found that a large number of research results focused on discussing the potential losses due to trailing edge shock waves in transonic turbines. Most of the above studies have been devoted to investigating the blade tip leakage and coolant injection in the trailing edge of transonic turbines. Moreover, many researchers have adopted advanced blade optimization design methods to decrease the possible losses by trailing edge shocks. Actually, the reaction degrees are essential in the aerodynamic design of turbomachinery (Noor et al., 2012). However, only a small number of publications focused on investigating the influence of the reaction degree parameters on the aerodynamic performance in transonic turbines. In this paper, the is selected as a research variable. It is significant to explore whether different reaction degrees can impact the flow field characteristics of transonic turbine cascades. Details of the waves structure in the cascades and the flow on the blade surface are considered. In addition, the performance of transonic turbines operating off-design conditions is investigated numerically.
2 Numerical Methodology
2.1 Computational Domain and Blade Modeling
Figure 1A presents the Computational domain. The public PW-E3 blade profile is utilized (Thulin et al., 1982). The parameters at the stator and rotor mid-span are provided. The stator numbers are 24 and the rotor numbers are 54. The inlet foil angles are and in the stator and rotor, respectively. The tip gap is 0.0185 in which is equivalent to 0.8% of the rotor height. In this study, an in-house Blade-Editor code independently completed by Harbin Institute of Technology is further developed for the blade design of the single-stage transonic turbine. The Blade-Editor code based on the 11-parameter method models the blade by three profiles, which is stacked to form a 3D blade shape. To investigate the effect of inversion on the aerodynamic performance of transonic turbines, five different reaction degrees are introduced,
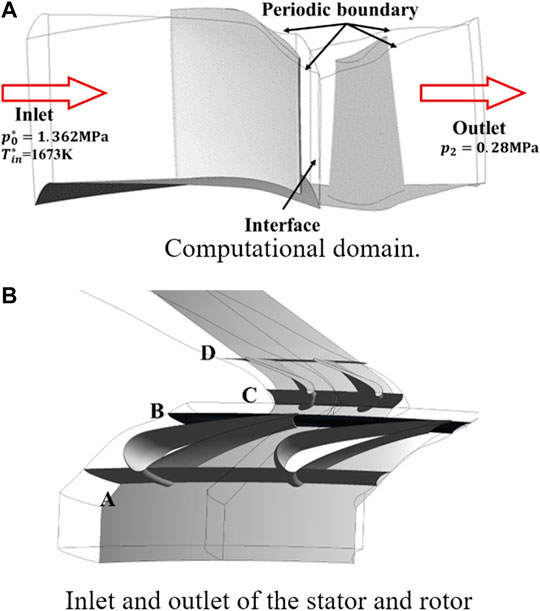
FIGURE 1. Geometry. (A) Computational domain. (B) Inlet and outlet of the stator and rotor.
2.2 Solver and Boundary Conditions
The RANS equations are solved by the commercial CFD software ANSYS CFX, which is selected to calculate the three-dimensional steady flow and heat transfer (Ananthakrishnan and Govardhan, 2018). The SIMPLE algorithm is used to handle the pressure-velocity coupling. To reduce the numerical dissipation, a second-order upwind scheme is used to discretize the computational domain. The SST-γ-θ turbulence model is chosen to analyze the flow behavior in single-stage turbine cascade channels (Kiran and Anish, 2017). During the computational procedure, the residuals for the continuity equation and momentum equations are ensured to be less than 10−5. In this paper, the RANS model is adopted to solve the governing equations:
For the numerical simulation of the turbine devices, the rotor speed should not be ignored. In this present study, the rotor speed is set to 13,232 r/min. Real gas is employed as the working fluid which is closer to the real transonic turbine working environment. In particular, the total temperature and total pressure conditions are determined at the entrance to the computational domain, corresponding to
2.3 Parameter Definition
The reaction degree
Where
The power
Where M is the torque of the rotor blades,
The efficiency of the stage
Where
2.4 Mesh Information and Numerical Validation
An in-house grid generation code is used to create the structured mesh. The quality of the structured mesh is above 0.3, showing the stability and accuracy of the in-house grid code. Figure 2 illustrates the overall view of the structured mesh and details of the mesh near the top and hub of the blade. To ensure that the Y Plus value is less than 1, the first layer grid height near the blade wall is set to 0.005 mm, which meets the calculation requirements of the SST-γ-θ turbulence model. The O-Grid and H-Grid are applied to capture the flow structure for the blade passage, and this modeling method makes the mesh more uniform. A mesh independence verification is introduced in this work. Figure 3 shows the
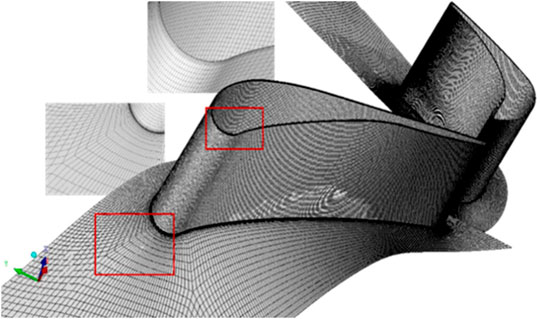
FIGURE 2. Mesh distribution.
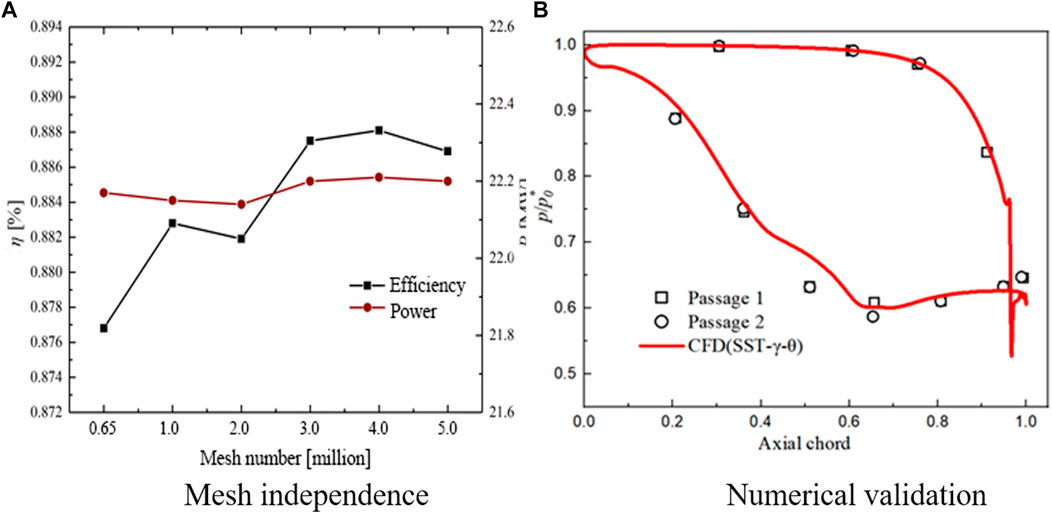
FIGURE 3. Mesh independence verification. (A) Mesh independence; (B) Numerical validation
The blade surface pressure experimental data of PW-E3 stator blade mid-span cascade was used to validate the numerical method in this study. To approximate the experimental conditions, ideal air is adopted. Figure 3B shows the comparison of the experimental results and numerical results. The result with SST-γ-θ turbulence model delivers perfect accuracy for pressure distribution by comparison with the experimental data.
3 Results and Discussion
3.1 Overall Performance
Table 1 presents the overall performance parameters from Case A1 to Case A5, including reaction degrees, expansion ratio, efficiency, mass flow rate. To obtain the approximate expansion ratio π = 4.4, the method of adjusting the outlet back pressure was utilized. Meanwhile, the stator blade shape was slightly adjusted to stabilize the mass flow rate around 29.53 kg/s (relative error less than 5%). Figure 4A presents the distributions of expansion ratio and mass flow rate at different reaction degrees, and the black solid line and the red dashed line indicate the expansion ratio and mass flow rate, respectively. For Case A4, the maximum expansion ratio error is 3.84% at
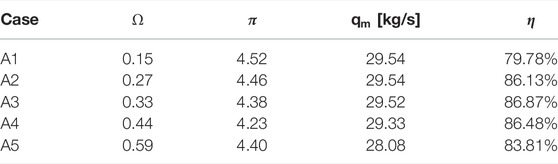
TABLE 1. Overall performance parameters of Case A1–Case A5.
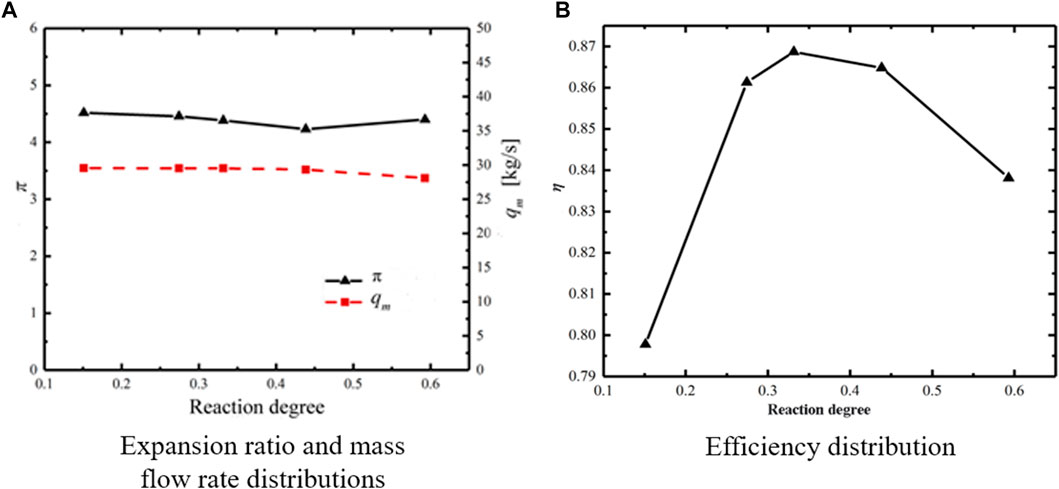
FIGURE 4. Numerical results for different reaction degrees. (A) Expansion ratio and mass flow rate distributions. (B) Efficiency distribution.
Cases A1 and A4 are adapted to analyze the overall flow structure in a transonic turbine. Figure 5 shows the contours of Mach number distribution along with the blade height at 10%, 50%, 90% span sections for Case A1 and Case A4. It suggests that the primary expansion and acceleration regions of the fluid are observed in the stator cascade channels for Case A1. The red zones in the graph indicate that supersonic flow may have occurred. However, it is difficult to recognize the acceleration region in the rotor channels compared to the stator. In addition, a distinct line is noticed in the stator cascade channels, which is an indication of the appearance of the shock structures. Then the Mach number zones are suddenly decreased through the shocks and continue to expand and accelerate, and this transition is noted near the trailing edge of the stator. Therefore, shocks may be the key factor for the complex wave system in the stators. It should be noticed that the local high Mach number areas are displayed near the leading edge of the rotor, as shown in Figure 5A. This phenomenon becomes more obvious at 10% span near the endwall.
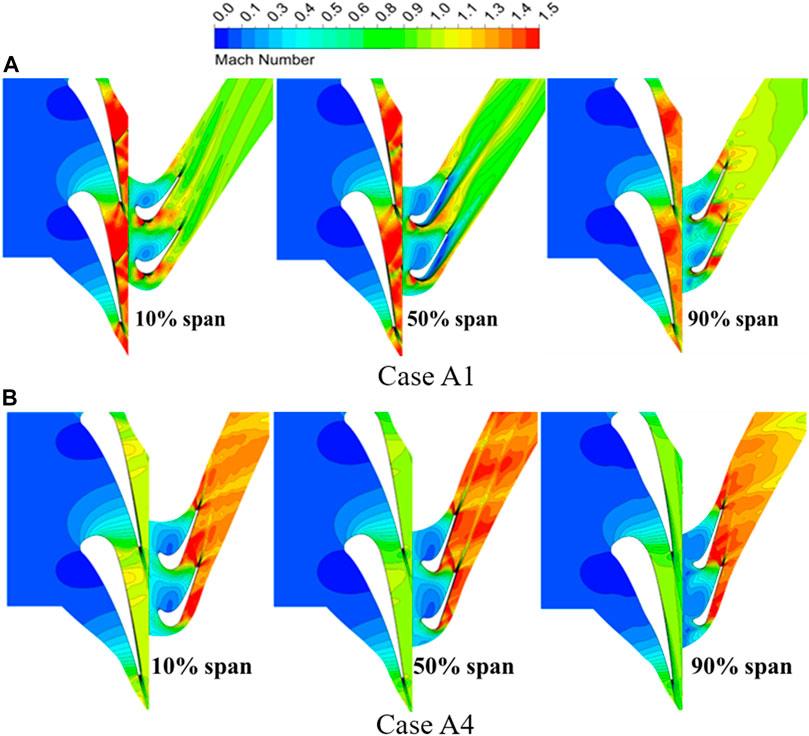
FIGURE 5. Mach number distribution for different blade height sections between Case A1 and A4. (A) Case A1. (B) Case A4.
For Case A4, the flow characteristic is quite different compared to Case A1. According to Figure 5B, the local supersonic regions and shock waves are not observed in the stator cascade channels. It suggests that a high reaction degree blade shape design is likely to provide a more uniform flow in stator channels. Thus, the relatively stabilized flow state can still be achieved for the fluid in the rotors. Besides, for case A4, the expansion and acceleration of the flow are monitored in the rotor channels, but not in the stator. The flow field in the outlet of rotors is characterized by complex wave systems. The Mach number near the trailing edge is significantly reduced after passing through the inner trailing shock. In addition, the outer trailing shocks near the trailing edge also interfere with the wake. Both of the shocks are considered as the decisive factors affecting the efficiency of the turbine stage. Moreover, the flow characteristics of the rotor inlet are also more uniform, and the high Mach number areas near the leading edge of the rotors are gradually decreased. Therefore, the flow field is sensitive to the blade height for Case A1 which represents a low reaction degree design. In general, the wave system structure becomes more complex due to the influence of end wall losses in low reaction degree designs.
3.2 Flow Analysis for Stators
Figure 6 presents the blade surface pressure distribution of the stator cascade channels from Case A1 to Case A5. The results indicate that the stators are after-loaded blade shapes. In addition, the pressure distributions on the suction surface side for all cases with different reaction degrees present significant discrepancies, which are mainly concentrated in the tail of the suction surface in the axial chord range of above 0.6. Figure 6C demonstrates the lower pressure fluctuations at 90% span. It means that the flow field near the blade top is potentially more uniform. However, the flow structures in the middle section and the section near the end wall of the stators are assumed to become more complex through the lines with irregular and violent fluctuations, as shown in Figures 6A,B. In particular, the initial position where pressure fluctuations emerge is progressively backward as the reaction degree decreases by comparing five different cases. Probably because of the low reaction degree designs, the visible pressure fluctuations are found in the tail of the suction surface for Case A1, Case A2, Case A3. Associated with Figure 8, the trailing edge shocks are presumed as one of the primary reasons for the strong pressure fluctuations at the suction surface.
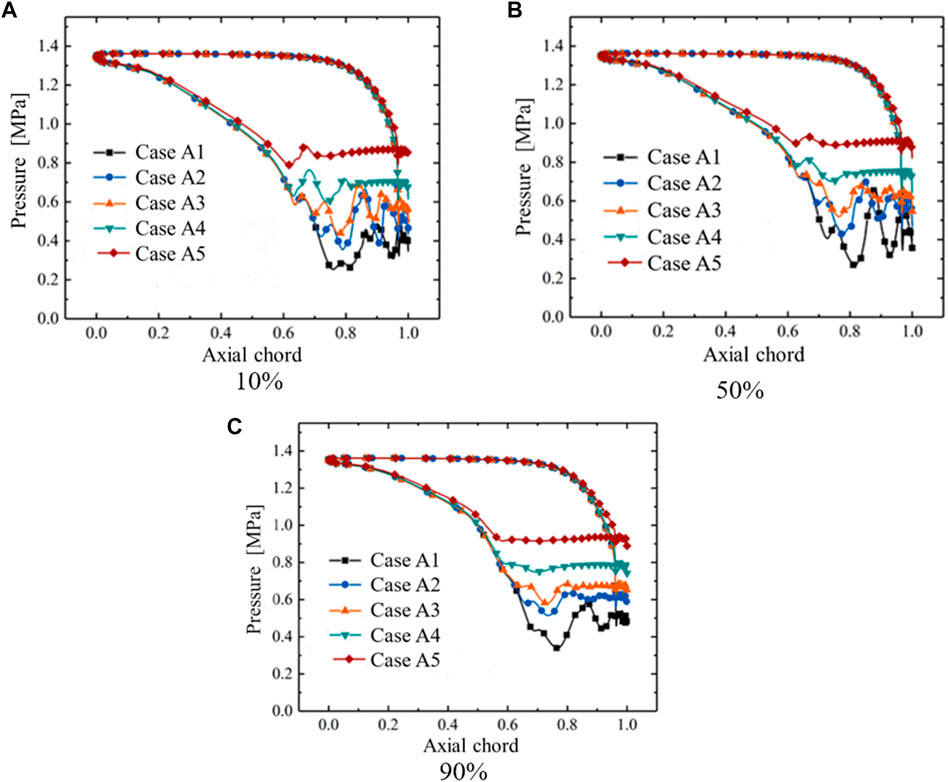
FIGURE 6. Blade surface pressure distribution of stator from Case A1 to Case A5. (A) 10%. (B) 50%. (C) 90%.
To investigate the distinctive details of the wave system and flow structure in the stator channels, the Mach number distribution of stators is analyzed from Case A1 to Case A5, as shown in Figure 7. In addition, the red zones at the end of channels decreased progressively with increasing the blade height, which means a definite diminution of the high Mach number regions. The results of Case A3 indicate the turbulent Mach number distribution in the stator channels and the possible emergence of complex vortex surfaces. Furthermore, this phenomenon is more easily observed for lower reaction degree cases. The strip dividers are mixed in the red accelerated areas especially Case A1 and Case A2, which are assumed to have generated shock waves. Because of the smaller curvature of the front end of the suction, the flow achieves the sonic velocity at first. Then, it continues to expand and accelerate, and the speed is dropped abruptly after crossing the trailing edge shocks. For all cases, the red areas implying supersonic velocities diminish gradually as the reaction degree increases. In particular, the red supersonic areas are invisible and the intermittent expansion and acceleration regions do not exist for Case A4 and Case A5. Meanwhile, the regions with Mach number above 1 are not observed in the stator channels for Case A5, and the shocks structures in Case A5 are not organized in the density gradient distribution in Figure 8. It suggests that the flow field is possible in a subsonic state, and the shock waves are not generated. In addition, it implies that the ability of expansion and acceleration in the stators are gradually diminished as the reaction degree grows. Besides, the mean maximum Mach numbers at the outlet of the stators are calculated from Case A1 to Case A5, corresponding to 1.88, 1.47, 1.32, 1.12 and 0.87. Therefore, the acceleration capacity of the flow is weakened after passing the shock waves, so the maximum Mach number at the stator exit is also significantly reduced with the increase of reactive degrees.
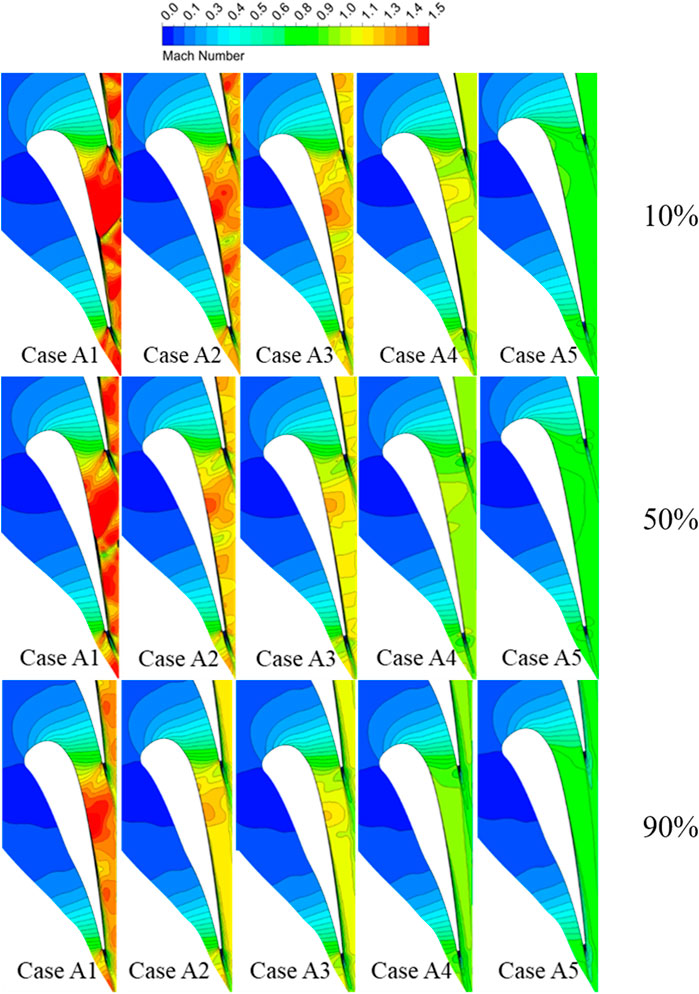
FIGURE 7. Mach number distribution of stators from Case A1 to Case A5.
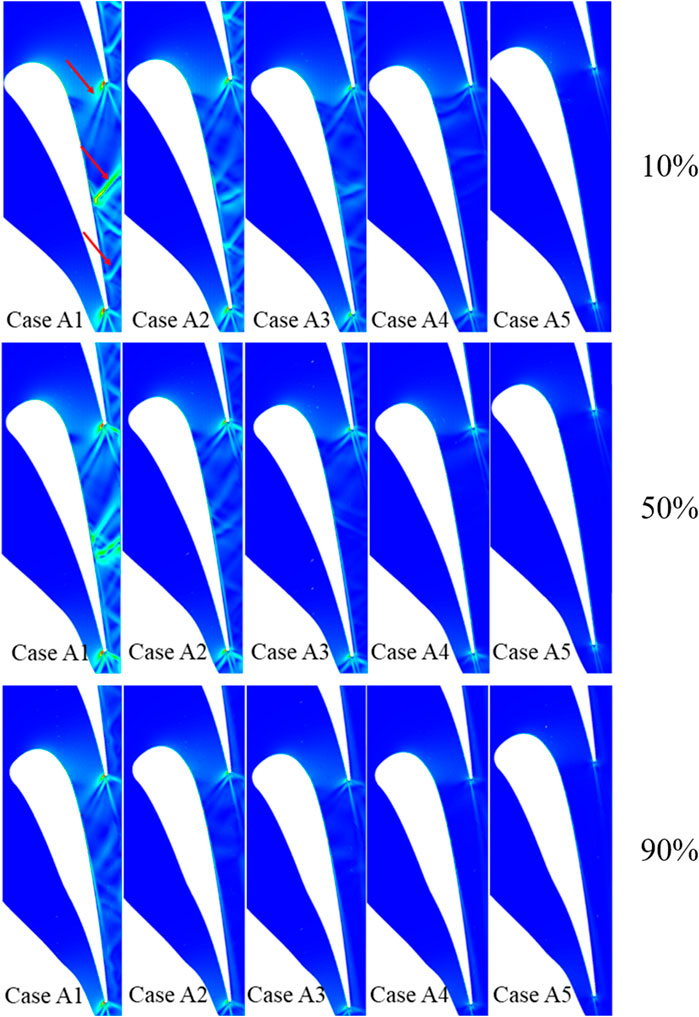
FIGURE 8. Density gradient distribution of stators from Case A1 to Case A5.
Figure 8 shows the density gradient distribution of stators from Case A1 to Case A5. The highlighted structures in the flow channel are the locations of significant density gradient changes. The density gradient is changed probably due to the compression of the flow after passing through the shocks. It is shown that the density gradient is increased rapidly. Then the density gradient is decreased after crossing the trailing edge shock waves. In addition, the stronger shock waves occur at the position indicated by the arrow in Figure 8, and the pressures start to rise at the same locations on the suction surface in Figure 6. For five cases, the angle between the inner trailing shocks and the chord direction is gradually increased. The landing point in the relative blade is closer to the leading edge. In particular, the shocks structures are more sensitive to blade height and reaction degrees. The radial stripes on the trailing edge are more pronounced in the lower reaction degree schemes, e.g., Case A1, Case A2. However, the trailing edge shocks are almost invisible. Thus, it indicates that the shock structures may be stronger in a lower reaction degree case than a higher case.
Figure 9 presents the Exit Static pressure and Mach number distribution of stators. In general, the distribution of static pressure and Mach number shows a quite opposite trend as the reaction degree increases. Figure 9A illustrates that the static pressure distributions also show essentially the same trend with increasing reaction degrees. On the other hand, Mach number distributions in Figure 9B demonstrate a different color change as compared to static pressure. The exit Mach number of the stators is increased with the decrease of the reaction degrees. Thus, the cases with a lower Mach number probably have a higher static pressure in the outlet of the stator. A quite interesting phenomenon is that several vortex structures are observed in the static pressure and Mach number distributions in Case A1 and Case A3. It indicates that the aerodynamic parameters of the stators are more sensitive to a lower reaction degree. A lower reaction degree design may enlarge the scale of the vortex. The static pressure and Mach number at the outlet are influenced due to the combined effect of the continuous vortex characteristics and the shocks at the trailing edge. Subsequently, the flow characteristics impact the flow field of the following rotor. The predicted Mach number distribution of the rotor runner may be consistent with the above assumptions, as shown in Figure 12. The relatively regular laminar distributions of the static pressure and Mach number are revealed for Case A5. However, slender vortex structures are observed in the area close to the suction surface and the pressure surface. For Case A1, the existence of a localized slender vortex is noticed in the high static pressure region and the corresponding low Mach number region. It implies that the trailing edge shocks are present in the above areas.
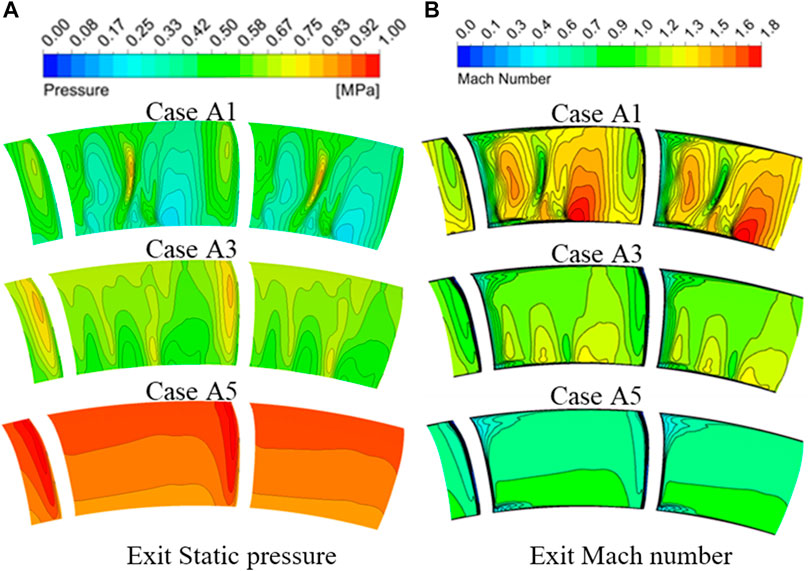
FIGURE 9. Exit Static pressure and Mach number distribution of stators. (A) Exit Static pressure. (B) Exit Mach number.
3.3 Flow Analysis for Rotors
To explain the impact of reaction degrees on the flow field of the rotor cascade channels, the blade surface pressure distributions are analyzed from Case A1 to Case A5. Figure 10 illustrates that The load at the front of the rotor blade is gradually reduced and the load at the tail is increased as the reaction degree grows. Therefore, the rotor is a front-loaded blade shape for Case A1 and the after-loaded blade shapes are assumed for Case A4 and Case A5. A higher reaction degree design demands the greater strength requirements of the blade tail. In particular, the blade surface pressure of the rotor is more sensitive to the reaction degree compared to the stator in Figure 6. The change is found on both the Pressure surface side and the Suction surface side. The blade surface pressure on the pressure surface side is increased progressively with the increase of the reaction degrees. Similarly, the pressures on suction surfaces of the rotor display the same tendency as the pressure surfaces at less than 0.8 axial chord. For all cases, it suggests that the blade surface pressure of the suction surface is raised rapidly. Furthermore, the location of the pressure lifting is essentially consistent with the location of the trailing edge shocks reflected in the suction surface, as shown in Figure 11. Therefore, the trailing edge shocks are presumed to be the key factor for the predicted pressure rise at the suction surface.
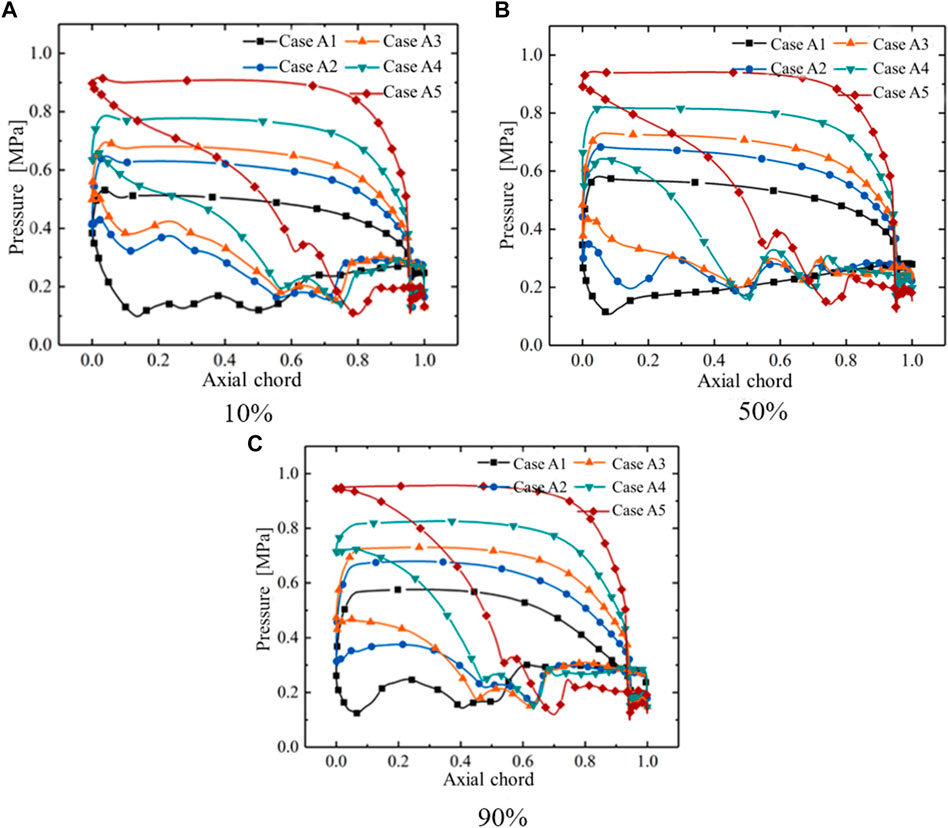
FIGURE 10. Blade surface pressure distribution of rotor from Case A1 to Case A5. (A) 10%. (B) 50%. (C) 90%.
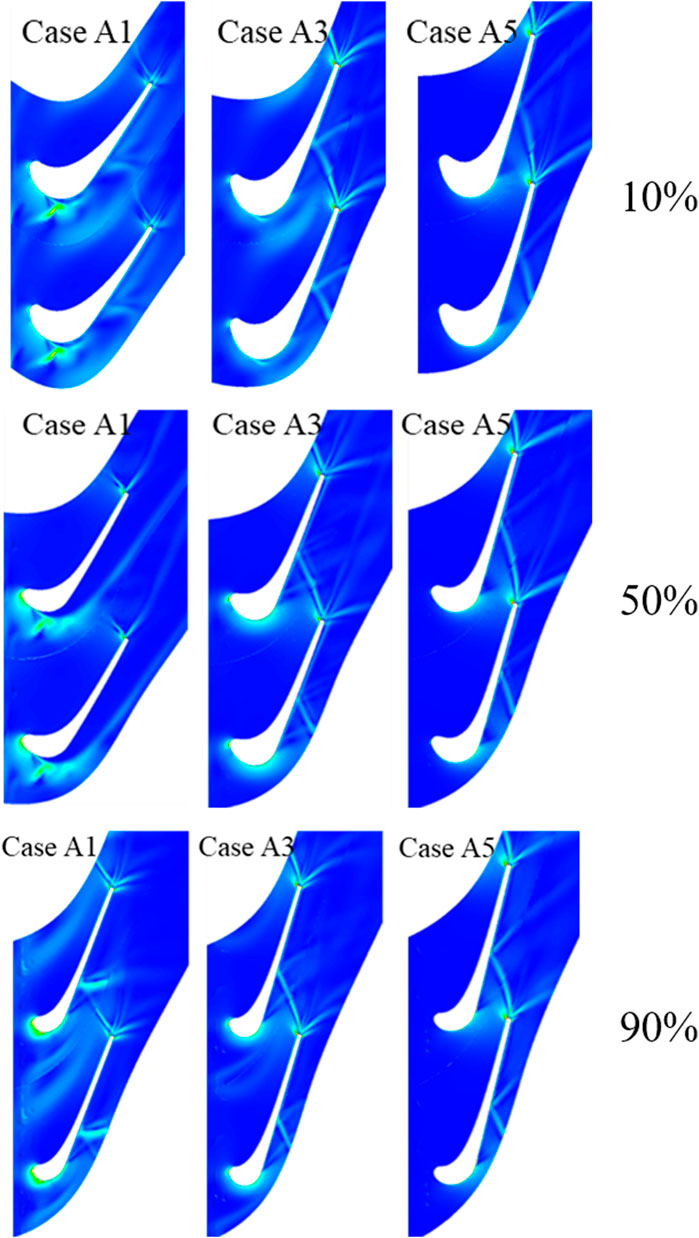
FIGURE 11. Density gradient distribution of rotors for different cases.
Figure 11 illustrates the density gradient distribution in the rotor cascade channels. For Case A1, the significant increase of density gradient distribution occurs at the leading edge of the rotor, which is more visible near the end wall. The structures even weaken the effect of trailing edge shocks. Besides, the trailing edge surge structure is significantly visible for Case A5, which is different from the distribution of shocks in Figure 8. In addition, the inner trailing shocks at the trailing edge are reflected after touching the neighboring blades. The shocks are more inclined with the increase of reaction degrees, and the angle with the blade is smaller. Thus, the reflective position of the suction surface is closer to the trailing edge.
Figure 12 shows the Mach number distribution of rotors for different cases. The red high Mach number regions gradually grow with the increase of the reaction degrees, which is opposite to the Mach number distribution in the stator channels. It indicates that the expansion and acceleration of the fluid are enhanced in the rotor channels. In addition, the existence of the red supersonic regions at the leading edge of the rotor suction surface for Case A1. It speculates that the stator may have a higher exit Mach number with a lower reaction degree, which can be confirmed in Figures 7, 9B. Then, the sonic speed was achieved at the rotor inlet. Besides, the abrupt reductions of the high Mach number distribution are observed at the trailing edge for different cases. It is presumed that the supersonic flow has encountered the trailing edge shocks in this area, and this phenomenon is more visible in Figure 11.
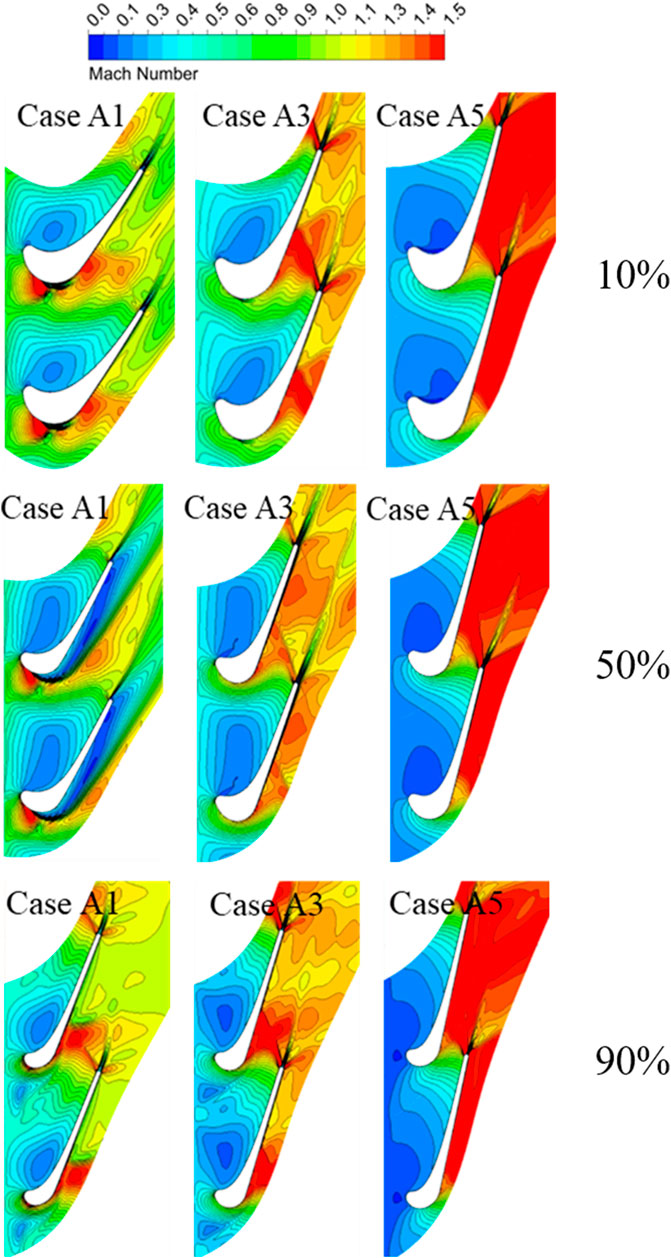
FIGURE 12. Mach number distribution of rotors for different cases.
Figure 13 presents the exit Mach number distribution of rotors for different cases. The exit Mach number of the rotor is significantly increased with increasing reaction degrees. For Case A1, there is a distinct cloud of low-energy fluid near the suction surface of the middle channel. It seems that the expansion and acceleration in the rotor channels are weakened due to the lower reaction degrees. The action of the lateral secondary flow is emphasized by coiling up the low-energy fluid of the boundary layer, which accumulates at the suction surface. In addition, with the increase of the reaction degrees, it can be found that the sequence is high Mach number-low Mach number-high Mach number-low Mach number from the pressure surface to the suction surface, approximately. It is assumed that losses are generated after passing through the shock waves. The flow decelerates and the pressure rises, resulting in the appearance of a low Mach number region on the left side. The flow continues to expand and accelerate. However, there is another loss after encountering the reflected wave of the shocks. The second low Mach number region is not obvious due to the intensity of the reflected waves being less than the shocks.
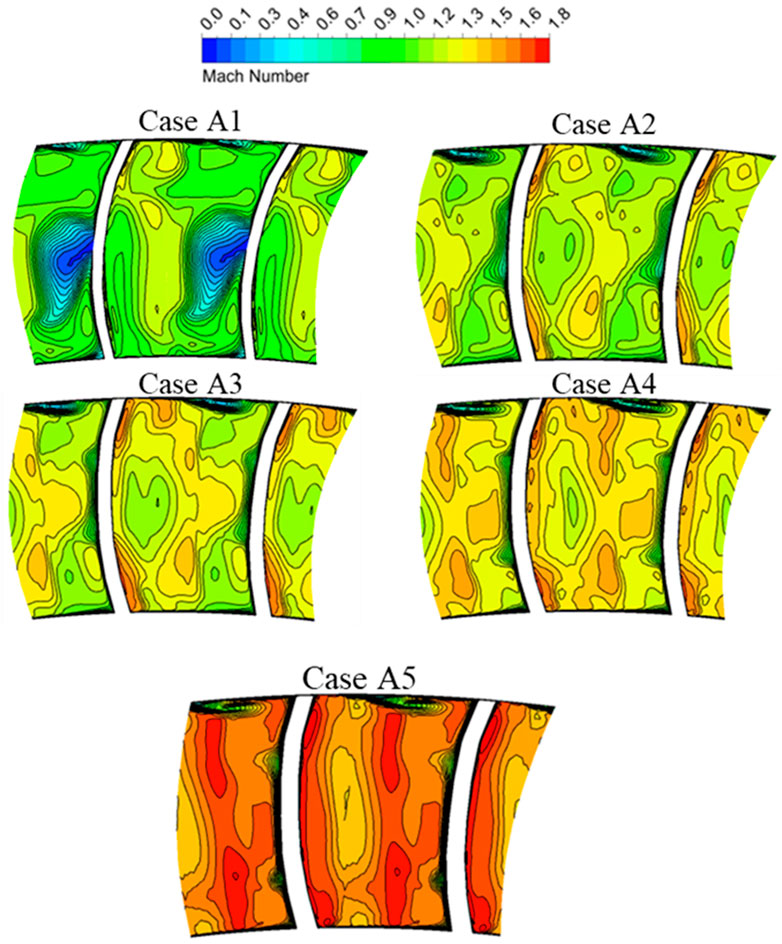
FIGURE 13. Exit Mach number distribution of rotors.
3.4 Off-Design Conditions Analysis
To study the operating performance of transonic turbines with high expansion ratios at off-design conditions, Figure 14 illustrates the efficiency and flow distribution for different pressure ratios and speed range from Case A1 to Case A5. It shows that the speed, pressure ratio, and reaction degree have a significant influence on the performance of the transonic turbine. For all cases, a similar trend is observed in the efficiency characteristic lines. As the pressure ratio increases,
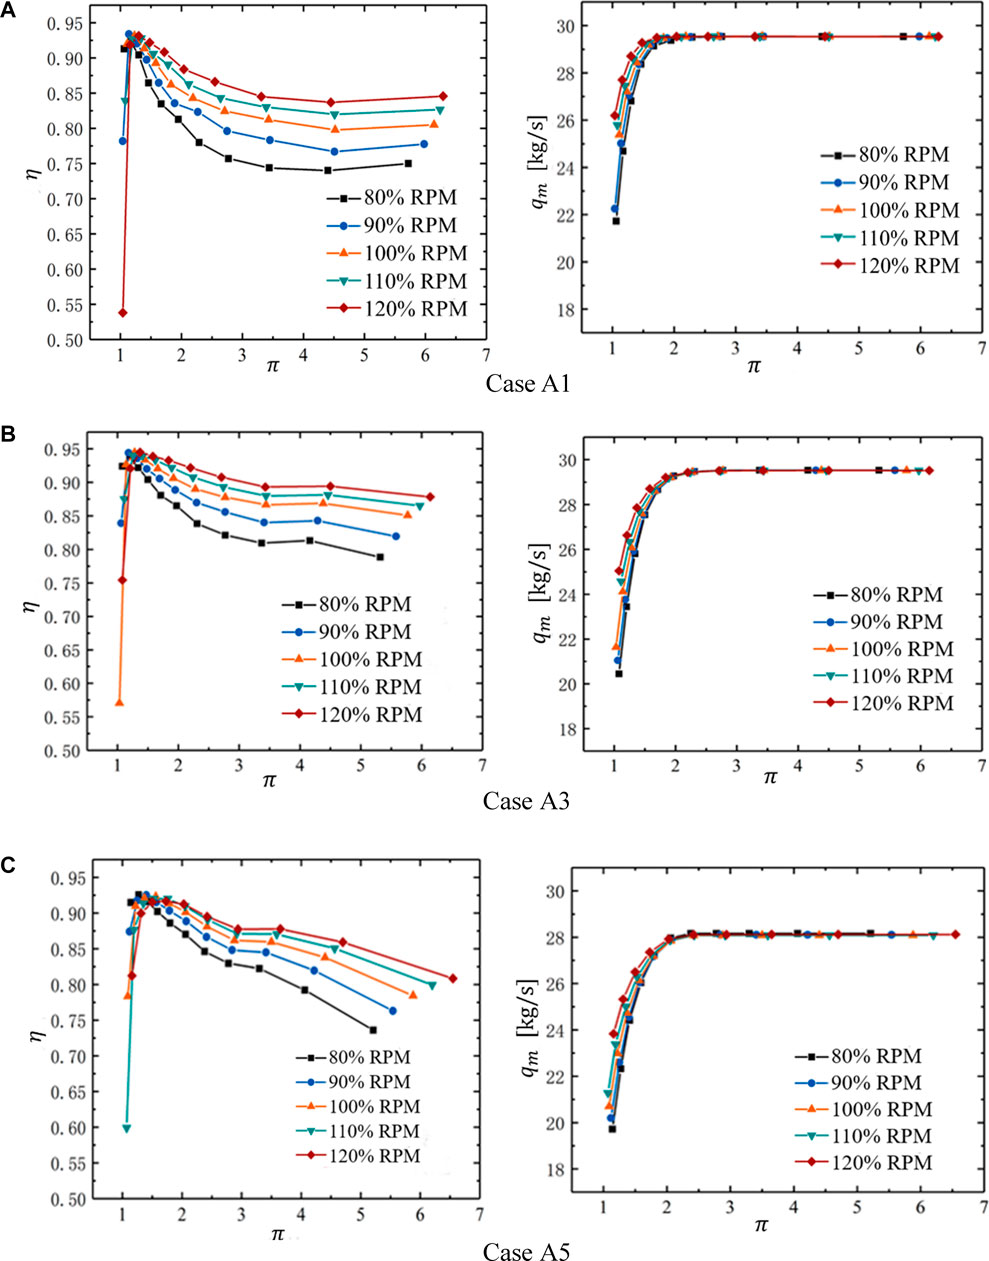
FIGURE 14. Efficiency and Mass flow rate characteristic line of different reaction degrees. (A) Case A1. (B) Case A3. (C) Case A5.
4 Conclusion
Five cases of reaction degrees were used to analyze the aerodynamic performance and cascade flow structure of a single-stage transonic turbine. In addition, off-design conditions were calculated for different cases. The main conclusions were summarized as follows:
1) The efficiency of transonic turbines was more sensitive to the reaction degrees. The turbine efficiency distribution was showed a trend of increasing and then decreasing with the increase of the reaction degrees at the designed operating conditions. Thus, the maximum efficiency was obtained at
2) The expansion and acceleration of the fluid were observed in the rotor cascade channels at relatively higher reaction degrees. However, this phenomenon was found at a lower reaction degree in the stators. In addition, the shock waves were monitored at the supersonic regions. The shock waves were assumed to be the key factor in the generation of complex flow structures.
3) The stators were all after-loaded blade shapes. But the rotors were turned from front-loaded to after-loaded due to the increase of reaction degrees. In particular, the inner trailing shocks crossed the cascade channel and formed reflected shocks in the adjacent blades. The angles between the inner trailing shocks and the chord length direction in stators were increased, and the reflection point of the shocks was progressively closer to the leading edge as the reaction degrees increased. However, the angles of the rotors were reduced and the reflection point was gradually moved closer to the trailing edge.
4) For off-design conditions analysis, the efficiency distribution had presented a trend of increasing and then decreasing with the rise of the pressure ratio. In particular, the highest efficiency distribution was marked around
Data Availability Statement
The original contributions presented in the study are included in the article/Supplementary Material, further inquiries can be directed to the corresponding author.
Author Contributions
QJ is responsible for the main calculation, analysis, and Writing. SX is responsible for Calculation, PS is responsible for analysis, WD is responsible for Ideal and the overall guidance.
Conflict of Interest
The authors declare that the research was conducted in the absence of any commercial or financial relationships that could be construed as a potential conflict of interest.
Publisher’s Note
All claims expressed in this article are solely those of the authors and do not necessarily represent those of their affiliated organizations, or those of the publisher, the editors and the reviewers. Any product that may be evaluated in this article, or claim that may be made by its manufacturer, is not guaranteed or endorsed by the publisher.
Acknowledgments
The authors acknowledge the financial support provided by Natural Science Fund for Excellent Young Scholars of Heilongjiang Province (No. YQ2021E023), Natural Science Foundation of China (Nos. 52106041 and 52076053), China Postdoctoral Science Foundation funded project (2021M690823), National Science and Technology Major Project (Nos. 2017-III-0009-0035 and 2019-II-0010-0030).
References
Ananthakrishnan, K., and Govardhan, M. (2018). Influence of Fillet Shapes on Secondary Flow Field in a Transonic Axial Flow Turbine Stage. Aerosp. Sci. Technol. 82-83, 425–437. doi:10.1016/j.ast.2018.08.040
Arisi, A., Xue, S., Ng, W. F., Moon, H. K., and Zhang, L. (2015). Numerical Investigation of Aerothermal Characteristics of the Blade Tip and Near-Tip Regions of a Transonic Turbine Blade. J. Turbomach. 137 (9), 091002. doi:10.1115/1.4029713
Atkins, N. R., Thorpe, S. J., and Ainsworth, R. W. (2012). Unsteady Effects on Transonic Turbine Blade-Tip Heat Transfer. J. Turbomach. 134 (6), 061002. doi:10.1115/1.4004845
Börner, M., and Niehuis, R. (2021). Dynamics of Shock Waves Interacting with Laminar Separated Transonic Turbine Flow Investigated by High-Speed Schlieren and Surface Hot-Film Sensors. J. Turbomach. 143 (5), 051010. doi:10.1115/1.4050330
Carnevale, M., D’Ammaro, A., Montomoli, F., and Salvadori, S. (2014). “Film Cooling and Shock Interaction: An Uncertainty Quantification Analysis with Transonic Flows,” in ASME Turbo Expo 2014: Turbine Technical Conference and Exposition, Düsseldorf, Germany, June 16–20, 2014 (American Society of Mechanical Engineers ASME). V05BT13A001. doi:10.1115/gt2014-25024
Clark, J. P., Anthony, R. J., Ooten, M. K., Finnegan, J. M., Dean Johnson, P., and Ni, R.-H. (2018). Effects of Downstream Vane Bowing and Asymmetry on Unsteadiness in a Transonic Turbine. J. Turbomach. 140 (10), 101006. doi:10.1115/1.4040998
De Maesschalck, C., Lavagnoli, S., and Paniagua, G. (2014). Blade Tip Carving Effects on the Aerothermal Performance of a Transonic Turbine. J. Turbomach. 137 (2), 021005. doi:10.1115/1.4028326
Denton, J. D. (1993). “Loss Mechanisms in Turbomachines,” in ASME 1993 International Gas Turbine and Aeroengine Congress and Exposition, Cincinnati, Ohio, USA, May 24–27, 1993 (American Society of Mechanical Engineers ASME). V002T14A001. doi:10.1115/93-GT-435
Dixon, S. L., and Hall, C. (2013). Fluid Mechanics and Thermodynamics of Turbomachinery. Oxford: Pergamon Press.
Duan, P., Tan, C. S., Scribner, A., and Malandra, A. (2018). Loss Generation in Transonic Turbine Blading. J. Turbomach. 140 (4), 041006. doi:10.1115/1.4038689
Du, W., Luo, L., Jiao, Y., Wang, S., Li, X., and Sunden, B. (2021). Heat transfer in the Trailing Region of Gas Turbines ‐ A State-of-the-Art Review. Applied Thermal Eng. 199, 117614. doi:10.1016/j.applthermaleng.2021.117614
Gao, J., Wei, M., Fu, W., Zheng, Q., and Yue, G. (2019). Experimental and Numerical Investigations of Trailing Edge Injection in a Transonic Turbine Cascade. Aerosp. Sci. Technol. 92, 258–268. doi:10.1016/j.ast.2019.05.069
Gardner, W. (1979). Energy Efficient Engine: High Pressure Turbine Uncooled Rig Technology Report. USA: NASA-Lewis Research Center.
Hou, W. T., Qiao, W. Y., and Luo, H. L. (2010). Shock-Wave/Boundary-Layer Interaction in a Transonic Turbine Cascade. Proc. Inst. Mech. Eng. Part G J. Aerosp. Eng. 225 (1), 77–85. doi:10.1243/09544100JAERO745
Ji, L., Yu, J., Li, W., and Yi, W. (2017). Study on Aerodynamic Optimal Super/transonic Turbine Cascade and its Geometry Characteristics. Proc. Inst. Mech. Eng. Part G J. Aerosp. Eng. 231 (3), 435–443. doi:10.1177/0954410016638875
Joly, M., Verstraete, T., and Paniagua, G. (2010). “Attenuation of Vane Distortion in a Transonic Turbine Using Optimization Strategies: Part I-Methodology,” in ASME Turbo Expo 2010: Power for Land, Sea, and Air, Glasgow, UK, June 14–18, 2010 (American Society of Mechanical Engineers ASME), 653–662. doi:10.1115/GT2010-22370
Kiran, K. N., and Anish, S. (2017). An Investigation on the Effect of Pitchwise Endwall Design in a Turbine Cascade at Different Incidence Angles. Aerosp. Sci. Technol. 71, 382–391. doi:10.1016/j.ast.2017.09.032
Kopper, F., Milano, R., Davis, R., Dring, R., and Stoeffler, R. (1981). Energy Efficient Engine High-Pressure Turbine Supersonic Cascade Technology Report. USA: Lewis Research Center.
Liu, C., Zhang, J., Jia, D., and Li, P. (2022). Experimental and Numerical Investigation of The Transition Progress of Strut-Induced Wakes in the Supersonic Flows. Aero. Sci. Technolo. 120, 107256. doi:10.1016/j.ast.2021.107256
Lu, Y., and Dawes, W. N. (2015). “High Order Large Eddy Simulations for a Transonic Turbine Blade Using Hybrid Unstructured Meshes,” in ASME Turbo Expo 2015: Turbine Technical Conference and Exposition, Montreal, Quebec, Canada, June 15–19, 2015 (American Society of Mechanical Engineers ASME). V02CT44A005. doi:10.1115/GT2015-42283
Luo, L., Yan, H., Du, W., Su, W., Wang, S., and Huang, D. (2022). Numerical Study of A Novel Curved Pin Fin For Heat Transfer Enhancement Within Aeroengine Turbine Blade. Aerospace Sci. Technol. 123, 107436. doi:10.1016/j.ast.2022.107436
Noor, H., Genrup, M., and Fransson, T. (2012). “Selection of One-Dimensional Design Parameter 'Reaction Degree' for 1st Stage of a Cooled Gas Turbine,” in ASME Turbo Expo 2012: Turbine Technical Conference and Exposition, Copenhagen, Denmark, June 11–15, 2012 (American Society of Mechanical Engineers ASME), 2345–2354. doi:10.1115/GT2012-69758
Pau, M., and Paniagua, G. (2010). Investigation of the Flow Field on a Transonic Turbine Nozzle Guide Vane with Rim Seal Cavity Flow Ejection. J. Fluids Eng. 132 (11), 111101. doi:10.1115/1.4002887
Puente, R., Paniagua, G., and Verstraete, T. (2015). Design Trade-Off Study between Efficiency and Rotor Forcing Attenuation in a Transonic Turbine Stage. Appl. Math. Model. 39 (2), 838–850. doi:10.1016/j.apm.2014.07.003
Raffel, M., and Kost, F. (1998). Investigation of Aerodynamic Effects of Coolant Ejection at the Trailing Edge of a Turbine Blade Model by PIV and Pressure Measurements. Exp. Fluids 24 (5), 447–461. doi:10.1007/s003480050194
Rehman, A., Liu, B., and Asghar, M. A. (2019). Secondary Flow and Endwall Optimization of a Transonic Turbine. Energies 12 (21), 4103. doi:10.3390/en12214103
Sandberg, R. D., and Michelassi, V. (2022). Fluid Dynamics of Axial Turbomachinery: Blade- and Stage-Level Simulations and Models. Annu. Rev. Fluid Mech. 54 (1), 255–285. doi:10.1146/annurev-fluid-031221-105530
Shelton, M. L., Gregory, B. A., Lamson, S. H., Moses, H. L., Doughty, R. L., and Kiss, T. (1993). “Optimization of a Transonic Turbine Airfoil Using Artificial Intelligence, CFD and Cascade Testing,” in ASME 1993 International Gas Turbine and Aeroengine Congress and Exposition, Cincinnati, Ohio, USA, May 24–27, 1993 (American Society of Mechanical Engineers ASME). V03AT15A012. doi:10.1115/93-GT-161
Sieverding, C. H. (1983). The Influence of Trailing Edge Ejection on the Base Pressure in Transonic Turbine Cascades. J. Eng. Power 105 (2), 215–222. doi:10.1115/1.3227405
Sonoda, T., Arima, T., Olhofer, M., Sendhoff, B., Kost, F., and Giess, P.-A. (2004). A Study of Advanced High-Loaded Transonic Turbine Airfoils. J. Turbomach. 128 (4), 650–657. doi:10.1115/1.2221325
Teia, L. (2020). New Supersonic Loss Model for the Preliminary Design of Transonic Turbine Blades and the Influence of Pitch. J. Turbomach. 142 (4), 041008. doi:10.1115/1.4045983
Thulin, R. D., Howe, D. C., and Singer, I. D. (1982). Energy Efficient Engine High-Pressure Turbine Detailed Design Report. Cleveland OH, USA: Lewis Research Center.
Wang, T., Xuan, Y., and Han, X. (2021). The Effects of Tip Gap Variation on Transonic Turbine Blade Tip Leakage Flow Based on VLES Approach. Aerosp. Sci. Technol. 111, 106542. doi:10.1016/j.ast.2021.106542
Wei, D., Lei, L., Yinghou, J., Songtao, W., Xingchen, L., and Cong, C. (2022). The Interaction Between The Latticework Duct And Film Cooling On The Thermal Performance With Different Film Cooling Hole Locations. Inter. J. Thermal Sci. 179, 107627. doi:10.1016/j.ijthermalsci.2022.107627
Yao, J., and Carson, S. (2006). “HPT/LPT Interaction and Flow Management in the Inter-turbine Space of a Modern Axial Flow Turbine,” in ASME Turbo Expo 2006: Power for Land, Sea, and Air, Barcelona, Spain, May 8–11, 2006 (American Society of Mechanical Engineers ASME), 1783–1795. doi:10.1115/GT2006-90636
Yoon, S. (2013). The Effect of the Degree of Reaction on the Leakage Loss in Steam Turbines. J. Eng. Gas Turbines Power 135 (2). doi:10.1115/1.4007772
Zhang, Q., He, L., and Rawlinson, A. (2014). Effects of Inlet Turbulence and End-Wall Boundary Layer on Aerothermal Performance of a Transonic Turbine Blade Tip. J. Eng. Gas Turbines Power 136 (5), 052603. doi:10.1115/1.4026002
Zhang, Q., O’Dowd, D. O., He, L., Wheeler, A. P. S., Ligrani, P. M., and Cheong, B. C. Y. (2011). Overtip Shock Wave Structure and its Impact on Turbine Blade Tip Heat Transfer. J. Turbomach. 133 (4), 041001. doi:10.1115/1.4002949
Zhao, W., Luo, W., Zhao, Q., and Xu, J. (2016). “Investigation on the Reduction of Trailing Edge Shock Losses for a Highly Loaded Transonic Turbine,” in ASME Turbo Expo 2016: Turbomachinery Technical Conference and Exposition, Seoul, South Korea, June 13–17, 2016 (American Society of Mechanical Engineers ASME). V02BT38A005. doi:10.1115/GT2016-56131
Nomenclature
Abbreviations
cp Heat capacity [kJ/(kg·K)]
M Torque [N·m]
p Pressure[MPa]
p2 Outlet static pressure of Computational domain [MPa]
pr,out Outlet total pressure of rotor [MPa]
ps,in Inlet total pressure of stator [MPa]
ps,out Outlet total pressure of stator [MPa]
P Power [MW]
qm Mass flow rate [kg/s]
Greek symbols
Ω Reaction degree
π Pressure ratio
η Efficiency [%]
ω Angular velocity [s−1]
κ Isentropic exponent
Abbreviations
CFD Computational fluid dynamics
SST Shear Stress Transport model
Keywords: transonic turbine, reaction degrees, shock waves, off-design conditions, aerodynamic performance
Citation: Jia Q, Xu S, Sun P and Du W (2022) Aerodynamic Performance of the Single-Stage Transonic Turbine With Different Reaction Degrees. Front. Energy Res. 10:928358. doi: 10.3389/fenrg.2022.928358
Received: 25 April 2022; Accepted: 12 May 2022;
Published: 15 June 2022.
Edited by:
Xiao Liu, Harbin Engineering University, ChinaReviewed by:
Jian Liu, Central South University, ChinaShaopeng Lu, Shanghai Jiao Tong University, China
Hongxin Zhang, Nanjing University of Aeronautics and Astronautics, China
Copyright © 2022 Jia, Xu, Sun and Du. This is an open-access article distributed under the terms of the Creative Commons Attribution License (CC BY). The use, distribution or reproduction in other forums is permitted, provided the original author(s) and the copyright owner(s) are credited and that the original publication in this journal is cited, in accordance with accepted academic practice. No use, distribution or reproduction is permitted which does not comply with these terms.
*Correspondence: Wei Du, aGl0ZHc5MjExQG91dGxvb2suY29t