 Jian Ding
 Haonan Cao
- EHV Branch Company of State Grid Zhejiang Electric Power Co., Ltd, Hangzhou, China
Insulator string is a special insulation component which plays an important role in overhead transmission lines. However, working outdoors for a long time, insulators often have defects because of various environmental and weather conditions, which affect the normal operation of transmission lines and even cause huge economic losses. Therefore, insulator defect recognition is a crucial issue. Traditional insulator defect identification relies on manual work, which is time-consuming and inefficient. Therefore, the use of artificial intelligence to detect the defect location and recognize its class has become a key research field. By improving the classical YOLOv5 (you only look once) model, this article proposes a new method to enable high accuracy and real-time detection. Our method has three advantages: 1) Efficient-IoU (EIoU) replaces intersection over union (IoU) to calculate the loss of box regression, which overcomes that the detection is sensitive to various scale insulators in aerial images. 2) Since YOLOv5 itself detects some natural scenes in the real world, some anchors setting by default are not suitable for defect detection, this article introduces Assumption-free K-MC2 (AFK-MC2) algorithm into YOLOv5 to modify the K-means algorithm to improve accuracy and speed. 3) The cluster non-maximum suppression (Cluster-NMS) algorithm is introduced to avoid missing detection of insulators because of mutual occlusion in images and improve the computation speed at the same time. The experiments’ results show that this model can improve detection accuracy compared with YOLOv5 and realize real-time detection.
1 Introduction
Electricity is one of the most important energy sources in the 21st century, which is used, popularized, and closely related to people’s life and equipment operations. A single fault will bring huge losses to the economy and personal safety (Wang, 2022). Therefore, it is necessary to ensure the normal operation of the power grid system. As an important part of the power grid, transmission lines realize long-distance power transmission (Wu, Bozzi et al., 2021), which is closely related to the transmission of information and communication, the operation of industrial minerals, and people‘s production and life.
Insulators are essential components due to the high voltage level of transmission cables, which are used to support and separate electrical conductors without allowing current through themselves (Yousaf, Iqbal et al., 2022). However, insulators are usually exposed to various environmental and weather conditions, such as thunderstorms, hurricanes, typhoons, frost-covering, and rain. These harsh environmental and weather conditions make insulators lose their insulation capacity and cause power grid failures (Tao, Zhang et al., 2018; Zhai, Chen et al., 2018). To ensure the electric system’s operation, an efficient and effective insulator defect detection method is necessary.
In the past few years, defect detection methods have been divided into three categories (Wen, Luo et al., 2021), including physical methods, traditional vision-based methods, and deep learning– based methods.
Physical methods often rely on manual work. Common methods include direct observation, insulator resistance measurement method (Huang, 2017), distributed voltage measurement method (Li, Zhang et al., 2019), and ac voltage withstand method (Sima, Yuan et al., 2010). These methods have great requirements for weather conditions and are time-consuming. In recent years, researchers have introduced the ultrasonic wave method (Yao, Yu et al., 2019) and the ultraviolet pulse method (Gao, Lyu et al., 2019). Yao, Yu et al. (2019) proposed an ultrasonic wave method for detection by receiving and processing ultrasonic signals between 20–40 kHz and 80–140 kHz because ultrasound at these frequencies is emitted from the insulator failure location. Gao, Lyu et al. (2019) introduced the phase relationship between pulse waveform of an ultraviolet photoelectric sensor and pulse current waveform of partial discharge, the relationship between ultraviolet pulse frequency and apparent discharge quantity, and the attenuation characteristics of ultraviolet pulse frequency with the distance from the sensor to detection target, thus, the partial discharge of electrical equipment can be accurately detected. These two approaches are more accurate but expensive.
Traditional vision-based methods are related to image processing. According to the color and shape information of the target, the candidate regions are extracted from the image for detection and recognition. Ada Boost detection algorithm uses Harr feature to combine weak classifiers to get strong classifiers, which achieve quick detection of insulator defect (Zhai, 2014). Similar methods include the HOG (histogram of oriented gradient)+SVM (support vector machine) algorithm (Dadi and Pillutla,2016), the improved MPEG-7 EHD (edge histogram method) technique (Li, 2010), and the global minimization active contour model (Wu, An et al., 2012). These methods usually use shallow learning models to recognize, such as linear classifier, boosting, and SVM. Therefore, feature extraction becomes the key to improving the recognition rate. Traditional methods are based on experience to design features, such as widely used Harr, HOG, and sift features, and their advantage is speed. However, due to the subjectivity and locality of human experience, the detection and recognition accuracy is generally not high.
Considering that physical methods are time confusing and traditional vision-based methods have low accuracy, an accurate and fast detection method is needed. Benefit from the multi-layered structure, deep neural networks use fewer parameters to represent complex functions (Montavon, Samek et al., 2018), especially with the successful application of convolution neural networks (CNN) in image recognition (Chauhan, Ghanshala et al., 2018), the automatic detection and recognition of targets by deep learning method has become the focus and hotspot of research that can meet the needs. Deep neural network object detection algorithms use a large amount of data to extract features by models automatically, which avoids the subjectivity of traditional visual-based methods. The object detection algorithms based on deep learning can be divided into two categories: two-stage and one-stage. The representatives of two-stage methods are SPP (He, Zhang et al., 2015), faster R-CNN (Ren, 2015), and R-FCN (Dai, Li et al., 2016). These methods first generate region proposals and then make bounding box regression and object detection. One-stage methods usually achieve great detection accuracy but consume much time because they need to generate a lot of region proposals. One-stage methods include YOLO (Redmon et al., 2016) and SSD (Liu, Anguelov et al., 2016). As the most famous one-stage detection method, YOLO does not need to generate region proposals, completing the selection of the region and classification simultaneously. Therefore, it can achieve real-time detection but slightly lower accuracy than two-stage methods.
With the aim to achieve the effect of real-time detection of insulator defects with high accuracy, in this study, we chose YOLOv5 as the backbone model. We propose a series of advanced techniques to improve the performance, including EIoU, AFK-MC2, and Cluster-NMS.
The main contributions of this article are as follows:
1) This article first introduces a new loss function EIoU to solve the problem that the model can be hard to train when the images have high resolution. The experiments’ results show that EIoU loss function improves detection accuracy.
2) Randomized anchor generation severely limits the performance of insulator detection. We propose a more reasonable anchor generation method, namely AFK-MC2.
3) Traditional deep learning models can not realize real-time detection due to their complex anchor selection mechanisms. This work introduces Cluster-NMS methods to simplify the mechanisms while ensuring accuracy.
4) Existing methods often require a trade-off between accuracy and speed, but these two factors are both important in practical application. This study proposes a high-accuracy real-time insulator defect detection method that meets this need.
The remaining parts of this article are organized as follows: Section 2 discusses related work of insulator detection and the CPLID (Chinese Power Line Insulator Dataset) dataset. Section 3 explains how our model works. In Section 4, a series of comparative experiments are used to verify the validity of the model in this study. Section 5 concludes the article.
2 Related Work
In this section, we first make a review of the former work of insulator defection. Then, we introduce the CPLID dataset that was used in our experiments. Finally, we have an overview of the development of YOLO.
2.1 Insulator Detection
The fast development of deep learning and object detection models gives researchers a new way to detect defects in insulators. However, both two-stage methods and one-stage models are designed for the detection of things in daily life, so researchers need to come up with ideas to modify these models in order to detect insulators defect. To overcome the shortcomings of traditional vision-based methods, Tao, Zhang et al. (2018) used cascading architecture to transform defects detection into a two-level object detection, which improves accuracy. However, due to its complex anchor selection method, it took a long time to finish the detection. In the study by Lu (2021), faster R-CNN with an improved anchor selection method, Soft-NMS, was applied to detect insulators. This method achieved good accuracy and consumed less time to get a final result. Nevertheless, it only detected three images per second, which is far from real-time detection. The abovementioned methods are all based on two-stage methods, and it is necessary to research the one-stage methods too. Sadykova (2019) used the one-stage method YOLOv2 to detect insulators. This work finished 25 images per second, which just reaches the minimum standard for real-time detection, while the final accuracy only reached 88%. In the work by Feng, Guo et al. (2021), YOLOv3 was applied to detect insulators defect. This method realized a fast detection speed with 100 images per second. Nevertheless, this method sacrificed accuracy for speed, it only had 81% accuracy, which means that this method cannot be used in practical applications.
In summary, two-stage methods have high accuracy and have benefited from their two steps processing and anchor mechanism. As a side effect, they need more time to train because they are designed to extract features of images and classify them as the same as the classifiers at first. On the contrary, one-stage methods complete the selection of the region and classification simultaneously. Hence, these methods usually detect more than one hundred images per second but are often accompanied by a reduction in detection accuracy. Therefore, when comes to practical applications, a new method needs to be proposed to realize both high accuracy and speed.
2.2 Chinese Power Line Insulator Dataset
Because insulator data sets are largely unpublished, we choose a public insulator used by Tao, Zhang et al. (2018). It is an insulator dataset which provides normal insulator images captured by uncrewed aerial vehicle (UAV) and synthetic defective insulator images. This dataset is divided into two parts: Normal insulators contain the normal insulators captured by UAV, and the number of the normal insulator images is 600; Defective insulators contain the insulators with defects, and the number of the defective insulator images is 248. The samples of a normal insulator and a defective insulator are shown in Figure 1.
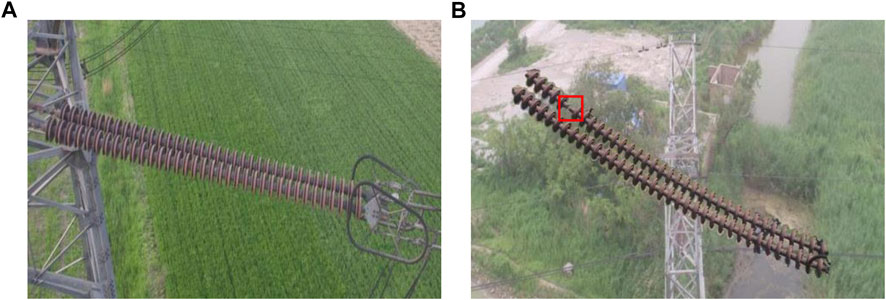
FIGURE 1. Images of a normal insulator (A) and a defective insulator (B), where the defect is marked with a red rectangular box.
Because defective insulator images are rare, a data augmentation method is applied, and it follows the following process. First, the algorithm is used to segment the defective insulators from a small part of the original images, which is called mask images. Then, affine transform is applied to augment the original images and their mask. The U-Net is trained by these images (Fischer and Brox 2015), where U-Net is a famous model to automatically segment important blocks on the image. The trained U-Net is then used to segment defective insulators from the rest part of the images. Finally, the defective insulators are attached to different backgrounds.
2.2 Development of YOLO Models
J. Redmon proposed the first version of the YOLO algorithm (Redmon et al., 2016), which is the beginning of a one-stage object detection method. It first frames object detection as a regression problem to spatially separated bounding boxes and associated class probabilities. Therefore, a single neural network predicts bounding boxes and class probabilities directly from full images in one evaluation, and that is why this model is called ‘you only look once’. The first version of YOLO contains 24 convolution layers and two fully connected layers, which makes performance not very well when the objects are close to each other.
Next, YOLOv2 and YOLOv3 were proposed by J. Redmon in 2017 (Redmon and Farhadi 2017) and 2018 (Redmon and Farhadi 2018), respectively. YOLOv3 made great progress by using the Darknet-53 network as its backbone, which influenced the next two versions of YOLO. In 2020, YOLOv4 (Bochkovskiy, Wang et al., 2020) was inspired by CSPNet (Cross Stage Partial Network) and formed the CSPDarknet-53 network as its backbone. Based on YOLOv4, G. Jocher released YOLOv5 subsequently, which now contains five versions: YOLOv5n, YOLOv5s, YOLOv5l, YOLOv5m, and YOLOv5x.
3 Proposed Methodology
In this section, we first introduce how our models work from input to output. In addition, we propose three new methods and explain how we come up with these methods. They are EIoU for loss function, Cluster-NMS for anchor generation, and AFK-MC2 for anchor selection.
3.1 Model Structure
The entire model structure is shown in Figure 2, which contains four stages: input, backbone, neck, and prediction. The input is an image of a normal insulator or defective insulator, and then it is fed to the backbone to extract the preliminary feature, which is also called a feature map. After that, the feature map is passed to the neck. The neck then processes the feature map and digs the deeper information hidden in the feature, which contains positioning information and semantic information. In the end, the output of the neck is sent to prediction to give box with the corresponding class. In the prediction stage, there are three steps that have a big impact on the final accuracy, loss function, anchor generation, and anchor selection, corresponding to the three new methods in this study.
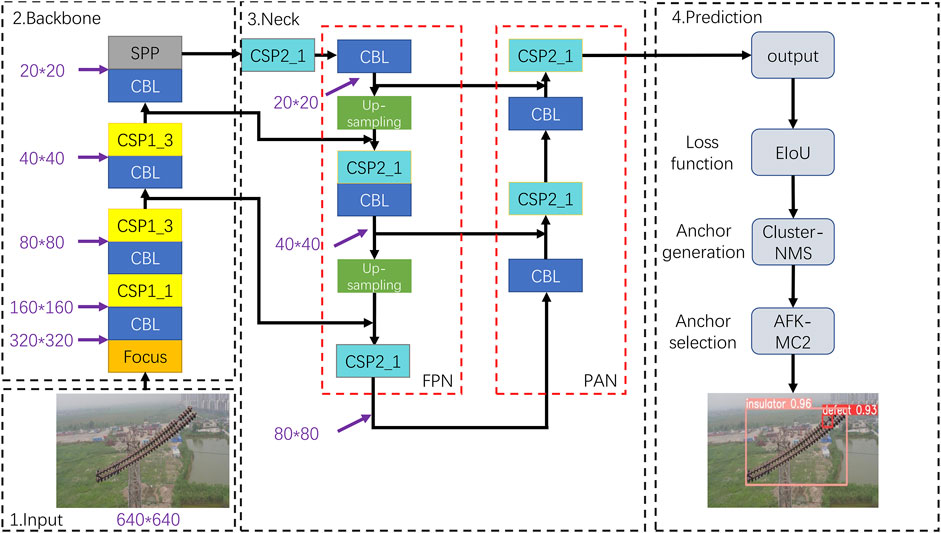
FIGURE 2. Entire model structure:1) Input an insulator image. 2) Backbone to extract feature map. 3) Neck to process the feature map and dig the deeper information. 4) Prediction to detect the insulator and defect.
3.1.1 Backbone
YOLOv5 uses the CSPDarknet-53 network as its backbone based on YOLOv4 (Bochkovskiy, Wang et al., 2020). It starts from an input image of
The main purpose of the Focus layer is to reduce parameters, reduce CUDA memory, and increase forward and backward speed while minimally impacting mAP. The key of the Focus layer is the slicing operation. As shown in Figure 3, after slicing, the
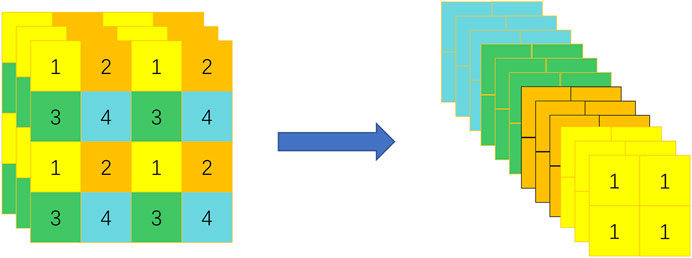
FIGURE 3. Operation of slicing: An image is divided into four regions for slice reconstruction, with the 4 × 4 × 3 image sliced into a 2 × 2 × 12 feature map.
Then, we come to the CSP layer. Different from YOLOv4, YOLOv5 designs two kinds of CSP modules. One is used in the backbone, called CSP1, while another is used in the neck, called CSP2. They are on the basis of the YOLOv3 backbone network Darknet53 (Redmon and Farhadi,2018), drawing on the experience of 2019 CSPNet (Wang, 2020). The authors of CSPNet believe that the problem of excessive inference calculation is caused by the repetition of gradient information in network optimization. Therefore, by introducing CSPNet, the feature mapping of the base layer is divided into two parts, and they are combined by the cross-stage hierarchical structure, which can reduce the computation and ensure accuracy.
3.1.2 Neck
YOLOv5 uses FPN + PAN structure as its neck. Figure 4 shows the changes in the feature map in the neck. It can be seen that a large feature map is at the bottom and a small one is at the top, which makes it looks like a feature pyramid. These two feature pyramids differ in the direction when it is formed. In the FPN structure, the feature map size gradually changes from
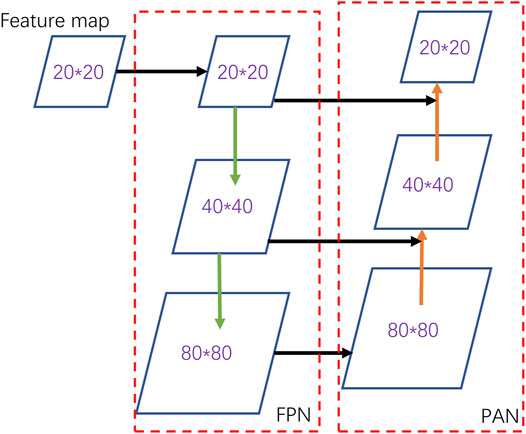
FIGURE 4. The two feature pyramids (FPN and PAN) in the neck by processing the feature map.
In this way, the FPN structure conveys strong semantic information from the top down, while the PAN feature pyramid conveys strong positioning information from the bottom up. By working in pairs, the deeper information hidden in the feature map is extracted.
3.2 New Methods for Prediction
In the prediction stage, this study considers the factors that limit performance and proposes three new methods for loss function, anchor generation, and anchor selection.
3.2.1 Loss Function
In object detection, IoU is an essential evaluation index to measure the similarity of the predicted bonding box and the ground truth box, which can improve the accuracy of object location (Yu, 2016). We considered the disadvantages of the existing loss function and proposed a new loss function EIoU that is easy to train.
It is assumed that
However, there are two existing problems of IoU. One is that when the predicted box and the ground box do not overlap, IoU becomes 0, which cannot reflect the distance between the two boxes. In this case, the loss function cannot be derived. Another is that when two predicted boxes have the same size and same IoU but different positions, IoU-loss cannot distinguish the difference between them. Therefore, GIoU is proposed (Rezatofighi, 2019). It is expressed as follows:
where C denotes the smallest enclosing box covering the predicted bonding box and the ground truth box.
When the predicted box and the ground truth box are not well aligned, the area of the smallest enclosing box C will increase, thus reducing the value of GIoU, and when the two rectangular boxes do not coincide, GIoU can also be calculated. GIoU Loss solves the preceding two problems of IoU. However, when two boxes belong to the containment relationship, the following Figure 5 is used as an example: GIoU degenerates into IOU and cannot distinguish its relative position.
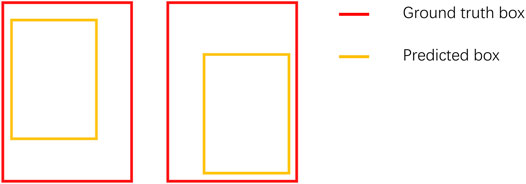
FIGURE 5. Example of the disadvantage of GIoU, in which the two predicted boxes have different locations but the same size, making the same GioU.
In order to resolve the insufficiency of GioU, DioU is proposed (Zheng, Wang et al., 2020), which considers the center distance of the two boxes. It is shown as follows:
where
A good target-box regression function should consider three important geometric factors: overlap area, center distance, and aspect ratio. Therefore, the author of DIoU proposes a new loss function CIoU (Zheng, 2021). The formula of CIoU and DIoU is similar, but an impact factor is added to take into account the aspect ratio of both the prediction box and the target box. It is expressed as follows:
where
where
In this work, we propose a new loss function, EIoU. Although CIoU considers the overlap area, center point distance, and aspect ratio of boundary box regression. However, using
where
In this way, we can retain the profitable characteristics of the CIoU. At the same time, the EIoU directly minimizes the difference between the target box’s and anchor box’s width and height, which results in a faster converge speed and a better localization result. For a clear demonstration of the superiorities of the EIoU, we perform contrast experiments of different loss functions in Section 4.2.1.
3.2.2 Anchor Generation
In order to improve the accuracy and efficiency of detection, it is important to set the anchors in advance. Anchors are a predefined collection of boxes whose width and height match the width and height of objects in the data set. In the target detection algorithm, the anchor point is the center, and the algorithm predefined several prior frames with different length–width ratios. Typically, four to ten anchors are preset at each location in the image.
K-means is one of the simplest algorithms to generate an anchor (Krishna and Murty, 1999). The main idea is that randomly initialize K centers
For the new center position, reclassify the data point
A strategy needs to be adopted to select the initial center points. K-means + algorithm is first proposed to address this problem (Arthur and Vassilvitskii 2006). The improvement of K-means + compared with K-means mainly lies in the initialization stage of the cluster center, as shown in Figure 6.
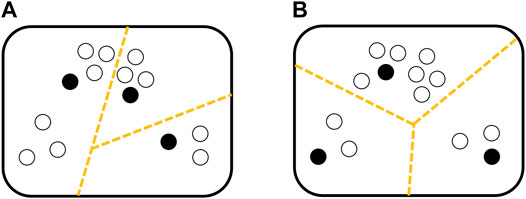
FIGURE 6. Difference clustering performance between K-means algorithm (A) and K-means + algorithm (B), where (B) seems more reasonable.
It randomly initializes one center
where
In this condition, the further
This article proposes AFK-MC2 algorithm to settle the aforementioned problem. AFK-MC2 algorithm uses Metropolis–Hasting’s algorithm to sample the centers. The Metropolis–Hastings algorithm is a MCMC method for sampling from the probability distribution
or reject it (
The proposal distribution
By using AFK-MC2 algorithm, it does not need to overpass dataset
3.2.3 Anchor Selection
Anchor selection is another important part of object detection. It pre-sets a threshold
Traditional NMS (Rothe, 2014) algorithm is expressed as follows:
where B denotes the predicted bounding box with the highest score, P denotes another predicted bounding box, and S denotes the confidence of P. When P have two much overlapped area with B, it will be deleted.
However, IoU calculation and sequential iteration inhibit the computational efficiency of traditional NMS. If there are
A cluster is a collection of boxes. If a box A belongs to the cluster, the IoU of other boxes in this cluster must greater than the threshold
Let us take a simple example, as shown in Figure 7, the black, red, blue, and orange boxes constitute a cluster, while the two green boxes constitute a cluster. Although the two clusters intersect, they do not exceed the NMS threshold, so the two box sets cannot be combined into a cluster.
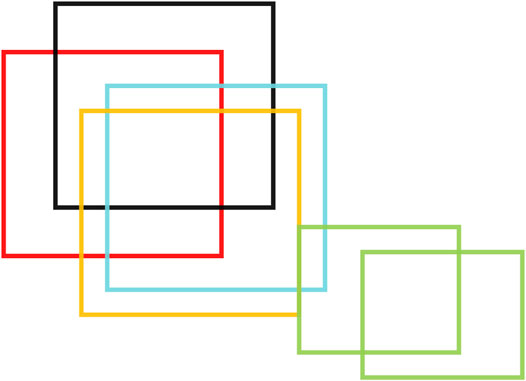
FIGURE 7. Example for cluster operation, the black, red, blue, and orange boxes constitute a cluster, while the two green boxes constitute a cluster.
Normally, when we use NMS, each cluster is iterated sequentially. In traditional NMS, although there should be no relationship between different clusters, the IoU is repeatedly counted for the boxes belonging to different clusters, and the number of iterations suppressed by sequential iteration remains the same. However, in cluster NMS, we can simplify iterating over all clusters into just iterating over the cluster with the largest number of boxes. Different clusters enjoy the same matrix operation and do not affect each other. This results in no more iterations than the number of boxes owned by the largest cluster in a picture. In this way, computing speed is greatly improved.
In addition to increasing the speed of NMS, we aimed to improve the precision of NMS too. Considering the advantages of DIoU over IoU, we added center point distance. Thus, the IoU matrix becomes the DIoU matrix directly, and since DIoU also satisfies the scale invariance, it can work well. The performances of different anchor selection methods are shown in Section 4.2.3.
4 Experiment
In this section, the experiment details and results are introduced concisely. First, some preparatory works of experiments are introduced, such as experiment configuration, data augmentation, experiment hyperparameter, and experiment evaluation index. Then, we analyze a lot of comparative experiments to evaluate whether our methods can realize high accuracy and real-time detection at the same time. Finally, we compare our model with other detection models.
4.1 Preparatory Work
4.1.1 Experiment Configuration
Deep learning requires good computer configuration, and the accuracy and speed of the same method can vary greatly in different configurations. In order to achieve reproducibility, our experiment configuration is listed in Table 1.
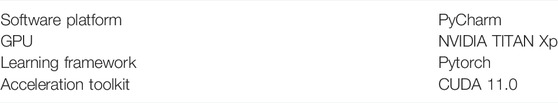
TABLE 1. Experiment configuration.
4.1.2 Data Augmentation
Compared to the data that needed in-deep learning, the 848 images in the CPLID dataset seemed insufficient. Therefore, this study used four data augmentation methods to improve the training effect. These methods are listed in Table 2. After that, a novel dataset of 2,085 images was generated with 1800 training samples, 225 validation samples, and 60 testing samples separately.

TABLE 2. Data augmentation methods.
4.1.3 Experiment Hyperparameter
Most of the model parameters are learned in the process of training. Contrarily, hyperparameters are parameters whose values are set prior to the beginning of the learning process rather than parameter data obtained through training. In general, it is necessary to optimize the hyperparameters and select a group of optimal hyperparameters for the learning machine to improve the performance and effect of learning. Therefore, the experiment hyperparameters in our method are listed: 0.01 initial learning rate, 0.0001 final learning rate, 0.937 momentum, 200 iterations, and a batch size of 4.
4.1.4 Experiment Evaluation Index
In object detection, precision (P), recall (R), average precision (AP), and mean average precision (mAP) are often used as evaluation indexes. The precision indicates the proportion of proper predictions among all samples predicted by the model. The recall denotes the proportion of proper samples predicted by the model among all positive samples.
If a model performs well, it should behave as follows: precision remains at a high level while recall grows. However, a model with poor performance will lose a lot of precision value in order to improve recall value. Therefore, research studies often use the P–R curve to show the tradeoff between them. AP denotes the area of the P–R curve, and the higher the AP, the better the model. In addition, the mAP is the average of all AP. These evaluation indexes are expressed as follows:
where the details of the definition of TP, FP, TN, and FN are given in Table 3.
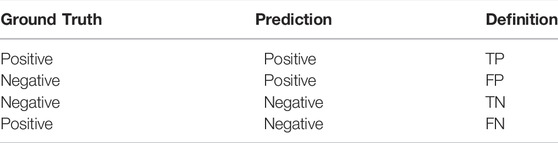
TABLE 3. Details of experimental definition.
4.2 Comparative Experiment
In order to verify the effectiveness of the proposed method, we conducted comparative experiments for loss function, anchor generating, and anchor selection, respectively, and the baseline of each experiment was the unchanged YOLOv5s model.
Since there are two kinds of targets, insulator and defect, to be detected, we mostly used recall, precision, and mAP to evaluate the effect. In addition, for the purpose of improvement of different experiments, we added different evaluation indexes.
4.2.1 Loss Function Comparation
We chose the YOLOv5s model as the baseline, which uses IoU as its loss function. We compare the different performances of the four methods: IoU, GIoU, CIoU, and EIoU (ours), and the results are shown in Table 4.
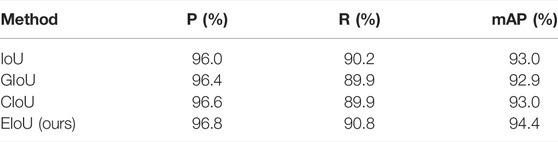
TABLE 4. Different performances of loss function.
It can be seen from Table 4 that the EIoU method improves in all evaluation indicators compared with other methods. Compared with the other two indexes, EIoU improved the most in mAP by about 1.5%, indicating that this method achieved a balance between precision and recall. These results show that the EIoU method can obtain a good performance in insulator defect detection.
4.2.2 Anchor Generating Method Comparation
As for anchor generating, we used the K-means method and AFK-MC2 (ours) method to generate the preset anchor boxes. Then, we trained the YOLOv5 model with these anchor boxes. The results are shown in Table 5.
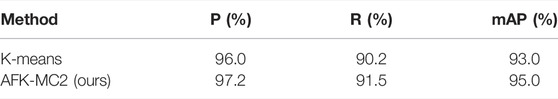
TABLE 5. Different performances of anchor generating method.
It can be seen from Table 5 that all evaluation indexes increase a lot by using AFK-MC2, which verifies the idea of using a proper approach to select the initial center of anchor boxes.
4.2.3 Anchor Selection Method Comparation
Because one of the goals of Cluster-NMS (ours) is to increase computing speed, we added a new evaluation index FPS, which means the number of images processed per second. The results are shown in Table 6.
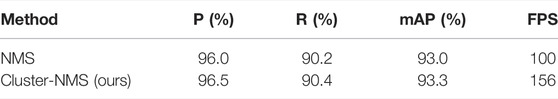
TABLE 6. Different performances of anchor selection method.
It can be seen from Table 6 that the Cluster-NMS method mainly improves the speed of calculation and image processing, with FPS increasing from 100 to 156, while improving other indexes a little. An FPS of 156 means it can be used for real-time detection for insulator detection.
In addition, this method aims to avoid missing detection of insulators because of mutual occlusion in images. As shown in Figure 8, the left one is predicted by YOLOv5 with NMS, and the right one is predicted by YOLOv5 with Cluster-NMS. The results show that when the NMS method misses the insulator on the upper left because of the shielding, the Cluster-NMS method successfully detects it, which increases the reliability of insulator detection results.
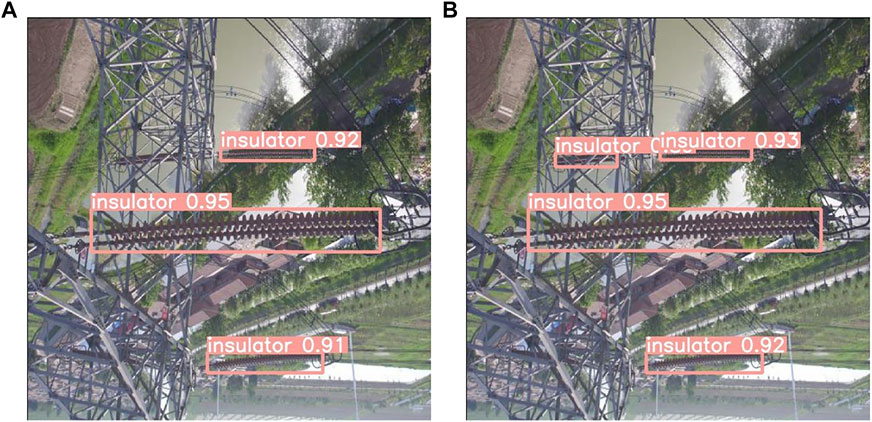
FIGURE 8. Difference performances between NMS (A) and Cluster-NMS (B), where (B) successfully detects insulator on the upper left, while (A) misses it because of the shielding.
4.3 Final Result
In the previous section, we performed several comparative experiments to demonstrate the three new methods when used alone. The results show that EIoU and AFK-MC2 obtain great improvement in the detection accuracy, while Cluster-NMS increase the detection speed with FPS from 100 to 156. In this section, we applied all these methods, EIoU, AFK-MC2, and Cluster-NMS, to get a final result of our improved model.
Then, we compared our model with many famous object detection models such as DETR (Carion, Massa et al., 2020) and Cascade-RCNN (Cai and Vasconcelos 2018). The results are shown in Table 7. Before analyzing the final results, it is necessary to make a review of our model, which contains four stages: input, backbone, neck, and prediction. Among them, the backbone and neck are well-designed to fully extract the information from images. In addition, this article proposes three new methods for the prediction stage and obtains a greatly improved model. As shown in Table 7, compared with the original YOLOv5, our model obtains a greater mAP of 96%, while FPS increases by approximately 60%. This means that our new methods surely improve the performance of insulator defect detection. Compared with other two-stage models, although less accurate than the most advanced two-stage model, such as DETR, it is better than most two-stage models. But our model has an overwhelming advantage over theirs in the aspect of detection speed, which means that it can realize real-time detection while maintaining high accuracy in routine insulator defect detection applications.
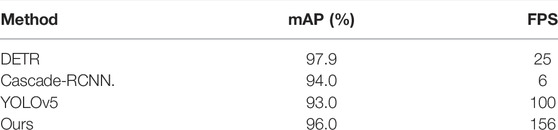
TABLE 7. Different performances of detection methods.
5 Conclusion
In summary of this article, insulator defect detection technology is the key to maintaining the normal operation of the power grid. Existing methods can be divided into two categories. One-stage method usually cannot achieve high accuracy, while two-stage method sacrifices computational speed to improve accuracy. Aiming to design a model that takes care of both speed and accuracy, this study uses the YOLOv5 model as the baseline. EIoU loss function and AFK-MC2 anchor generation method are proposed to improve the accuracy. We propose the Cluster-NMS method to increase computational speed. Finally, the experimental results show that our model achieved the highest FPS of 156 with an mAP of 96%, which is higher than most two-stage models. In this way, a high accuracy real-time insulator string defect detection model is proposed in this study.
Our new detection model has a very broad application prospect. As mentioned earlier, it will bring huge losses to the economy and personal safety once insulators break and lose their insulation capacity. Therefore, a real-time insulator string defect detection means that it can detect the location of insulator failure as soon as possible, which prevents the further expansion of the accident. At the same time, the high precision ensures that it is almost impossible to miss any insulator defects, which protects the power grid and personal safety.
Finally, there is still a lot of room for improvement in our model. For instance, all our new methods are proposed in the prediction stage, which ignores the improvements in the backbone and neck. In the following work, starting from the framework structure of the model, we plan to study whether the backbone can be lightweight while ensuring accuracy and whether the neck can use a better structure to obtain more information.
Data Availability Statement
Publicly available datasets were analyzed in this study. These data can be found at: https://github.com/uinyu/InsulatorDataSet.
Author Contributions
JD contributed to the methodology, code, and writing. HC helped with methodology, resources, and funding acquisition. XD was responsible for the experiment and result analysis. CA helped with writing, review, editing, and dataset.
Funding
This research work was supported by the Science and Technology Project of State Grid Zhejiang Electric Power Co., LTD. (5211MR20004V).
Conflict of Interest
Authors JD, HC, XD, and CA were employed by the EHV Branch Company of State Grid Zhejiang Electric Power Co., Ltd. Zhejiang Electric Power Company, a wholly owned company of State Grid Corporation of China, is a state-owned super-large energy supply enterprise mainly engaged in power grid operation. It is responsible for the construction, operation, management and operation of Zhejiang power grid, and provides power supply and service for the economic and social development and people’s life of Zhejiang Province, China.
Publisher’s Note
All claims expressed in this article are solely those of the authors and do not necessarily represent those of their affiliated organizations, or those of the publisher, the editors, and the reviewers. Any product that may be evaluated in this article, or claim that may be made by its manufacturer, is not guaranteed or endorsed by the publisher.
References
Bochkovskiy, A., Wang, C-Y., and Mark Liao, H-Y. (2020). Yolov4: Optimal Speed and Accuracy of Object Detection. arXiv preprint arXiv:2004.10934.
Cai, Z., and Vasconcelos, N. (2018). “Cascade R-Cnn: Delving into High Quality Object Detection,” in Proceedings of the IEEE conference on computer vision and pattern recognition.
Carion, N., Massa, F., Synnaeve, G., Usunier, N., Kirillov, A., and Zagoruyko, S. (2020). “End-to-end Object Detection with Transformers,” in European conference on computer vision (Springer). doi:10.1007/978-3-030-58452-8_13
Chauhan, R., Ghanshala, K. K., and Joshi, R. C. (2018). “Convolutional Neural Network (CNN) for Image Detection and Recognition,” in 2018 First International Conference on Secure Cyber Computing and Communication (ICSCCC) (IEEE). doi:10.1109/icsccc.2018.8703316
Dadi, H. S., and Mohan Pillutla, G. K. (2016). Improved Face Recognition Rate Using HOG Features and SVM Classifier. Iosr 11 (04), 34–44. doi:10.9790/2834-1104013444
Dai, J., Li, Y., He, K., and Sun, J. (2016). “R-fcn: Object Detection via Region-Based Fully Convolutional Networks,” in Advances in neural information processing systems, 29.
Feng, Z., Guo, L., Huang, D., and Li, R. (2021). “Electrical Insulator Defects Detection Method Based on YOLOv5,” in 2021 IEEE 10th Data Driven Control and Learning Systems Conference (DDCLS) (IEEE).
Fischer, P., and Brox, T. (2015). “U-net: Convolutional Networks for Biomedical Image Segmentation,” in Medical Image Computing and Computer-Assisted Intervention (MICCAI).
Gao, K., Lyu, L., Huang, H., Fu, C., Chen, F., and Jin, L. (2019). “Insulation Defect Detection of Electrical Equipment Based on Infrared and Ultraviolet Photoelectric Sensing Technology,” in IECON 2019-45th Annual Conference of the IEEE Industrial Electronics Society (IEEE).
He, K., Zhang, X., Ren, S., and Sun, J. (2015). Spatial Pyramid Pooling in Deep Convolutional Networks for Visual Recognition. IEEE Trans. Pattern Anal. Mach. Intell. 37 (9), 1904–1916. doi:10.1109/tpami.2015.2389824
Huang, X. (2017). Research of Composite Insulator Detection Device Based on Electric Field Method and Resistance Method. DEStech Transactions on Computer Science and Engineering icitia.
Krishna, K., and Narasimha Murty, M. (1999). Genetic K-Means Algorithm. IEEE Trans. Syst. Man. Cybern. B 29 (3), 433–439. doi:10.1109/3477.764879
Li, D., Zhang, G., Hou, Y., and Zhang, B. (2019). Charge Distribution on Polymer Insulator Surface under AC Voltage. IEEE Trans. Dielect. Electr. Insul. 26 (5), 1709–1715. doi:10.1109/tdei.2019.008260
Li, W. (2010). “Recognition of Insulator Based on Developed MPEG-7 Texture Feature,” in 2010 3rd International Congress on Image and Signal Processing (IEEE). doi:10.1109/cisp.2010.5648283
Liu, S. (2018). “Path Aggregation Network for Instance Segmentation,” in Proceedings of the IEEE conference on computer vision and pattern recognition. doi:10.1109/cvpr.2018.00913
Liu, W., Anguelov, D., Erhan, D., Szegedy, C., and Reed, S. (2016). SSD: Single Shot MultiBox Detector. Amsterdam, NETHERLANDS: 14th European Conference on Computer Vision.
Lu, W. (2021). “Insulator Detection Method Based on Improved Faster R-CNN with Aerial Images,” in 2021 2nd International Symposium on Computer Engineering and Intelligent Communications (ISCEIC) (IEEE). doi:10.1109/isceic53685.2021.00093
Montavon, G., Samek, W., and Müller, K.-R. (2018). Methods for Interpreting and Understanding Deep Neural Networks. Digit. Signal Process. 73, 1–15. doi:10.1016/j.dsp.2017.10.011
Redmon, J., Divvala, S., Girshick, R., and Farhadi, A. (2016). “You Only Look once: Unified, Real-Time Object Detection,” in Proceedings of the IEEE conference on computer vision and pattern recognition. doi:10.1109/cvpr.2016.91
Redmon, J., and Farhadi, A. (2017). “YOLO9000: Better, Faster, Stronger,” in Proceedings of the IEEE conference on computer vision and pattern recognition. doi:10.1109/cvpr.2017.690
Redmon, J., and Farhadi, A. (2018). Yolov3: An Incremental Improvement. arXiv preprint arXiv:1804.02767.
Ren, S. (2015). “Faster R-Cnn: Towards Real-Time Object Detection with Region Proposal Networks,” in Advances in neural information processing systems, 28.
Rezatofighi, H. (2019). “Generalized Intersection over Union: A Metric and a Loss for Bounding Box Regression,” in Proceedings of the IEEE/CVF conference on computer vision and pattern recognition.
Rothe, R. (2014). Asian Conference on Computer Vision. Springer.Non-maximum Suppression for Object Detection by Passing Messages between Windows
Sadykova, D. (2019). IN-YOLO: Real-Time Detection of Outdoor High Voltage Insulators Using UAV Imaging. IEEE Trans. Power Deliv. 35 (3), 1599–1601.
Sima, W., Yuan, T., Yang, Q., Xu, K., and Sun, C. (2010). Effect of Non-uniform Pollution on the Withstand Characteristics of Extra High Voltage (EHV) Suspension Ceramic Insulator String. IET Gener. Transm. Distrib. 4 (3), 445–455. doi:10.1049/iet-gtd.2009.0387
Tao, X., Zhang, D., Wang, Z., Liu, X., Zhang, H., and Xu, D. (2018). Detection of Power Line Insulator Defects Using Aerial Images Analyzed with Convolutional Neural Networks. IEEE Trans. Syst. Man, Cybern. Syst. 50 (4), 1486–1498.
Wang, C.-Y. (2020). “CSPNet: A New Backbone that Can Enhance Learning Capability of CNN,” in Proceedings of the IEEE/CVF conference on computer vision and pattern recognition workshops.
Wang, C. (2022). “Analysis of a 35kV Vacuum Circuit Breaker Accident Caused by Protection Misoperation,” in 2nd International Conference on Mechanical, Electronics, and Electrical and Automation Control (METMS 2022) (SPIE).
Wen, Q., Luo, Z., Chen, R., Yang, Y., and Li, G. (2021). Deep Learning Approaches on Defect Detection in High Resolution Aerial Images of Insulators. Sensors 21 (4), 1033. doi:10.3390/s21041033
Wu, K., Bozzi, M., and Fonseca, N. J. G. (2021). Substrate Integrated Transmission Lines: Review and Applications. IEEE J. Microw. 1 (1), 345–363. doi:10.1109/jmw.2020.3034379
Wu, Q., An, J., and Lin, B. (2012). A Texture Segmentation Algorithm Based on PCA and Global Minimization Active Contour Model for Aerial Insulator Images. IEEE J. Sel. Top. Appl. Earth Obs. Remote Sens. 5 (5), 1509–1518. doi:10.1109/jstars.2012.2197672
Yao, Z., Yao, J., Yu, X., and Sui, W. (2019). “Transmission Line Insulator Fault Detection Based on Ultrasonic Technology,” in Journal of Physics: Conference Series (England: IOP Publishing). doi:10.1088/1742-6596/1187/2/022056
Yousaf, M., Iqbal, T., Hussain, M. A., Tabish, A. N., Haq, E. U., Siddiqi, M. H., et al. (2022). Microstructural and Mechanical Characterization of High Strength Porcelain Insulators for Power Transmission and Distribution Applications. Ceram. Int. 48 (2), 1603–1610. doi:10.1016/j.ceramint.2021.09.239
Yu, J. (2016). “Unitbox: An Advanced Object Detection Network,” in Proceedings of the 24th ACM international conference on Multimedia.
Zhai, Y. (2014). A Method of Insulator Detection from Aerial Images. Sensors Transducers 177 (8), 7–13.
Zhai, Y., Chen, R., Yang, Q., Li, X., and Zhao, Z. (2018). Insulator Fault Detection Based on Spatial Morphological Features of Aerial Images. IEEE Access 6, 35316–35326. doi:10.1109/access.2018.2846293
Zheng, Z. (2021). Enhancing Geometric Factors in Model Learning and Inference for Object Detection and Instance Segmentation. IEEE Trans. Cybern. doi:10.1109/tcyb.2021.3095305
Keywords: deep learning, detection of insulators, YOLOv5 algorithm, Cluster-NMS, EIoU loss
Citation: Ding J, Cao H, Ding X and An C (2022) High Accuracy Real-Time Insulator String Defect Detection Method Based on Improved YOLOv5. Front. Energy Res. 10:928164. doi: 10.3389/fenrg.2022.928164
Received: 25 April 2022; Accepted: 27 May 2022;
Published: 08 July 2022.
Edited by:
Jun Liu, Xi’an Jiaotong University, ChinaReviewed by:
Giuseppe Ciaburro, Università della Campania, ItalyKeyu Wu, Institute for Infocomm Research (A∗STAR), Singapore
Copyright © 2022 Ding, Cao, Ding and An. This is an open-access article distributed under the terms of the Creative Commons Attribution License (CC BY). The use, distribution or reproduction in other forums is permitted, provided the original author(s) and the copyright owner(s) are credited and that the original publication in this journal is cited, in accordance with accepted academic practice. No use, distribution or reproduction is permitted which does not comply with these terms.
*Correspondence: Jian Ding, MTc3MzcxOTVAcXEuY29t