 Fei Lin
 Honglei Ren1
 Yuezan Tao
94% of researchers rate our articles as excellent or good
Learn more about the work of our research integrity team to safeguard the quality of each article we publish.
Find out more
ORIGINAL RESEARCH article
Front. Energy Res. , 06 January 2023
Sec. Process and Energy Systems Engineering
Volume 10 - 2022 | https://doi.org/10.3389/fenrg.2022.928125
This article is part of the Research Topic Advanced Technologies for Planning and Operation of Prosumer Energy Systems View all 111 articles
Due to the temperature of shallow aquifers being affected by atmospheric temperature, groundwater source heat pumps (GWSHPs) become unstable and the operation efficiency of GWSHP is constrained. In the study, the coupling numerical simulation model of the groundwater flow field and temperature field is established based on the continuous monitoring results in an actual experimental site, and the water and thermal migration of shallow aquifer is simulated under the influence of the atmospheric environment. The influence of the dynamic change in ground temperature is analyzed on a GWSHP. The results indicated that the temperature of the shallow aquifer is affected by the external temperature, and the recharge temperature in the summer cooling period was 33°C, and that in the winter heating period was 6°C in the actual site, to avoid the occurrence of thermal penetration when there is a gap between the actual situation and the design situation, the single cooler can balance the insufficient cooling capacity in summer under the most unfavorable situation. The research results can also provide a reference for the development and utilization of geothermal energy resources in shallow aquifers.
The aquifer resource storage technology for building heating and cooling has been widely used on a global scale. A shallow geothermal resource exists both below the surface (generally less than 200 m depth) within a certain range of rock mass, groundwater and surface water. The temperature is usually below 25°C (Wei, 2010). It is the product of deep geothermal and solar energy, and now can be available for large-scale commercial exploitation (Norio et al., 2003; Recep et al., 2004; Schneider et al., 2016; Ucar and Inalli, 2005). Moreover, the development and use of efficient, innovative, low-carbon heating and cooling technologies to reduce energy use and carbon emissions will bring considerable environmental and economic benefits (Ismail et al., 2021; Mukhtar et al., 2021; Shrestha et al., 2017).
For a certain heating or cooling load, the demand volume of heat carrier (water) amount is inversely proportional to the grade in unit time. That is, the higher the water temperature, the smaller the required water amount. Therefore, from the perspective of the GWSHP system efficiency, the aquifer of large water yield, high grade, and good permeability is considered the preferred object (Masciale et al., 2015; Park et al., 2015; Ramos et al., 2015; Zhou et al., 2015). On the other side, considering water-resources protection, a good permeability aquifer is preferred for recharge. So priority aquifer is widespread distribution, large thickness, good permeability and deeply buried (Sterling and Gordon et al., 1960). The studies of groundwater geothermal energy application mostly take these aquifers mentioned above as the objects (Suzuki, 1960; Bredehoeft and Papaopulos, 1965; Kay and Groenevelt, 1974). In the hydrogeology field, the thermal Response Test (TRT) was simulated through Modflow/MT3MS codes implementing into the model all the components of a Ground Heat Exchanger system: from the U-shaped BHE to the grout material surrounding it, and the results showed that the effect of the grout is negligible, therefore is advantageous to avoid modeling its geometry and thermal/physical parameters (Alberti et al., 2016). In addition, a Darcy flow is imposed across the medium. The typical operation of a Borehole Heat Exchanger operating both in winter and summer is simulated for 2 years, under different groundwater velocities. From both the energy and the aquifer temperature field points of view, the velocity ranges for the respectively negligible and relevant influence of the groundwater flow are identified (Angelotti et al., 2014).
These aquifers are only distributed in karst areas or plains with a thick porous aquifer. However, the hilly areas which distribute more extensively (two-thirds of the land area in China) generally only develop shallow aquifers of small thickness. It is not given enough attention to the research of geothermal energy in such shallow aquifers. Vadose zone and adjacent shallow aquifer are the dynamic links to the water circulation system, which play a very important role in the utilization of shallow geothermal energy and prediction of contaminants migration. Because of huge water storage, high yield and thermal energy production, shallow aquifers close to habitation are easily accessible and reusable. Suzuki used the transient method to calculate the transient change of shallow groundwater in the vertical flow field on the condition of the presence of intense day volatility atmospheric temperature (Angelotti et al., 2014). The hydrothermal features of a shallow aquifer under the effect of a GWSHP in the Italian Piemonte administration were analyzed (Bredehoeft and Papaopulos, 1965). Since 1985, shallow geothermal energy was explored at a speed of more than 10% per year in the United States. Currently, shallow geothermal energy home use for heating (cooling) could account for 19% of commercial buildings, and for 30% of the new construction.
By the joint action of gravity potential, temperature gradient and moisture gradient, groundwater heat storage and transfer is an important part of the hydrological cycle. There is a multitude of research on soil water-heat migration law and the mathematical model. A dual parameter mathematical model to solve the thermally coupled problem of soil water and groundwater had been established based on the microscopic properties of porous media, mass conservation and energy conservation principle to analyze the thermal transport mechanism of soil water (De Vries, 1958; Philip, 1957; Philip and De Vries, 1957). The soil moisture effect on the thermal conductivity has been investigated through a series of experiments (Horton and Wierenga, 1984). The simulation technology of aquifer energy storage has been discussed and the simulation accuracy has been improved by mixed finite element simulation in soil water flow and heat transport (Chounet et al., 1999; Mercer et al., 1982).
It is difficult to solve groundwater heat storage and transport problems analytically due to their complexity. The irregular and the in-homogeneous problem can be converted to regular and homogeneous ones by numerical method, moreover, it is widely used. The groundwater heat transfer simulation software contains SWIFT, AQUA3D, SUTRA, HST3D, TOUGH2, FEFLOW, etc. TOUGH2 is mainly used in underground thermal energy storage, nuclear waste disposal, and environmental assessment; it is also applied to numerical simulation of multi-component, multi-phase flow of heat and water migration, and solute transport in both porous and fractured media medium under non-isotherm conditions. Under the temperature gradient, multiple transport mechanisms are studied by TOUGH2, and good stability and accuracy are demonstrated by comparing the numerical simulation results and experimental data (Lien and Wittmann, 1995). Also, a wide range of non-saturated water 3D simulations are carried out using the applied form of parallel computing of TOUGH2 (Zhang et al., 2003). TOUGH2 has been widely used in geothermal power generation, geothermal heating simulation, nuclear waste treatment process heat and mass transport. Fluid migration is described by Darcy’s law of multi-phase, and solute transport is depicted by the mass transfer multi-state transport mode. The heat transfer can be used to simulate heat conduction and thermal convection with consideration of the latent effect. In recent years, a different method to simulate the heat transport field in an aquifer through modflow-USG code is explored, which is more effective in the calculation to simulate a larger area with multiple BHEs. The connected linear network (CLN) software package was introduced in modflow-USG. This method is simpler and faster, and can reproduce the annual operation of one or more BCH in the aquifer. The advantage is to estimate the contribution of different GSHP systems in total aquifer thermal perturbation, which is worthy of further study (Antelmi et al., 2021). In addition, the heat transport mechanisms in the quantification of shallow geothermal resources (Alcaraz et al., 2016), the grouting material on borehole heat exchanger’s performance in aquifers (Alberti et al., 2017), and the thermal response test with moving line sources (Antelmi et al., 2020) have been conducted relevant research.
Generally, the development and utilization of shallow geothermal energy are mainly focused on the abundant groundwater aquifer with stable temperature. The aquifer usually has greater thickness in plains areas, and less thickness in hilly areas, which account for two-thirds of China. In addition, the boundary and initial conditions are more important for the hydrodynamic field and temperature field. Therefore, it is necessary to study the strategies for effective utilization of geothermal energy in shallow aquifers, and the importance of boundary conditions has been researched for mass and energy transfer solutions (Lubryka and Malecha, 2017a,2017b; Malecha and Malecha, 2014; Shu et al., 2017). Shallow geothermal resource exploitation not only has hydraulic and thermal effects on the environment but also induces physicochemical changes that can compromise the operability of installations (García-Gil et al., 2016). And the seasonal alternate pumping is better than the normal pumping but both produce heat transfixion phenomenon by the hydro-geological conceptual model and groundwater-thermal coupling model research. Thermal perturbation produced in the subsurface represents a complex transport phenomenon, including intrinsic characteristics of the exploited aquifer, abstraction and reinjection well features, and the temporal dynamics of the accessed groundwater (Russo et al., 2018).
In plains regions, aquifers usually have abundant groundwater with a stable temperature and a considerable thickness. However, aquifers are usually thinner and shallower in hilly regions, which occupy two thirds of China. The temperature fields of aquifers are easily influenced, especially by the atmospheric boundary conditions. Therefore, it is necessary to study the development and utilization of shallow geothermal energy efficiently in those thin and shallow aquifers. For the above reasons, the influence mechanism of the atmospheric boundary on the shallow geothermal field was researched. In addition, the shallow geothermal energy efficiently was verified by the data of the monitoring of the GWSHP system. In the actual experimental site, a heat-water coupled numerical model was established to simulate the geothermal dynamic variety in the shallow aquifer. The parameter was presented to compare the designed temperature in traditional experience and the geothermal dynamic variety temperature. In the actual site, there was a thermal penetration phenomenon, so the geothermal dynamic variety was considered as a constraint condition to judge the performance of GWSHP system. This study provides a scientific understanding for the further exploitation of geothermal energies in such shallow and thin aquifers near rivers.
The study area is located in Jingxian county, southeast of Anhui Province, China. The south and northwest of the area are hilly and mountainous regions and the central part is a valley plain. The northern part of the area is higher than the southern part and the western part is higher than the eastern part. The study area is characterized by a subtropical monsoon climate, with an average annual atmospheric temperature of 14°C and annual groundwater temperature of 17°C, respectively. There are numerous rivers, abundant water resources, and the annual precipitation is 1,551 mm. Qingyi river is the main river across the central part of the area. The formation of the study area belongs to Yangzi platform formation includes Middle Proterozoic, Proterozoic, Lower Paleozoic, Upper Paleozoic, Mesozoic, and Cenozoic. The aquifers can be mainly classified as the fissure karst aquifer, the fractured rock and loose rock pore aquifer. Precipitation is the main recharge source of the porous aquifers. The infiltration and recharge condition is good. The phreatic water depth is shallow, generally is about 0.5–1.5 m, and the level amplitude is 1–3 m. Groundwater runoff direction is controlled by local topography, generally from the piedmont to the river. Under natural conditions, the main ways of phreatic water discharge are evaporation and lateral outflow, and the confined water drains into rivers, as shown in Figure 1.
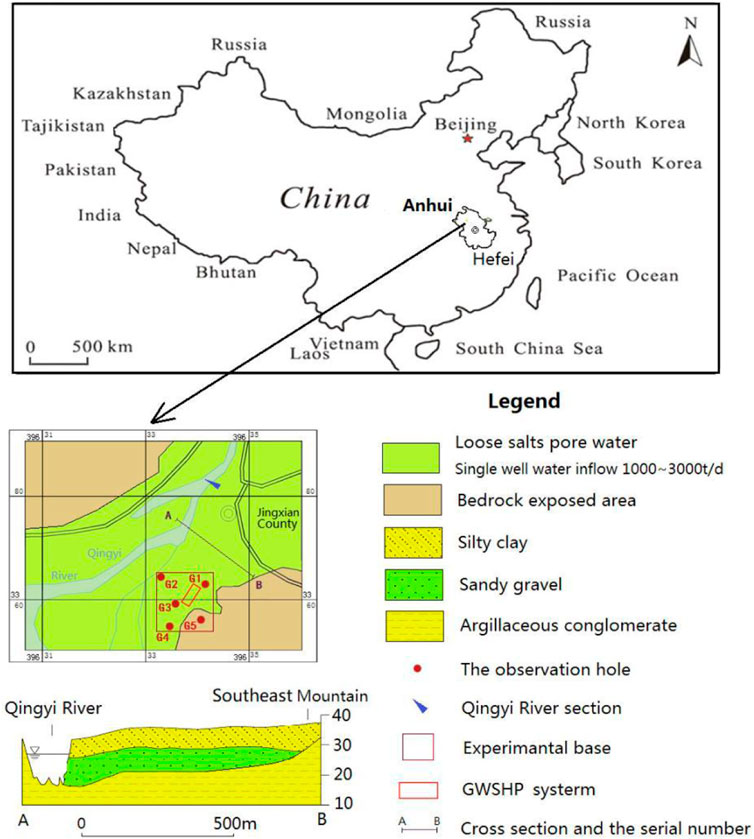
FIGURE 1. Regional hydrogeology map of the study area.
The test site had been built in October 2011. It is in the center of the study area and located on the first terrace of the Qingyi river, which is a typical characteristic of the formation of dual structure. The north boundary of the test site is close to the Qingyi river, and the south boundary is to the Southeast mountain. The whole perimeter is 2.5 km, and the control area is about 0.4 km2. The loose deposit is a typical dual structure with thickness of 10–20 m. The upper stratigraphic section is a sandy loam and loam layer with a thickness of about 0–6 m and weak permeability. The lower is gravel layer with a thickness of 6–16 m. The underlying bedrock is an argillaceous conglomerate with poor water holding capacity, which can be regarded as an impermeable layer. Owing to the good permeability and rich water content, the gravel layer is considered as the target aquifer for heat pump projects. Therefore, because of the shallow burial depth, the water temperature of the gravel layer is affected by atmospheric temperature.
The main work of the test site includes five groundwater level and groundwater temperature observation sites, one water level and water temperature of Qingyi river observation site, one soil moisture observation system and two soil water and ground temperature monitoring systems with different buried depths, which are shown in Figure 2. The observation data is collected by labor and fixed automatic data acquisition equipment. The variation of shallow groundwater energy fields can be depicted by the groundwater temperature dynamic observational data of each layer.
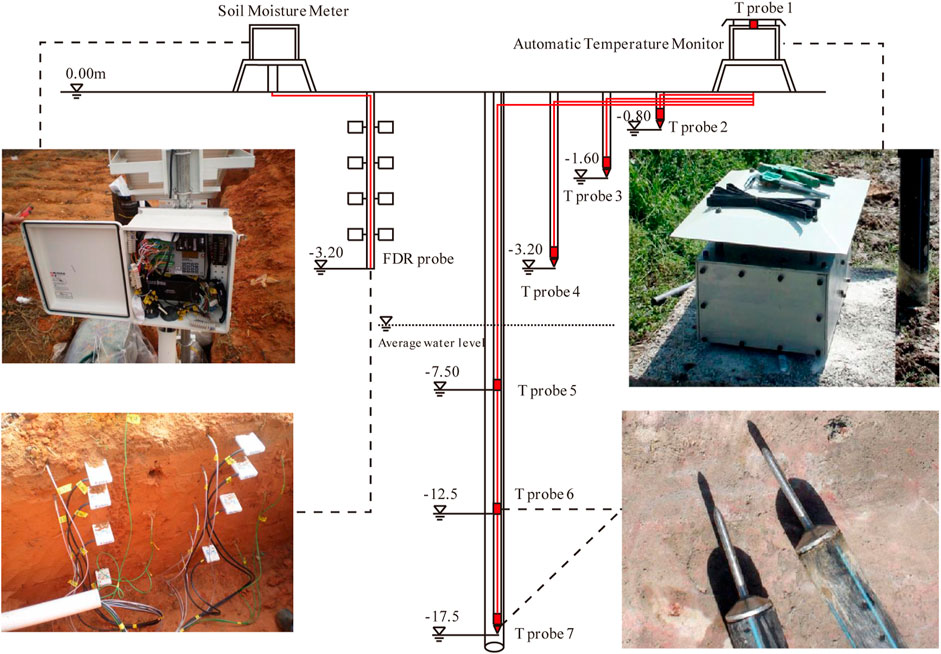
FIGURE 2. Schematic diagram of the distribution of frequency domain reflectometry probe (FDR probe, left side) and temperature probe (T probe, right side).
Soil water content and vadose water potential perform the function of determining the moisture characteristic curve in the unsaturated zone, the long-term observation data will be used to validate the model. The groundwater temperature, air temperature, soil moisture, and water potential data of the vadose zone in the test site are recorded by sensors and associated host systems against time. The main measuring equipment includes a dual automatic temperature monitor and Frequency Domain Reflectometry (FDR) soil moisture meter (to collect soil moisture and water potential data), the accuracy of the test equipment are shown in Table 1 and schematic diagram is shown in Figure 2.
TABLE 1. The accuracy of main experimental equipment.
The theoretical basis of the groundwater thermal transfer model is the groundwater flow equation, solute and heat transport equation. The core of groundwater-heat transfer is seepage in groundwater flow and thermal transport theoretical equation, based on the Three Conservation Law that is consists of mass, momentum and energy conservation. Numerous previous studies developed the classical theory of heat transfer in groundwater flow (Bear, 1972; Marsily, 1986; Domenico and Schwartz, 1998; Ing Eb Ritsen and Sanford, 1998; Deming, 2002).
Fundamental equation. Darcy’s law is the equation obtained in the experiment, which describes the macroscopic flow pattern of the fluid in porous media. In a homogeneous porous medium, the Darcy’s law can be expressed as:
where vi is the groundwater flow velocity (m/s), Kij is permeability coefficient (m/s), h is the groundwater head (m), xj is space variables (m).
Fourier establishes the theoretical basis of heat conduction. For a homogeneous solid, the heat passing through a given section per unit time is proportional to the temperature change rate perpendicular to the section and the section area. That is, the heat flux is proportional to the temperature gradient, and the direction of transmission is opposite to the direction of temperature rise. The expression is :
where qτ is heat flux, λij is effective thermal conductivity (W/m K), T is the temperature (°C), gradT is a temperature gradient in space.
According to the principle of mass conservation, the change of liquid in the equilibrium unit is equal to the change of liquid mass in the unit considering the source and sink terms. The groundwater continuous equation describing the dynamic equilibrium of saturated groundwater is:
where Ss is the specific storage (1/m), h is the groundwater head (m), Kij is hydraulic conductivity (m/s), W is the source and sink term (kg/m3 s).
According to the principle of energy conservation (Zhu, 1990), the basic differential equation of heat migration in porous media can be written as:
where t is time (s), T is the temperature of groundwater (°C), xi and xj are space variables (m), θ is the effective porosity, vi is the groundwater flow velocity (m/s), ρw is the groundwater density (kg/m3), ρs is the solid density (kg/m3), cw and cs are the specific heat capacities of groundwater and solid (J/kg K), respectively. λij is the coefficient of thermal conductivity (W/m K) and QT is the source-sink term of heat (W/m3).
For the variations of groundwater hydrothermal migration equation with enthalpy are the main variables. The first term on the right side of Eq. 4 is the thermal dispersion caused by the change of groundwater flow velocity in pore space, in addition, the second term on the right side is the thermal convection caused by groundwater flow (Ing Eb Ritsen and Sanford, 1998).
Under appropriate and reasonable initial conditions and boundary conditions, the above basic equations are combined to solve the governing equations. Ignoring the time required for thermal equilibrium between fluid and porous media, that is, assuming that the temperature of porous media and surrounding fluid are the same. The thermal dissipation caused by thermal radiation, chemical reaction effect and viscosity are ignored, moreover, the changes of physical parameters are also ignored, such as hydrogeological parameters and thermophysical parameters of fluid and porous media with temperature and fluid concentration.
As the above discussed, the groundwater solute transport equation is comparable to the heat transport equation, therefore, the energy transport equation in groundwater can be written as:
where λij is effective thermal conductivity, T0 (x,y,z) is the initial temperature, T1 (x,y,z) is the temperature on the first boundary Γ1, T2 (x,y,z) is the heat flux on the second boundary Γ2, n is the outer normal direction of the boundary Γ2, Ω is the research area. Eq. 5 are difficult to give the analytical solution directly, which can be solved by finite difference method or finite element discretization method in the actual calculation.
Groundwater water-thermal transport numerical simulation is also the reflection of the true state of the constitutive equation. By describing the head (pressure) of the model boundary or the condition of flow boundary, indirect simulated groundwater flow, porous media flow field, temperature field, solute field, etc. are analyzed with the finite difference method, finite element method or other fixed forms. In this paper, to discuss the influence of atmospheric temperature on the shallow ground temperature field of the river terraces, the model is set up by TOUGH2 software (Pruess et al., 1999; Stephen et al., 1995). The three-dimensional conceptual model was established through the EOS3 module of TOUGH2 under unsteady non-isothermal conditions to simulate water and heat transport in the shallow geothermal field of river terraces.
Based on the hydrogeological data of two exploration holes in the test site, the exploration maximum depth was 130 m. The pumping and recharging wells group of GWSHP system were treated as the model center during the simulation period in the experimental base, and the north and south boundary are Qingyi river and Southeast mountain, respectively. Qingyi river and Southeast aquifer pinch out belt in the area was considered to be boundary conditions as both sides of the model, the area of simulation is about 3.6 km2.
According to hydrogeological characteristics of the study area, it was divided into three-layer groups: the first layer is sub clay and the permeability is regarded as a weak permeable layer, the thickness of about 6 m; the second was Pleistocene (Q1-2) aquifer composed of sand gravel, the thickness of about 10 m; and the third layer was on the third line of Anqing group (N2a), the depth was 16–55 m with the bad water quality, so it could be considered as impermeable layer group.
As to the hydrogeological and hydrodynamic conditions, the simulation model was taken into regional non-homogeneous and isotropic, the same parameters could be regarded as homogeneous sub-region, and groundwater flow obeys Darcy’s law. Taking the calculation accuracy of the model into account, the TOUGH2 polygon meshing was carried out automatically, and refined near the pumping-recharge wells group. Setting each grid cell area to be smaller than 200 m2 where the group locates, while each one is beyond the scope of the group to be less than 1.5 × 10⁵ m2. Meanwhile, the minimum angle between the grid edges is supposed to be 30°. The vertical plane and mesh generation models were shown in Figure 3.
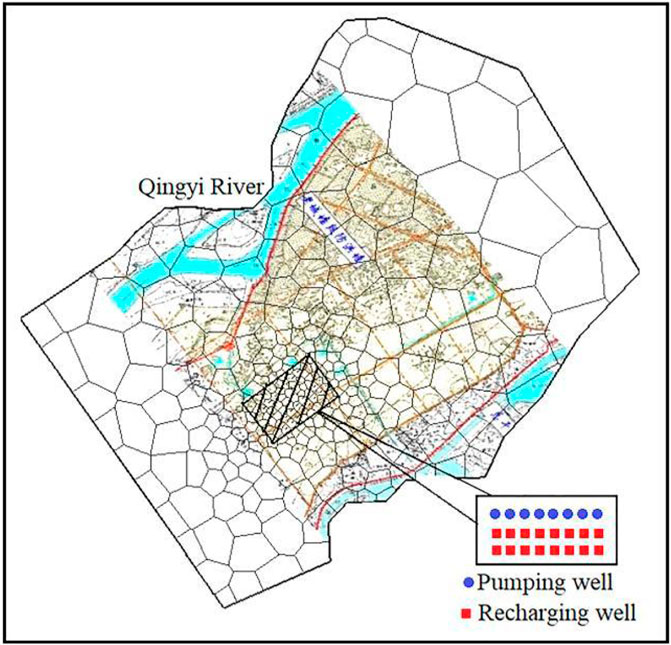
FIGURE 3. Model subdivision diagram.
The initial conditions include the initial flow field and initial temperature field in the simulation area. The underground flow field is in a state of static equilibrium and the initial groundwater level depth is about 4.5 m. The groundwater of the simulation region flows from south to north, hydraulic gradient is about 2.5‰. The atmosphere boundary is to be the upper boundary, and the data is determined by observation of automatic monitoring equipment in the experimental base. The impermeable lower boundary is set to be a predetermined temperature boundary. Where the bottom boundary is considered to be the temperature boundary and taken 18.5°C regarding lithologic. The northeast and southwest border of the study area is supposed to be constant water head boundary, head hydraulic gradient value is obtained from linear interpolation. Qingyi river acts as the first boundary condition, calculated by the average monthly water level in given dry years, the opposite Southeast mountain is aquifer pinch out belt, and treated as zero flux boundary which is watertight compartment temperature boundary.
Eight pumping wells and sixteen recharging wells are designed in GWSHP, and the single well distance is 40 m, the distance between the pumping well group and the recharge well group is 110 m. The natural flow of groundwater flows from the mountain boundary to the given head boundary of the river. The pumping wells are arranged downstream of the flow field, and the recharge wells are arranged upstream of the flow field. The well location map is shown in Figure 3.
Coefficient of soil physical properties, soil water content is monitored regularly by FDR soil moisture instrument, infiltration coefficient can be obtained by seepage test and permeability coefficient is obtained by pumping test. Soil particle analysis experiment, representative exploration wells were selected in the base and a set of sand and soil samples in each layer of each well have been taken. There were three layers of three holes numbered A, B, and C, so nine groups have done. Soil samples of holes A were taken from the piedmont test point, holes B were taken from the pilot where the heat pump system was located, and holes C were taken from the edge of the Qingyi river test point. The samples were sent to specialized laboratories for analysis of soil particles test, thus to describe particle size distribution. Then computed specific heat capacity, thermal conductivity, and other soil thermal parameters by particle size distribution results. The experiments combined sieve analysis and hydrometer method to conduct seepage test and pumping test. The climate data and groundwater level data are shown in Figure 4A, moreover, the variation curve of groundwater temperature and atmospheric temperature was mapped based on the data collected from typical observation wells, which are shown in Figure 4B.
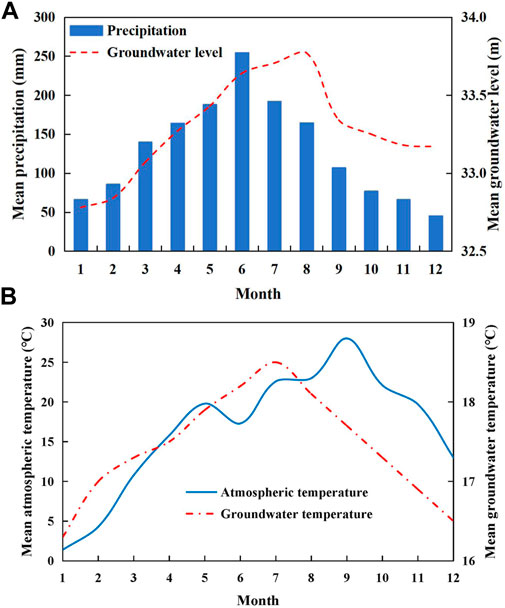
FIGURE 4. The monthly average monitoring data. (A) climate data, (B) temperature data.
The monthly average atmospheric temperature ranges from 1°C to 28°C, while the groundwater temperature ranges from 16°C to 19°C. From Figure 4, there was a similar trend between air temperature and groundwater temperature. However, the atmospheric temperature has a hysteresis effect on groundwater temperature because atmosphere temperature keeps rising in July and August, while groundwater temperature decreases instead.
Subsequent versions of TOUGH2 are suitable for unsaturated groundwater flow and heat flow migration, and it provides 10 different states of fluid equations called EOS (equation of state) models, which are widely used (Finsterle, 1999).
TOUGH2 uses the integral finite difference method IFDM to solve the groundwater flow and heat transfer coupling problem, and the basic mass and energy conservation formula can be written as the same form.
where Vn is the closed area of Γn, Mk is the accumulation of mass or energy, k is different mass components or energy sources, Fk is the mass flow or heat flow, qk is the source sink.
Spatial discretization is to use a set of limited discrete points instead of the original continuity equation on Vn, and the calculated regions are divided into many non-overlapping sub-regions. As explained by the instructions of TOUGH2, the spatial discretization methods is:
where Mn is the average value of M on the region of Vn.
The surface integral is approximately discrete into the sum of the average value over the surface segment:
where Fnm is the normal component on the surface segment Anm of the F in between Vn and Vm.
For Eq. 6, the TOUGH2 is discrete in time via a one-dimensional finite difference:
The right side of the Eq. 9 are the fluid flux and source terms, respectively. The implicit difference scheme solution requires more computational time than the explicit format, but requires a lower step size and is mathematically more stable. TOUGH2 uses a one-dimensional implicit differential scheme to increase the stability, and a series of nonlinear discrete equations is obtained when calculating the multiphase flow water and thermal coupling model:
where Rnk,k+1 is the residual error. In the initial version of TOUGH2, Newton-Raphson iteration method was used, while for the pathological equation, the multiple iteration methods was added in the model including preconditioned conjugate gradient method in actual complex problems. In addition, TOUGH2 provides automatic adjustment time steps according to the convergence speed of the iteration process according to the complexity of multiphase flow.
To verify the accuracy of the model, the temperature change was simulated and compared with the measured data to analyze the fitting degree, and thermal physical parameters of porous medium are shown in Table 2.
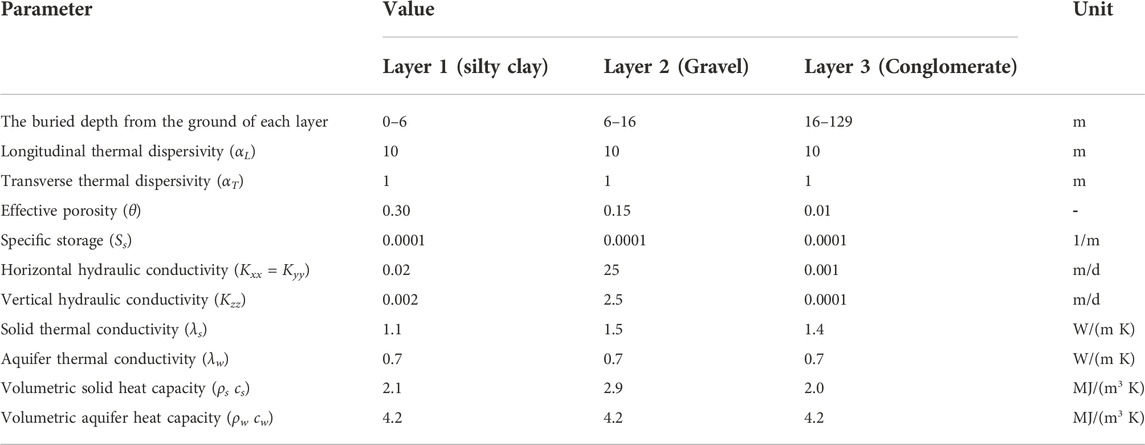
TABLE 2. Hydrogeological and physical properties implemented in the model.
In the study, the root mean square error (RMSE) was used as a fitness criterion to estimate the quality of fit (Luo et al., 2014; Wagner et al., 2012).
where Mi is the measured value, Si is the simulated value, n is the number of measurements.
In order to verify the accuracy of the model, the temperature change was simulated and compared with the measured data in 2011 to analyze the goodness of fit. The model verification results are shown in Table 3, Table 4, and Figure 5.
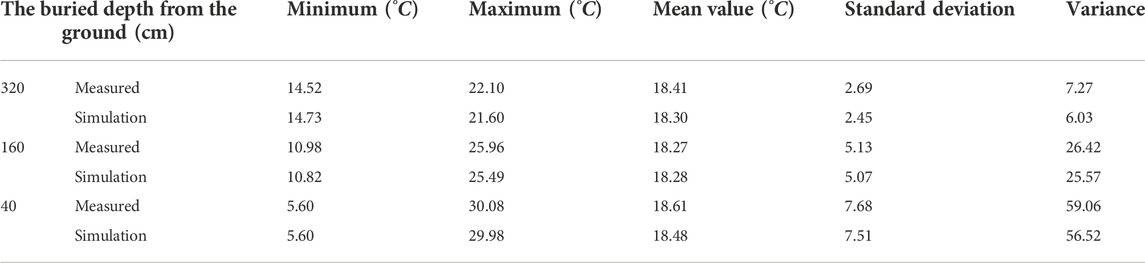
TABLE 3. The summary of fitting results between simulation and measured data.
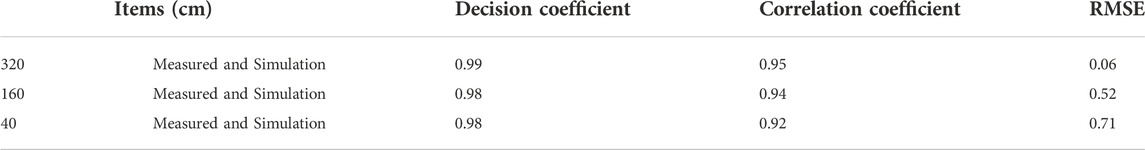
TABLE 4. The goodness of fit checklist.
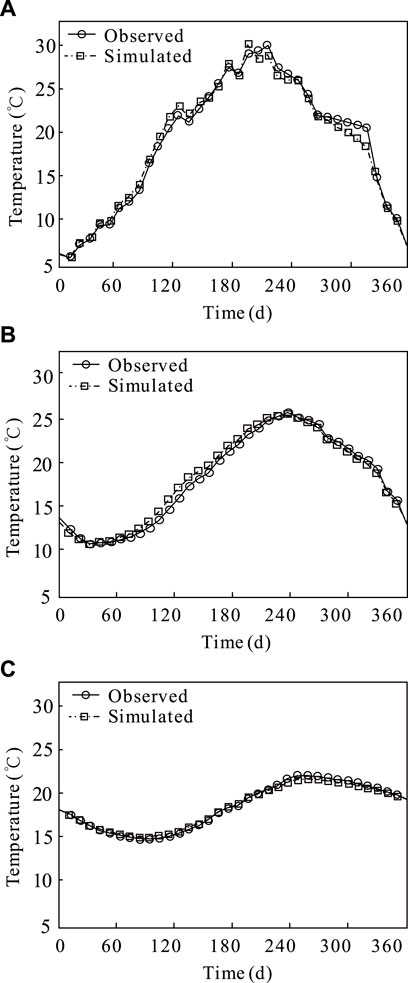
FIGURE 5. Fitting diagram of measured data and simulated data. (A) the buried depth is 40 cm, (B) the buried depth is 160 cm and (C) the buried depth is 320 cm.
As shown in Figure 5, the temperature variation is greatly influenced by the atmospheric temperature, and the maximum temperature variation is about 26°C at a depth of 40 cm, while that value is 15°C at a depth of 160 cm, and the maximum temperature variation in the soil decreases to 8°C, with the highest temperature at 260 days at a depth of 320 cm.
From Table 4, the results show that the average absolute error between the numerical simulation results and the actual situation is not greater than 0.71°C, and the acceptable error is estimated to be 3.8% of the measured values (Sheldon et al., 2015), and the model is consistent with the actual situation. Relatively speaking, the variation range of measured values is slightly larger than the simulation results, which may largely be due to the surrounding artificial influence.
According to the actual meteorological characteristics of Jingxian county, the simulation period is set as 1 year, followed by 60 days of heating period in winter, 90 days of intermittent period, 120 days of cooling period in summer, and 90 days of intermittent period. In the process of engineering operation, the designed single well pumping rate and recharging rate are 30 m3/h and 15 m3/h, and the number of pumping well and recharging well are 8 and 16, respectively.
The reinjection constant temperature was 33°C in the summer cooling period and 6°C in the winter heating period. The TOUGH2 software is used for simulation. It is assumed that the GWSHP system operates for 24 h per day normally throughout the simulation period. According to the analysis of the temperature change of the aquifer near the mining well, which are shown in Figure 6, the temperature of the aquifer near the reinjection well decreases rapidly in winter, and the downward trend gradually slows down around 40 days with stabilizing at about 7°C, while the temperature near the reinjection well rises rapidly and gradually becomes stable around 200 days, with the maximum temperature of about 30°C. For the aquifer near the pumping well, the thermal penetration occurs due to the influence of flow field. The temperature of the aquifer near the pumping well decreases to 15°C in winter and increases to 24°C in summer. The trend of temperature change in reinjection well is similar to that near the pumping well, and the occurrence time of the lowest temperature and the highest temperature are basically the same to that near the pumping well.
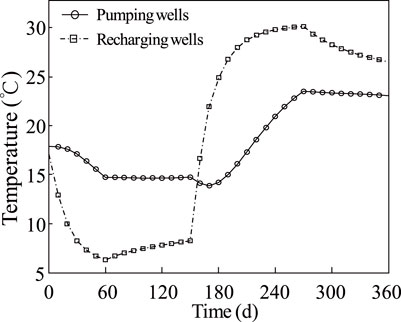
FIGURE 6. Process line of aquifer temperature change near mining well of GWSHP.
At the end of the heating period, a local water level drawdown funnel is formed near the pumping well. The range of water level drawdown is about 1 km2, and the influence range of drawdown greater than 1 m is 0.2 km2. The maximum drawdown near the center of the pumping well is about 3.5 m. Correspondingly, a local water level rise area is formed near the recharge well. The range of water level rise area is about 0.3 km2, and the influence range of water level rise greater than 1 m is about 0.1 km2. The maximum value of water level appreciation near the recharge center is about 2.6 m in Figure 7A. At the end of the cooling period, the maximum influence range of water level is about 1 km2, the influence range of water level drawdown greater than 1 m is 0.2 km2, and the maximum drawdown near the center of the pumping well is about 3.5 m. The local water level rise range near the recharge well is about 0.4 km2, and the influence range of water level rise greater than 1 m is about 0.1 km2. The maximum value of water level rise in the center of the recharge well is about 2.9 m in Figure 7B. The change rule of water head in cooling period and heating period is consistent.
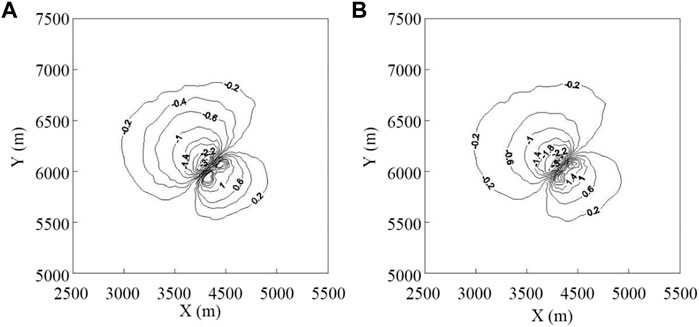
FIGURE 7. Water head change contour map of water source project. (A) the end of the heating period, (B) the end of cooling period.
Figure 8 is the contour maps of aquifer temperature change at the end of heating period and cooling period of water source engineering, respectively. At the end of the winter heating period, heat breakthrough occurs near the pumping well, the water temperature in the center of the pumping well decreases about 3°C, and the influence range is about 0.3 km2 when the falling temperature is greater than 1°C. At the end of the summer cooling period, due to the operation of the cooling period for 4 months, the heat accumulation effect of the recharge is more obvious, which is manifested in the greater range of temperature change, and the range of temperature influence is expanded compared with the heating period. The thermal breakthrough occurred near the pumping well, and the water temperature in the center of the pumping well increases about 5°C, and the influence range is also about 0.3 km2 when the rising temperature is greater than 1°C in the mining area.
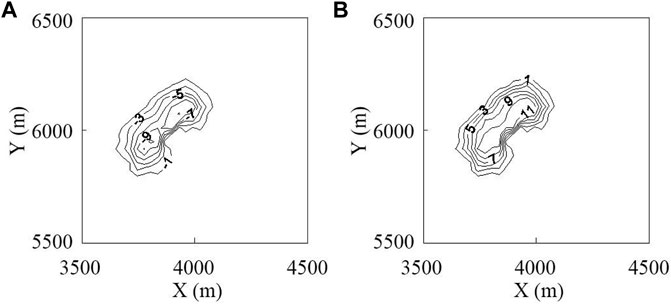
FIGURE 8. Isoline diagram of aquifer temperature change. (A) the end of the heating period, (B) the end of cooling period.
Figure 9 shows the isolines of temperature change of buried depth 80 cm, 160 cm and 320 cm. It can be seen that the influence of GWSHP on the unsaturated zone of shallow aquifer mainly depends on the temperature gradient of the system. In the cooling period and heating period, the temperature of the unsaturated zone changes with the change of the aquifer temperature. However, the temperature change rapidly decayed below 0.5°C at the depth of 80 cm. Therefore, the influence of GWSHP is small on the aeration zone in Jingxian county, and it can return to normal temperature in the intermittent period, which will not affect agricultural production.
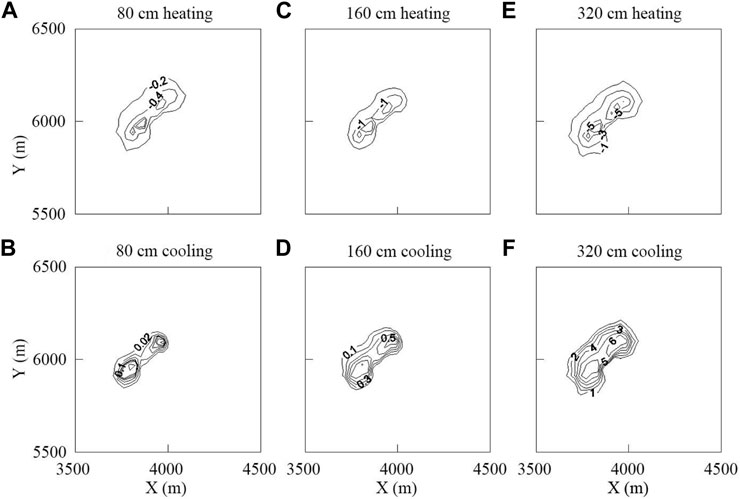
FIGURE 9. Temperature change contour map of buried depth at the end of heating period and cooling period, (A) and (B) are at the -80 cm depth, (C) and (D) are at the -160 cm depth, (E) and (F) are at the -320 cm depth.
The model is used to simulate the GWSHP system in shallow aquifers, the hydrogeological and groundwater velocity are analyzed. Since the cooling period was 4 months, the heat accumulation effect is more obvious caused by reinjection (Luo et al., 2015), which is manifested in the larger range of temperature change, and the range of temperature influence is expanded compared with the heating period. In addition, according to the exciting research, for velocities equal to 10−6 m/s and larger, an important increase in the exchanged energy with respect to the null velocity. The increase is generally nonlinear, and the extracted heat increases more than the injected heat in the first year. While for velocities equal to 10−6 m/s and larger, the second year data are almost coincident with the first year (Angelotti et al., 2014). Considering the thermal penetration phenomenon, the GWSHP must increase the amount of pumping and irrigation, but due to the actual site conditions limit requirements, the region can not meet the greater water demand, so it is necessary to increase the auxiliary cold and heat sources to make the air conditioning system stable operation.
For the groundwater, with a certain temperature, the required total pumping rate for the GWSHP system was established according to Eq. 12 (Al-Zyoud et al., 2014). Take the summer cooling conditions as an example:
where Qp is the pumping rate (m3/s); Qh is the heating load (W), cw is the volumetric heat capacity of groundwater (J/kg °C), ρw is the groundwater density (kg/m3), Tr is the recharging water temperature (°C), Tp is the pumping water temperature (°C).
In the actual site. The main factors affecting the water demand of the GWSHP are the required cooling and heating load, the input power of the unit and the temperature difference of the groundwater. For a certain building load, the required groundwater pumping rate is:
where Qps and Qpw are the pumping rate in summer and winter, Qhs and Qhw are the designed load value in summer and winter, QTs and QTw are the input power value in summer and winter, Trs and Trw are the recharging water temperature in summer and winter, Tps and Tpw are the pumping water temperature in summer and winter, kh is the unit heat conversion coefficient, and kh = 3600/4187 in the study case, n is the number of heat pump units.
For the actual case study, GWSHP parameters in different conditions are shown in Table 3, the design cooling load and heating load are 5508 KW an and 3948 kW, respectively. In addition, two heat pump units are in operation. According to the heat pump type, the cooling capacity and rated power are 1854 KW and 316 KW in summer, the heating capacity and rated power are 2032 KW and 435 KW in winter, respectively. The annual coefficient of performance (ACOP) is 5.57. The groundwater temperature difference is 12°C in winter and 15°C in summer. According to Eq. 13 and Table 5, Qps = 249 (m3/h) and Qpw = 229 (m3/h).
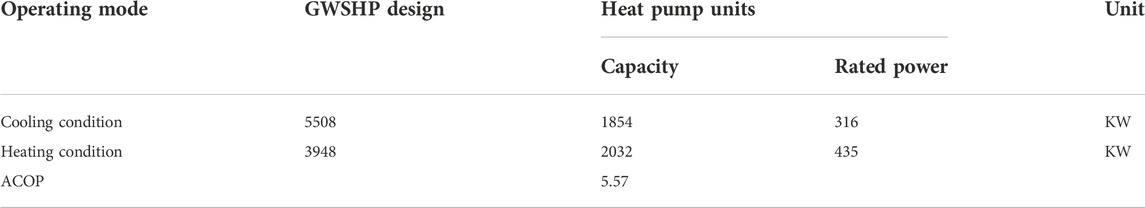
TABLE 5. GWSHP parameters in different conditions.
According to the pumping test, the maximum groundwater pumping rate of the pumping well is 30–40 m3/h under the condition of 100% reinjection. In actual operation, the groundwater pumping rate of the pumping well is 30 m3/h and the reinjection volume is 15 m3/h. Therefore, the number of pumping wells is 8 and the number of reinjection wells is 16. In conclusion, the design water consumption is 229 m3/h, which is reasonable. In addition, the target study layer has good permeability and the buried depth of groundwater static water level is about 4.5 m underxmining conditions, which can be used by pipe well vacuum recharge. It is assumed that the GWSHP runs normally for 24 h every day during the whole simulation period, the recharge temperature in the summer cooling period was 33°C, and that in the winter heating period was 6°C considering the most unfavorable situation. Finally, this project intends to take winter heating water demand as the maximum water demand of the system, and increase the single cooler to balance the insufficient cooling capacity in summer, the rated power of single cooler can be selected as 1839 KW for the building demand.
In general cases, in the summer cooling and winter heating time under the mid-latitude area as Anhui, the highest return water temperature allowed is 33°C and that the lowest is 6°C, respectively, and the temperature of groundwater is generally 18°C. Moreover, in the same working conditions, it would be a shortage of system design water capability, when the groundwater temperature changes in a certain range. Groundwater temperature increases in summer, while reduces in winter, it is a contrast to the heat pump system requirements.
From the above model to calculate the annual change of average temperature of the aquifer, the average groundwater temperature ranges between 16.88°C and 18.74°C based on the groundwater level and dynamic monitoring data, which is shown in Table 6 and Figure10.

TABLE 6. The comprehensive table of the target aquifer simulation results.
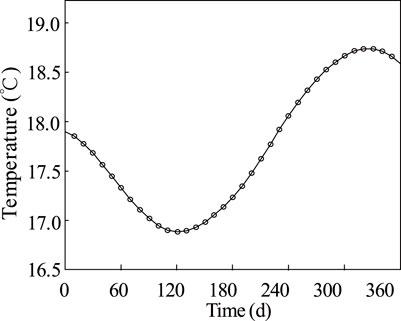
FIGURE 10. Simulation process curve of average temperature of target aquifer.
In Table 6 and Figure10, it is clearly shown that the annual change of average temperature of the aquifer between 16.88°C and 18.74°C, that is, it is reasonable to choose 18°C as the design groundwater temperature of the GWSHP system with actual site conditions, and the specific design calculation is described below in detail.
Comparing actual groundwater temperature T to the design value (in this case taking Td = 18°C), there is a temperature difference △T (△Ts in summer, while △Tw in winter). The relationship between the proportion of water demand increment and the variation amplitude of groundwater temperature can be used δs in summer and δw in winter represents, respectively.
According to Eq. 14, there is a positive correlation between the variation amplitude of groundwater temperature and the increment proportion of water required by the system, and the relationship is shown in Figure 11.
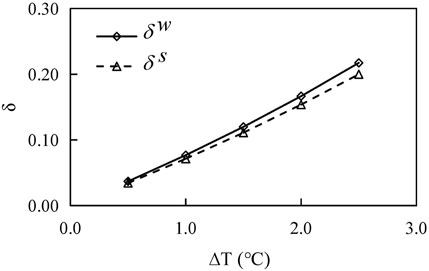
FIGURE 11. Relationship curve between the variation amplitude of groundwater temperature and the increment proportion of water required by the system.
From Figure 11, it is a reliable linear relationship between △Ts and δs, △Tw, and δw, respectively, thus, the increment of water requirement can be judged by the variation of groundwater temperature in winter and summer, in addition, it is reliable to determine the influence of system mining scheme by δs and δw. In southern China, the surface water system is developed, and the depth and flow of rivers are generally large. The annual rainfall is concentrated in summer, and the river water level is relatively high during the cooling period. Generally, the first layer is sandy loam or clay, and the second layer is sand or gravel, so the hydraulic conductivity of the aquifer near the river is relatively large, and the extracted heat increases more than the injected heat in the first year, thus, GWSHP can take the heating water demand in winter as the maximum water demand of the system, and the single cooler is added to balance the insufficient cooling capacity in summer.
Through the above research, the GWSHP system in a specific area near the river may be a better choice compared with the surface water source heat pump system (Xiao et al., 2006), because the water temperature is relatively stable and the water quantity is abundant. In addition, when the water level of the river is high, the GWSHP system will not affect the river temperature. Considering cities built along rivers, the requirements for cooling load or heating load are very high. Therefore, the method proposed can be widely used in areas near rivers in southern China.
In this paper, the hydrothermal migration of shallow aquifer under the influence of the atmospheric environment is simulated based on the mechanism of hydrothermal migration, and the influence of seasonal changes in the atmospheric environment on the temperature field of the shallow aquifer is analyzed. In addition, the numerical simulation model is established by relying on the experimental base of the GWSHP which is constructed on the first terrace of Qingyi River. Moreover, the impact of the dynamic change of groundwater temperature on the mining scheme design and system operation of the GWSHP is studied. Through the research, this paper draws the following conclusions:
1) The shallow groundwater temperature is similar to the atmospheric temperature and changes periodically. In the geothermal field of shallow aquifer, the amplitude of groundwater temperature affected by the atmospheric temperature decreases with the increase of buried depth and the decrease of groundwater vertical flow velocity.
2) The operation of the GWSHP has a certain range of influence on the groundwater flow field and temperature field in the experimental study area. The maximum influence range on the groundwater level is about 1 km2, and the maximum range is about 0.3 km2 when the temperature variation is greater than 1°C. The phenomenon of heat penetration occurs near the pumping well at the end of the heating period, moreover, at the end of the cooling period, there is an obvious heat accumulation effect near the reinjection well.
3) The actual observed dynamic variation range of groundwater temperature deviates slightly from the design value, which will inevitably affect the design water volume of the GWSHP. In the future design of the GWSHP, the influence of groundwater temperature change on the design water volume in the system should be considered to optimize the design scheme.
4) The groundwater temperature dynamic variation should be considered as a constraint condition to judge the performance of the GWSHP. To avoid the occurrence of heat penetration, the sensitivity analysis can be implemented to decrease the risk of freezing in case of changing conditions (thermal plumes, asphalt, buildings, and various structures).
5) A large number of hydrogeological data are needed to establish the numerical model, to simulate the hydrothermal coupling process more accurately, it is necessary to consider the time variation and spatial variability of parameters, which requires further geological exploration and data collection to improve the accuracy of simulation results. The results of the research process and numerical model can provide a reference for the design of the GWSHP system in the shallow and thin aquifers near rivers.
The original contributions presented in the study are included in the article/supplementary material, further inquiries can be directed to the corresponding author.
FL and HR: software, methodology, data curation, validation, conceptualization, methodology, writing–original draft, review and editing. TW: investigation and visualization. YT and YL: funding acquisition and project administration. JY: data curation, validation and investigation.
This work was supported by the National Key Research and Development Program of China (No. 2018YFC1802700); the Open Research Fund Program of State key Laboratory of Hydroscience and Engineering, Tsinghua University (No. sklhse-2020-D-06); the National Natural Science Foundation of China (No. 42107162); the Natural Science Foundation of Anhui Province (No. 1908085QD168) and the Fundamental Research Funds for the Central Universities of China (No. PA2021 KCPY0055).
The authors declare that the research was conducted in the absence of any commercial or financial relationships that could be construed as a potential conflict of interest.
All claims expressed in this article are solely those of the authors and do not necessarily represent those of their affiliated organizations, or those of the publisher, the editors and the reviewers. Any product that may be evaluated in this article, or claim that may be made by its manufacturer, is not guaranteed or endorsed by the publisher.
Al-Zyoud, S., Rühaak, W., and Sass, I. (2014). Dynamic numerical modeling of the usage of groundwater for cooling in north east Jordan - a geothermal case study. Renew. Energy 62, 63–72. doi:10.1016/j.renene.2013.06.027
Alberti, L., Angelotti, A., Antelmi, M., and La Licata, I. (2017). A numerical study on the impact of grouting material on borehole heat exchangers performance in aquifers. Energies 10 (5), 703. doi:10.3390/en10050703
Alberti, L., Angelotti, A., Antelmi, M., and Licata, I. L. (2016). Borehole Heat Exchangers in aquifers: simulation of the grout material impact. Rendiconti Online Società Geologica Italiana 41, 268–271. doi:10.3301/ROL.2016.145
Alcaraz, M., García-Gil, A., Vázquez-Suñé, E., and Velasco, V. (2016). Advection and dispersion heat transport mechanisms in the quantification of shallow geothermal resources and associated environmental impacts. Sci. Total Environ. 543, 536–546. doi:10.1016/j.scitotenv.2015.11.022
Angelotti, A., Alberti, L., La Licata, I., and Antelmi, M. (2014). Borehole Heat Exchangers: Heat transfer simulation in the presence of a groundwater flow. J. Phys. Conf. Ser. 501, 012033. doi:10.1088/1742-6596/501/1/012033
Antelmi, M., Alberti, L., Angelotti, A., Curnis, S., Zille, A., and Colombo, L. (2020). Thermal and hydrogeological aquifers characterization by coupling depth-resolved thermal response test with moving line source analysis. Energy Convers. Manag. 225, 113400. doi:10.1016/j.enconman.2020.113400
Antelmi, M., Alberti, L., Barbieri, S., and Panday, S. (2021). Simulation of thermal perturbation in groundwater caused by Borehole Heat Exchangers using an adapted CLN package of MODFLOW-USG. J. Hydrology 596, 126106. doi:10.1016/j.jhydrol.2021.126106
Bear, J. (1972). Dynamics of fluids in porous media. New York, U.S.: American Elsevier Publishing Company, inc.
Bredehoeft, J. D., and Papaopulos, I. S. (1965). Rates of vertical groundwater movement estimated from the Earth's thermal profile. Water Resour. Res. 1 (2), 325–328. doi:10.1029/WR001i002p00325
Chounet, L. M., Hilhorst, D., Jouron, C., Kelanemer, Y., and Nicolas, P. (1999). Simulation of water flow and heat transfer in soils by means of a mixed finite element method. Adv. Water Resour. 22 (5), 445–460. doi:10.1016/s0309-1708(98)00029-3
De Vries, D. A. (1958). Simultaneous transfer of heat and moisture in porous media. Trans. AGU 39 (5), 909–916. doi:10.1029/tr039i005p00909
Domenico, P. A., and Schwartz, F. W. (1998). TOUGH2 user's guide. New York, U.S.Berkeley, CA: John Wiley and Sons, inc. Finsterle, S. Lawrence Berkeley National Laboratory Report LBNL.Physical and chemical hydrogeology.
García-Gil, A., Epting, J., Ayora, C., Garrido, E., Vázquez-Suñé, E. V., and Huggenberger, P. (2016). A reactive transport model for the quantification of risks induced by groundwater heat pump systems in urban aquifers. J. Hydrol. X. 542, 719–730. doi:10.1016/j.jhydrol.2016.09.042
Horton, R., and Wierenga, P. J. (1984). The effect of column wetting on soil thermal conductivity. Soil Sci. 138 (2), 102–108. doi:10.1097/00010694-198408000-00002
Ing Eb Ritsen, S. E., and Sanford, W. E. (1998). Groundwater in geologic processes. Cambridge, U.K.: Cambridge University Press.
Ismail, M., Yebiyo, M., and Chaer, I. (2021). A review of recent advances in emerging alternative heating and cooling technologies. Energies 14 (2), 502. doi:10.3390/en14020502
Kay, B., D., and Groenevelt, P. H. (1974). On the interaction of water and heat transport in frozen and unfrozen soils: I. Basic theory; the vapor phase. Soil Sci. Soc. Am. J. 38 (3), 395–400. doi:10.2136/sssaj1974.03615995003800030011x
Lien, H. P., and Wittmann, F. H. (1995). Coupled heat and mass transfer in concrete elements at elevated temperatures. Nucl. Eng. Des. 156 (1-2), 109–119. doi:10.1016/0029-5493(94)00938-u
Lubryka, E., and Malecha, Z. M. (2017a). The numerical boundary conditions of the wrapping pattern of thin insulation. Int. J. Heat. Mass Transf. 108, 512–518. doi:10.1016/j.ijheatmasstransfer.2016.12.050
Lubryka, E., and Malecha, Z. M. (2017b). The numerical boundary conditions of the wrapping pattern of thin insulation. Int. J. Heat. Mass Transf. 108, 512–518. doi:10.1016/j.ijheatmasstransfer.2016.12.050
Luo, J., Rohn, J., Bayer, M., Priess, A., and Xiang, W. (2014). Analysis on performance of borehole heat exchanger in a layered subsurface. Appl. Energy 123, 55–65. doi:10.1016/j.apenergy.2014.02.044
Luo, Z., Wang, Y., Zhou, S., and Wu, X. (2015). Simulation and prediction of conditions for effective development of shallow geothermal energy. Appl. Therm. Eng. 91, 370–376. doi:10.1016/j.applthermaleng.2015.08.028
Malecha, Z. M., and Malecha, K. (2014). Numerical analysis of mixing under low and high frequency pulsations at serpentine micromixers. Chem. Process Eng. 35 (3), 369–385. doi:10.2478/cpe-2014-0028
Masciale, R., Carlo, L. D., and Caputo, M. C. (2015). Impact of a very low enthalpy plant on a costal aquifer: A case study in southern Italy. Environ. Earth Sci. 74 (3), 2093–2104. doi:10.1007/s12665-015-4193-1
Mercer, J. W., Faust, C. R., Miller, W. J., and Jr, F. (1982). Review of simulation techniques for aquifer thermal energy storage (ATES). Adv. Hydrosci. 13 (6), 1–129. doi:10.1016/b978-0-12-021813-4.50007-x
Mukhtar, M., Ameyaw, B., Yimen, N., Zhang, Q., Bamisile, O., Adun, H., et al. (2021). Building retrofit and energy conservation/efficiency review: A techno-environ-economic assessment of heat pump system retrofit in housing stock. Sustainability 13 (2), 983. doi:10.3390/su13020983
Norio, T., Kasumi, Y., and George, Z. (2003). Model study of the thermal storage system by FEHM code. Geothermics 32 (4), 603–607. doi:10.1016/s0375-6505(03)00073-7
Park, B. H., Bae, G. O., and Lee, K. K. (2015). Importance of thermal dispersivity in designing groundwater heat pump (GWHP) system: Field and numerical study. Renew. Energy 83 (9), 270–279. doi:10.1016/j.renene.2015.04.036
Philip, J., R. (1957). Evaporation and moisture and heat fields in the soil. J. Meteor. 14 (4), 354–366. doi:10.1175/1520-0469(1957)014<0354:eamahf>2.0.co;2
Philip, J. R., and De Vries, D. A. (1957). Moisture movement in porous materials under temperature gradients. Trans. AGU. 38 (2), 222–232. doi:10.1029/tr038i002p00222
Pruess, K., Oldenburg, C. M., and Moridis, G. J. (1999). TOUGH2 user's guide. Berkeley, U,S.: Lawrence Berkeley National Laboratory.
Ramos, E. P., Breede, K., and Falcone, G. (2015). Geothermal heat recovery from abandoned mines: A systematic review of projects implemented worldwide and a methodology for screening new projects. Environ. Earth Sci. 73 (11), 6783–6795. doi:10.1007/s12665-015-4285-y
Recep, Y., Mehmet, K., Ali, B., and Mehmet, Ş. B. (2004). Computational model for a ground coupled space cooling system with an underground energy storage tank. Energy & Build. 37 (4), 353–360.
Russo, S. L., Taddia, G., Dabove, P., Abdin, E. C., and Manzino, A. M. (2018). Effectiveness of time-series analysis for thermal plume propagation assessment in an open-loop groundwater heat pump plant. Environ. Earth Sci. 77 (18), 641–647.
Schneider, E., García-Gil, A., Vázquez-Suè, E., and Sánchez-Navarro, J. (2016). Geochemical impacts of groundwater heat pump systems in an urban alluvial aquifer with evaporitic bedrock. Sci. Total Environ. 544, 354–368. doi:10.1016/j.scitotenv.2015.11.096
Sheldon, H. A., Schaubs, P. M., Rachakonda, P. K., Trefry, M. G., Reid, L. B., Lester, D. R., et al. (2015). Groundwater cooling of a supercomputer in Perth, Western Australia: Hydrogeological simulations and thermal sustainability. Hydrogeol. J. 23 (8), 1831–1849. doi:10.1007/s10040-015-1280-z
Shrestha, G., Uchida, Y., Kuronuma, S., Yamaya, M., Yoshioka, M., Kaneko, S., et al. (2017). Performance evaluation of a ground-source heat pump system utilizing a flowing well and estimation of suitable areas for its installation in Aizu Basin, Japan. Hydrogeol. J. 25 (5), 1437–1450. doi:10.1007/s10040-017-1536-x
Shu, L., Rui, X., Wen, Z., Tao, Y., and Liu, P. (2017). Impact of boundary conditions on a groundwater heat pump system design in a shallow and thin aquifer near the river. Sustainability 9 (5), 797. doi:10.3390/su9050797
Stephen, E. S., Jose, R., and Raye, L. M. (1995). Quantifying downflow through creek sediments using temperature time series: One-dimensional solution incorporating measured surface temperature. J. Hydrol. X. 167 (1-4), 99–119. doi:10.1016/0022-1694(94)02613-g
Sterling, A. T., and Gordon, L. S. (1960). Some thermodynamic properties of soil water. Soil Sci. Soc. Am. J. 24 (4), 243–247. doi:10.2136/sssaj1960.03615995002400040010x
Suzuki, Seitaro. (1960). Percolation measurements based on heat flow through soil with special reference to paddy fields. J. Geophys. Res. 65 (9), 2883–2885. doi:10.1029/jz065i009p02883
Ucar, A., and Inalli, M. (2005). Thermal and economical analysis of a central solar heating system with underground seasonal storage in Turkey. Renew. Energy 30 (7), 1005–1019. doi:10.1016/j.renene.2004.09.015
Wagner, V., Bayer, P., Kübert, M., and Blum, P. (2012). Numerical sensitivity study of thermal response tests. Renew. Energy 41, 245–253. doi:10.1016/j.renene.2011.11.001
Wei, W. S. (2010). Shallow geothermal resources in China. Beijing, China: China Land Publishing Press.
Xiao, C., Zhang, G., Peng, J., Lin, X., and Liu, T. (2006). The performance of an open-loop lake water heat pump system in south China. Appl. Therm. Eng. 26 (17-18), 2255–2261. doi:10.1016/j.applthermaleng.2006.03.009
Zhang, K., Wu, Y. S., and Bodvarsson, G. S. (2003). Parallel computing simulation of fluid flow in the unsaturated zone of Yucca Mountain, Nevada. J. Contam. Hydrol. 62, 381–399. doi:10.1016/s0169-7722(02)00159-6
Zhou, X., Gao, Q., Chen, X., Yan, Y., and Spitler, J. D. (2015). Developmental status and challenges of GWHP and ATES in China. Renew. Sustain. Energy Rev. 42, 973–985. doi:10.1016/j.rser.2014.10.079
Keywords: groundwater source heat pump, shallow aquifer, geothermal dynamic variety, numerical simulation, thermal penetration, constraint condition
Citation: Lin F, Ren H, Wei T, Tao Y, Li Y and Yang J (2023) Geothermal dynamic constraints of groundwater source heat pump system in shallow aquifers. Front. Energy Res. 10:928125. doi: 10.3389/fenrg.2022.928125
Received: 25 April 2022; Accepted: 26 July 2022;
Published: 06 January 2023.
Edited by:
Jingyang Fang, Shandong University, ChinaReviewed by:
Longcang Shu, Hohai University, ChinaCopyright © 2023 Lin, Ren, Wei, Tao, Li and Yang. This is an open-access article distributed under the terms of the Creative Commons Attribution License (CC BY). The use, distribution or reproduction in other forums is permitted, provided the original author(s) and the copyright owner(s) are credited and that the original publication in this journal is cited, in accordance with accepted academic practice. No use, distribution or reproduction is permitted which does not comply with these terms.
*Correspondence: Jie Yang, eWFuZ2ppZTYzNjNAMTYzLmNvbQ==
Disclaimer: All claims expressed in this article are solely those of the authors and do not necessarily represent those of their affiliated organizations, or those of the publisher, the editors and the reviewers. Any product that may be evaluated in this article or claim that may be made by its manufacturer is not guaranteed or endorsed by the publisher.
Research integrity at Frontiers
Learn more about the work of our research integrity team to safeguard the quality of each article we publish.