 Joshuva Arockia Dhanraj1
 Rami S. Alkhawaldeh2
 Pham Van De3
 V. Sugumaran4Najabat Ali5
 Natrayan Lakshmaiya6
 Prem Kumar Chaurasiya7Priyadharsini S.8
 Karthikeyan Velmurugan9,10Md Shahariar Chowdhury11Sittiporn Channumsin12*Suwat Sreesawet12H. Fayaz13
- 1Centre for Automation and Robotics (ANRO), Department of Mechatronics Engineering, Hindustan Institute of Technology and Science, Chennai, Tamil Nadu, India
- 2Department of Computer Information Systems, The University of Jordan, Aqaba, Jordan
- 3Faculty of Technology, Dong Nai Technology University, Biên Hòa, Vietnam
- 4School of Mechanical Engineering, Vellore Institute of Technology, Chennai, India
- 5Jiangsu University, School of Finance and Economics, Zhenjiang, China
- 6Department of Mechanical Engineering, Saveetha School of Engineering, Saveetha Institute of Medical and Technical Sciences, Chennai, India
- 7Department of Mechanical Engineering, Bansal Institute of Science and Technology, Bhopal, Madhya Pradesh, India
- 8Department of Mechanical Engineering, Rajalakshmi Institute of Technology, Chennai, Tamil Nadu, India
- 9Center for Alternative Energy Research and Development, Khon Kaen University, Khon Kaen, Thailand
- 10Mechanical Engineering Division, Faculty of Engineering, Khon Kaen University, Khon Kaen, Thailand
- 11Faculty of Environmental Management, Prince of Songkla University, Hat Yai, Thailand
- 12Space Technology Research Center, Geo-Informatics and Space Technology Development Agency (GISTDA), Chon Buri, Thailand
- 13Modeling Evolutionary Algorithms Simulation and Artificial Intelligence, Faculty of Electrical & Electronics Engineering, Ton Duc Thang University, Ho Chi Minh City, Vietnam
Wind energy is one of nature’s most valuable green energy assets, as well as one of the most reliable renewable energy supplies. Wind turbine blades convert wind energy into electric energy. Wind turbine blades range in size from 25 to 120 m, depending on the demands and efficiency necessary. Owing to ambient influences and wide structures, the blades are subject to various friction forces that might harm the blades. As a result, the generation of power and the shutdown of turbines are both affected. Downtimes are reduced when blades are detected on a regular basis, according to structural health management. On the 50-W, 12-V wind turbine, this research investigates the use of vibration signals to anticipate deterioration. The machine learning (ML) method establishes a nonlinear relationship between selected important damage features and the related uniqueness measures. The learning algorithm was trained and tested based on the excellent state of the edge. To forecast blade faults, classifier models, such as naive Bayes (NB), multilayer perceptron (MLP), linear support vector machine (linear_SVM), one-deep convolutional neural network (1DCNN), bagging, random forest (RF), XGBoosts, and decision tree J48 (DT) were used, and the results were compared according to their parameters to propose a better fault diagnostics model.
1 Introduction
In past decades, owing to the extreme overconsumption of fossil energies, climate change and global warming have emerged as a problem for all people. This encourages the research and development of renewable energies. As stated by the Energy Information Administration (EIA), renewable energy is a natural reservoir with a limited supply of energy (Baratsas et al., 2021). This energy comprises wind, bioenergy, solar, nuclear sources, geothermal, and water. Renewable energy advantages include no emissions of greenhouse gases, a reduction in air pollution, energy market diversity, and acceleration of economic growth in comparison with traditional energy sources. In recent times, wind power consumption ranked first among all alternative energies on the basis of the global energy consumption by energy source (Ren et al., 2021). Figure 1 shows the overall wind power generation around the world. A considerable number of wind turbines (WTs) have been developed and deployed with the accelerated growth of wind power innovation. The aerodynamic force from the rotor blades is the vital component for transforming wind energy into electrical energy (Gao et al., 2021). Figure 2 shows the countries using wind power as a primary energy source, and Figure 3 shows the installed wind energy capacity in important countries, such as the United States, Germany, India, Spain, the United Kingdom, Italy, Australia, Japan, and the Middle East.
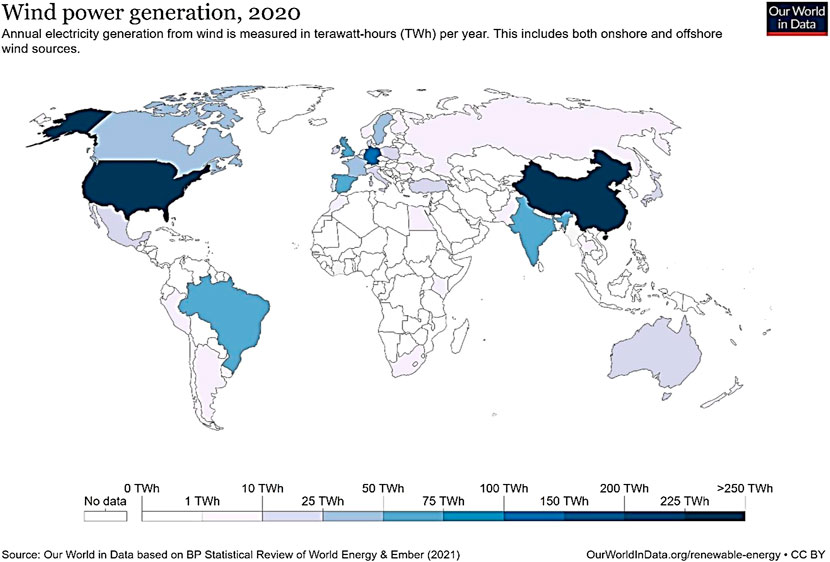
FIGURE 1. Overall wind power generation (https://ourworldindata.org/renewable-energy).

FIGURE 2. Countries using wind power as primary energy source (https://ourworldindata.org/renewable-energy).

FIGURE 3. Installed wind energy capacity (https://ourworldindata.org/renewable-energy).
As per the reports, 25%–30% of the overall wind power generation expenses were covered by operating and maintenance costs (Astolfi, 2021). However, its stability impacts device efficiency and power production overall, which leads to increased expenses and decreased turnover, which leads to a reduction in their life cycle. Overlooked wind blade failures will wreck the whole WTs and even affect the adjacent constructions and injure human beings in the vicinity. Quick failure recognition and prompt diagnosis enhance the productivity of energy production and lower WT running costs (Joustra et al., 2021). Therefore, efficient inspection of WTs is necessary in order to improve energy usage and avoid associated consequences. Figure 4 shows the major failures in the WT system prone to the loss of wind energy production.
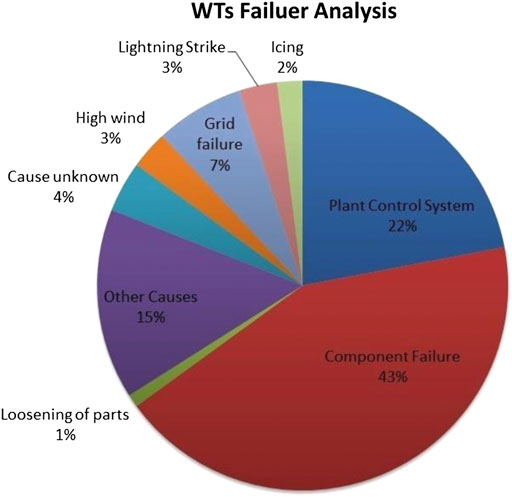
FIGURE 4. Major failures in wind turbine system (https://www.engineeringworldchannel.com/why-do-wind-turbines-fail/).
For the last several decades, the active field of research has been on a comprehensive study that has been undertaken in the data mining vibration-based failure diagnostics approach to track WTs structural health (Shankar Verma et al., 2021). At the minimum possible level of inspection, including damage monitoring, scientists often use artificial intelligence to recognize in the data observation collection conflicting anomalies that can be correlated to the presence of damage in the system. The nature of environmental and operational variability affecting the precise estimation of damage is one of the main problems in damage detection (Mishnaevsky et al., 2021). Several experiments have shown that external causes can mask the effects of failure in a structure and ultimately reduce its detection performance. In general, structures, such as WTs, are subject to extreme pressure by external influences, especially when positioned offshore (Astolfi et al., 2021). At present, wind turbine blades (WTBs) primarily depend on sensors to experiment on predictive maintenance and failure prognostics. In blade monitoring and fault detection testing, better results were obtained using accelerometers, acoustic detectors, ultrasound, and strain sensors Habibi et al. (2021).
Lin et al. (2021) has developed an radio-frequency identification (RFID)-based fiber Bragg grating (FBG) sensor management system for WTBs. The control system suggested applies RFID technology to FBG sensor blade tracking. The FBG WTB sensor is manufactured, designed, mounted, and maintained using an efficient digital control method. The analysis of an artificial neural network technique for damage recognition and demonstration on a working turbine blade was conducted by Movsessian et al. (2021). The artificial neural network (ANN) technique identifies the nonlinear relations between the chosen environmental and operational variability (EOV)-influenced damage sensitive features (DSFs) and their respective Mahalanobis distance (MD)-calculated novelty indices. The model of ANN regression is learned and tested according to a reference state. The learned model is used to simulate new findings in the subsequent MD. A modern novelty index for harm detection is used to estimate an error between the calculated and expected MDs. Soulier et al. (2021) performed research on the ability of the e-TellTale sensor strip to detect flow characteristics on the WTB with flow stall and hooking-up dynamics in a limited Reynolds number. This study demonstrates that the flow stable connection dynamics can be detected in WTBs. This sensor consists of a strip at the base of the gauge sensor. TR-PIV measures were used to acquire the velocity field over an oscillating 2D blade segment using an e-TellTale sensor. For detecting strip movement, images of the PIV were postprocessed according to flow movements.
Zhao et al. (2021) carried out studies on remote systemic health surveillance on the use of the Doppler short-distance WT. The simulation results show that the solution proposed can efficiently remove the parameters and detect complex horizontal-axis wind turbine (HAWT) defects. Moreover, actual onshore WTs are also used to test the approach suggested. Both findings show the possibility of using the radar sensor for the systemic health surveillance of horizontal-axis wind turbines (HAWTs) without interference. Yang et al. (2021) conducted a study on the image perception of damage to WTs using a deep learning model of transferring learning and a group learning classification. Unmanned aerial vehicle (UAV) photos of the WTB are used for testing the model’s performances. The model presented was better than the support vector machine (SVM), the fundamental deep learning model, and the deep learning model together with the ensemble learning methodology. Nielsen et al. (2021) conducted a case study with structural health monitoring (SHM) on the risk-based management of WTBs. The study demonstrates how the optimization of maintenance costs can be carried out using a risk-based approach taken in a Bayesian decision analysis context in which probabilistic models for blades and slurs and SHM systems were created. The research presents a parameter study showing how the potential advantage of SHM depends greatly on the efficiency of SHM and the use of SHM findings for inspection and maintenance decisions. The related works on wind turbine fault diagnosis using supervised classification algorithms are included in Table 1. This study makes an attempt to find five different blade fault conditions for increasing the wind energy production by applying an machine learning (ML) approach through statistical features. The contributions of the present study are as follows:
• This study considers five faults (blade crack, erosion, hub-blade loose connection, pitch angle twist, and blade bend) for WTB fault diagnosis.
• Mel-spectrogram, mel-frequency cepstral coefficients (MFCCs), chorma, and Tonnetz were used as feature processing techniques.
• This problem is modeled as a multiclass classification problem to identify the best approach to maximize wind energy production and attempts to classify the blade condition using naive Bayes (NB), multilayer perceptron (MLP), linear SVM (linear_SVM), one-deep convolutional neural network (1DCNN), bagging, random forest (RF), XGBoosts, and decision tree J48 (DT).
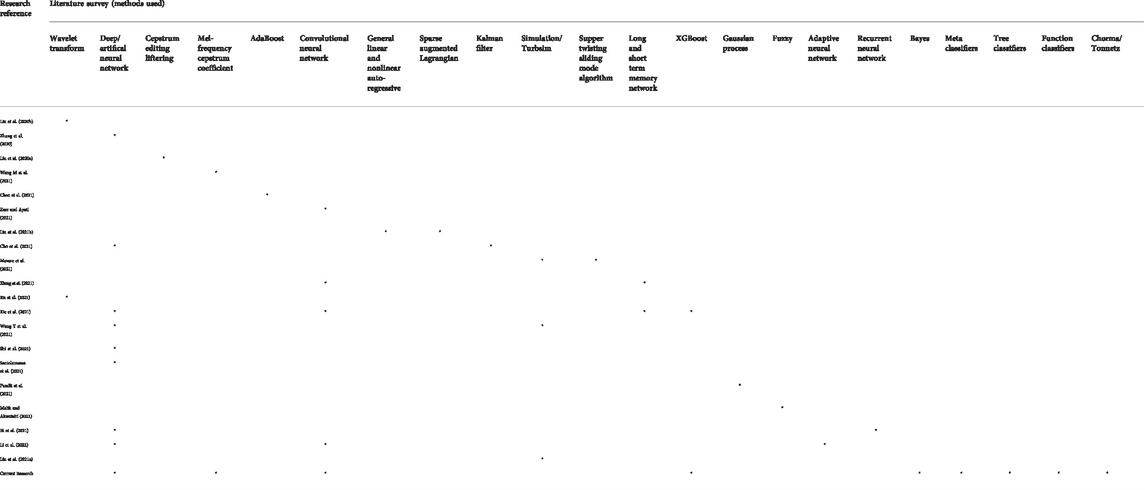
TABLE 1. Comparison of related studies on wind turbine using supervised learning algorithms.
The rest of the article is outlined as follows. Section 2 presents the discriminating blade fault conditions using ML techniques. In Section 3, experimental results and discussion are presented, followed by conclusion and future work in Section 4.
2 Discriminating blade fault conditions using machine learning techniques
Early detection of wind blade defects assists in increasing the performance of the productivity of energy production and reducing the WT running costs. As a result, constructing an effective model is an imperious need to diagnose the failures properly. The input data for ML models are the vibration signals that carry useful knowledge and provide an indication about the failure type. This framework consists of three phases: data acquisition, feature engineering and extraction, and classification learning techniques and evaluation. In general, the data acquisition phase generates vibration signals from the wind turbine and stores the results in a database. The feature engineering and extraction phase extracts the most relevant information from the generated signals as inputs for ML models. The classification learning techniques and evaluation phase exploits the input data with wind turbine failure as a class label for each record to build a classifier.
The experiment was carried out on a 50-W, 12-V variable small-scale micro wind turbine (MX-POWER, model: FP-50W-12V). The technical parameters of a wind turbine are given in Table 2. The wind turbine was mounted on a fixed steel stand in front of the open circuit wind tunnel outlet. The wind tunnel speed was varied from 5 to 15 m/s and acts as a wind source to start the wind turbine. Table 3 shows the technical parameters of the wind tunnel to create the wind supply. The wind speed varies continuously in order to simulate the environmental wind condition. The experimental setup is shown in Figure 5. Piezoelectric-type accelerometer was used as a transducer for acquiring vibration signals. It has high-frequency sensitivity for detecting faults. Hence, accelerometers are widely used in condition monitoring. In this case, a uniaxial accelerometer of 500-g range, 100-mV/g sensitivity, and resonant frequency of approximately 40 Hz was used. The piezoelectric accelerometer (DYTRAN 3055B1) was mounted on the nacelle near the wind turbine hub to record the vibration signals using an adhesive mounting technique. It was connected to the data acquisition (DAQ) system through a cable.
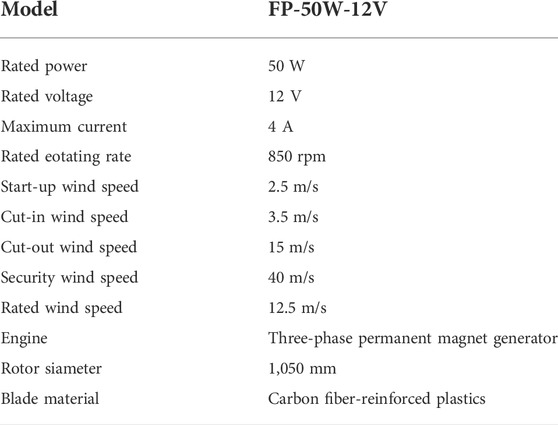
TABLE 2. Technical parameters of the wind turbine.
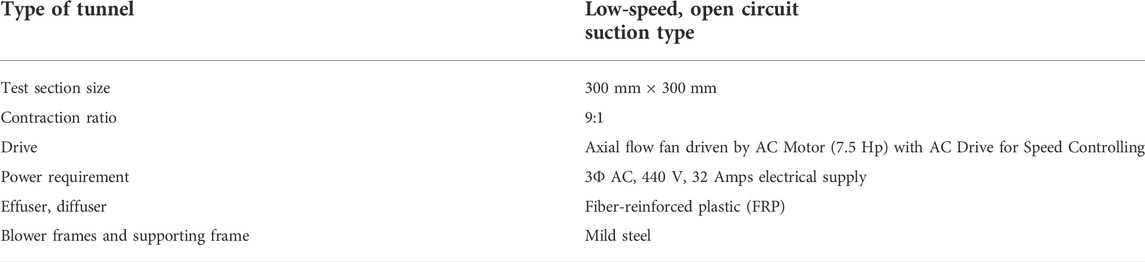
TABLE 3. Technical parameters of the wind tunnel
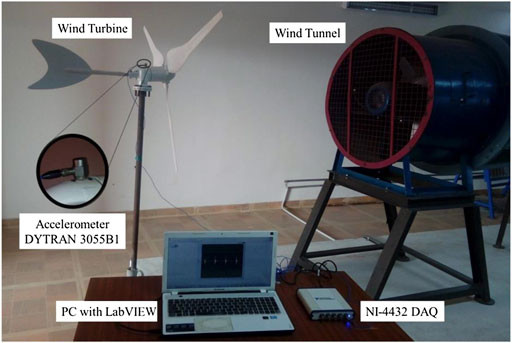
FIGURE 5. Experimental setup.
2.1 Data acquisition
On the nacelle above the turbine hub, the piezoelectric accelerometer (DYTRAN 3055B1) was affixed using an adhesive mounting approach to acquire a dynamic response. It was linked to the DAQ system via a cord (Ponci et al., 2021). It is the method of sampling signals that quantify physical conditions in the real world and converting the corresponding measurements into digital numerical data that a machine can exploit. The sensor transforms physical properties into electric impulses, signal processing tools convert analog voltage to digital values, and converters convert analog-to-digital signals to numerical values (Wodecki et al., 2021).
The DAQ system used in this analysis was the NI4432, a USB-type device. Five analog input channels, 102.4 k frames per second, and a 24-bit resolution comprised the DAQ system. The accelerometer is connected to an analog-to-digital converter (ADC) and a charging amplifier unit incorporated within the device. The frequency of vibration had been received from the ADC. These vibration signals were used to derive functions by extracting features (Bai et al., 2021). The accelerometer is connected to one end of the cable and to the other end to the DAQ system analog input and output (AIO) terminal. The transducer signal and the device were connected using NI-LabVIEW (PC).
This research specified the length of the sample to ensure the accuracy of the results, which also included the major principles. If the sample size is large enough, statistical measurements are more important. In contrast, the number of samples increases the time for measurement. A sample length of 10,000 was chosen to achieve consistency (Entezami et al., 2020). As per the Nyquist sampling theorem, the frequency response must be at least twice the maximum in the signal. It was determined that this sampling frequency theorem was able to provide a mean of 12 kHz and a minimal amount of 100 samples for each WTB state (Joshuva and Sugumaran, 2020). The following faults were simulated one at a time on a blade while other blades remain in good condition along with other components and the corresponding vibration signals are acquired. Figures 6A–F show the different blade fault conditions that are simulated on the blade.
1) Good condition blade (good): The blade is classified to be in good original state, which is having no damage or artificial defects on the blade’s surface.
2) Blade bend fault (bend): This problem happens in real time owing to the aerodynamic force, which causes the WTB to bend flapwise. An increase in blade deflection results in bending stresses and strong vibrations, as well as a reduction in between the shaft and blade clearance. The blade bend on the flapwise defect was emulated by bending the blade at a 10° angle from its initial position.
3) Blade crack fault (crack): In real time, foreign objects, such as bird strikes, manufacturing faults, and damage during transit and erection, cause the blade to crack. This failure creates wrong guiding alignment, blade stiffness, and stress. To simulate the fault of a blade with a width of 3 mm and a length of 15 mm, a hacksaw blade was used.
4) Blade erosion fault (erosion): WTBs are vulnerable to a variety of precipitation types as well as a range of caustic airborne particles, which can erode their surfaces over time, especially at the foremost edge. These flying particles have the potential to harm blades, reducing aerodynamic performance and energy capture. In addition, in specific circumstances on the leading edges of the WTBs, bug detritus and other airborne particles may build up. Blade degradation and cutting-edge contamination can significantly limit blade productivity, notably in the field of maximum operating edges, and it is key to an optimum blade output and power collection. This problem was reproduced by degrading the coating surface with an emery sheet of 320 CW to produce an erosion impact for the blade.
5) Hub-blade loose contact (loose): A bolt that binds the hub and blade to a turbine falls loose leading to a short-age of maintenance and extended runtime, causing extreme vibration and upheaval in the structure of the rotors and destruction of the complete turbine. The bolt attaching the hub and the blade was loosened to simulate this condition.
6) Blade pitch angle twist (pitch angle twist): To produce power from wind energy, the turbine shaft is linked to the wind turbine pitch. However, the pitch of the blade is wrenched more owung to wind turbulence, resulting in critical vibration and the intention to halt the wind turbine system. To recreate this pitch issue, the blade pitch is twisted 12° from its original angle to replicate this scenario.
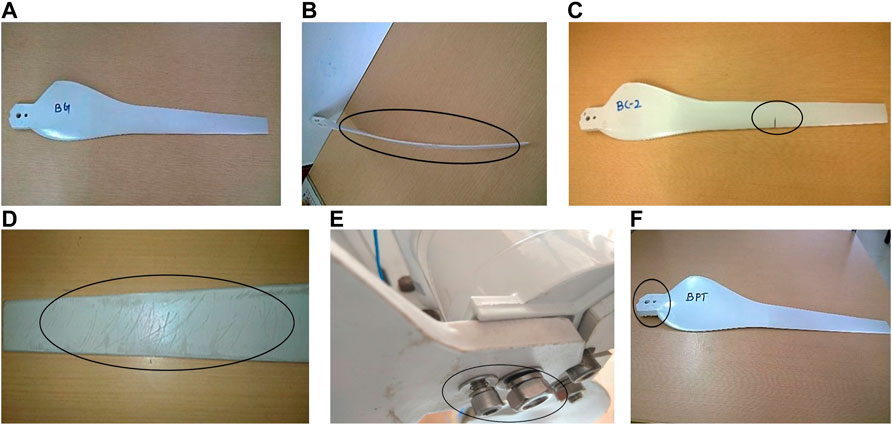
FIGURE 6. (A) Good condition blade. (B) Blade bend fault condition. (C) Blade crack fault condition. (D) Blade erosion fault condition. (E) Hub-blade loose fault condition. (F) Blade pitch fault condition.
Figures 7A–F show the time-domain graph of the vibration signals of various blade conditions of the WTB. These sample signal plots (Figures 7A–F) show the vibration acquired from good condition blade, blade bend, blade crack, pitch angle twist, hub-blade loose connection, and blade erosion. This gives some basic idea about how the magnitude of the acquired vibration signal varies over time with respect to the faults that were simulated.
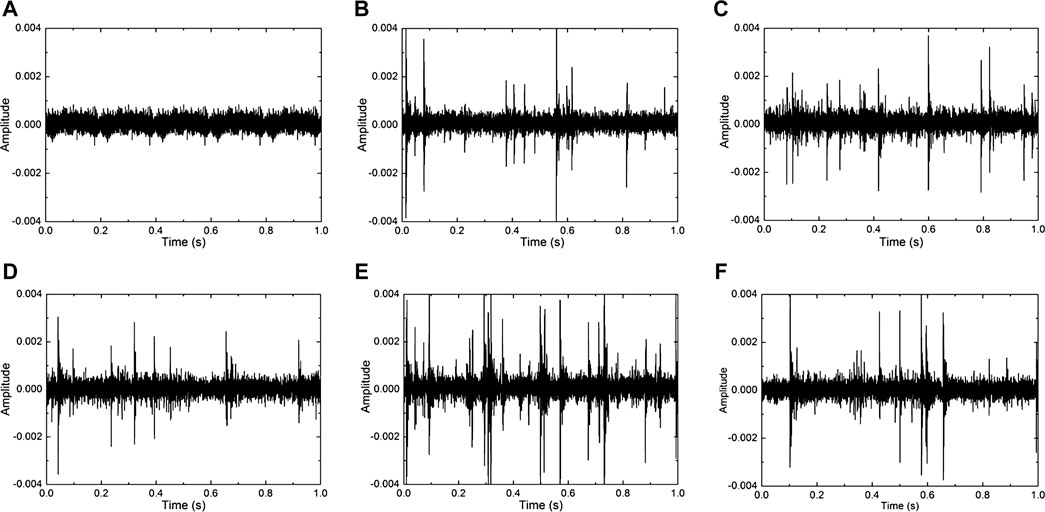
FIGURE 7. (A) Vibration plot for good condition blade. (B) Vibration plot for blade bend fault. (C) Vibration plot for blade crack fault. (D) Vibration plot for blade erosion fault. (E) Vibration plot for hub-blade loose fault. (F) Vibration plot for blade pitch fault.
2.2 Feature engineering and extraction
The wind blade signals comprise a set of features that are useful as input for classification tasks. Therefore, it is crucial to extract such features and filter them to obtain the relevant ones. The training set has these features as input where the wind blade failure is considered as output (label). There are different approaches for extracting characteristics for distinct applications that require high performance (Alkhawaldeh, 2019; Alkhawaldeh et al., 2019). Figure 8 shows a framework that involves building the ML models. These features are discussed as follows:
• Mel-spectrogram: It is a set of mel-scaled power spectrogram coefficients. Each spectrogram coefficient represents the signal in acoustic time–frequency form. The power spectral density P(f, t) is split into a set of mel-scale values at evenly spaced times ti and frequencies fj (on a mel-frequency scale). The mel-frequency scale is described as follows:
• MFCC: It is a filtered shape in a compact representation of the spectrum called the envelope of the short-time power spectrum. MFCCs are computed in consecutive steps as follows:
➢ Splitting the signal into compact segments: To combat alterations in samples in a small number of times, partition the signal across a range of 20- to 40-ms frames, because it is continuously changed at long-distance times.
➢ Periodogram of the segment power: A periodogram assessment of the power spectrum is estimated for each frame, which indicates the frame’s frequencies.
➢ The mel filter bank to the power spectra: The algorithm then estimates the powers in different alternate frames that emerged in a series of periodogram blocks of segments using a filter bank. Owing to superfluous information in periodogram spectral estimation, this filter is applied.
➢ Logarithm of all filter bank energies: It uses a logarithmic scale that is also utilized for cepstral mean diminution to scale large variations of energies as there are no distinguishable sounds in high energies.
➢ Discrete cosine transform (DCT): It is used to decorrelate the filter bank powers as the association in filter bank powers causes overlapping. The DCT generates diagonal covariance matrices as features. Then, it chooses higher DCT coefficients (2–13 DCT coefficients) to overcome the rapid variations in the filter bank powers and drop the remaining ones.
• Chroma: It estimates a chromagram embedded in the power spectrogram. Chroma features are robust samples that extend the whole spectrum onto 12 blocks depicting 12 diverse semitones (or chroma) of the acoustic octave.
• Tonnetz: It estimates the tonal centroid characteristics (or Tonnetz) using the approach described in Hu et al. (2012) to detect alterations in the symmetrical components of wave signals.
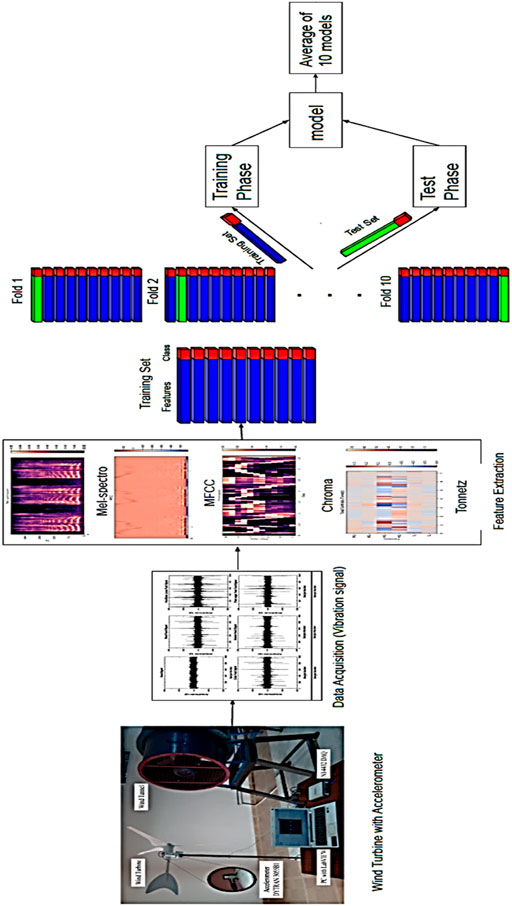
FIGURE 8. The structure of building wind blade fault datasets and classifier models for evaluation.
2.3 Supervised learning methods and evaluation
Supervised classification algorithms endeavor to attain a suboptimal classification model for identifying unknown sets of given characteristics and hidden tags. Several classification models radically expose an intense theory in representing knowledge as a precise pattern. To satisfy the heterogeneity in using varied structures, a set of supervised classification algorithms of different groups are used. To be more specific, the suggested classifiers in terms of the group are the following (Witten et al., 2016):
• Bayes: Find a probabilistic model using the Bayes theorem in a form of rules or graphs, such as the NB model. The core of the NB classifier is to achieve conditional independence between input features and ensure that the evidence or the probability of features are the same for the entire classes. These assumptions guarantee an accurate probabilistic classifier model.
• Functions: Build a classifier as a function that maps the inputs (features) to the outputs (labels). These functions are in diverse representations, such as linear or nonlinear forms. Thus, in this study, we use two forms of functions that are nonlinear, such as MLP and linear SVM (linear_SVM).
• Deep convolutional neural network (DCNN): DCNN comprises feature extraction and recognition phases. The feature extraction procedure derives relevant characteristics of the input raw sequences by convolution and pooling layers for adjusting the weights W as feature maps among layers (Goodfellow et al., 2016; Hinterstoisser et al., 2018). The convolution layers slide some filters (or kernels) over the input image or the next feature maps to generate low-dimensional features from high-dimensional features, while the pooling layers reduces the dimensional size of each feature map and retains the most important information. During the recognition phase, the final relevant features at the last layer of the network are smoothed into a flattened sequence of numbers to be supplied into a fully connected ANN classification layer. In this study, we use 1DCNN to extract features from a sequence of data and map the sequence’s underlying features to certain classes.
• Meta: The core concept in this family is to construct a powerful classifier from an ensemble of weak classifiers that are integrated in such a way that they can predict a label using the majority of classes or the mean value of the continuous classes. Two techniques are used in this family: bagging and boosting. In bagging methods, the training data are sampled using sampling with replacement into k samples. The bagging technique builds a classifier from each sample often using the J48 algorithm. In the testing phase, the final results of the whole classifiers are aggregated using voting or averaging score. The boosting techniques build a classifier in a sequential manner where the error generated from the previous weak classifier is highlighted to be solved by the next classifiers. The bagging, RF, and XGBoosts techniques are used as well-known algorithms.
• Trees: In tree-based models, the idea of randomness (or impurity) using entropy is the main core of such models. The features of the training set are selected based on how random data would be generated into sub-trees. Hence, the best attribute is the one that generates a pure tree of class leave nodes. In particular, each classifier is built in a form of tree, with each node providing the most desirable feature at that level and the arcs indicating the values of that feature. Here the decision tree J48 (DT) model was employed. This employs a stratified 10-fold cross-validation technique during the evaluation phase. As shown in Figure 8, this technique chooses 10% of the dataset for testing and 90% of the dataset for training (the other ninefold) in a sequential process. The classifier model was built, and its performance was evaluated in each process. The average performance of all folds is then represented. Using such a technique, one can ensure that the entire dataset is involved in the training and testing phases, thereby reducing the risk of overfitting. This problem occurs when the model correctly classifies all of the training data but fails to fit the test sets.
3 Result and discussion
This section presents the experimental settings, parameters, and datasets as well as the classification results. This research primary aims to assess whether the blades are in decent or poor shape. The experimental settings involve the simulation that generates the vibration signals on different conditional environments. Section 3.1 explains the process of generating the training and test sets. In Section 3.2, the performance of ML models using evaluation metrics is presented in detail.
3.1 Parameter settings and datasets
To evaluate our methodology, a set of experiments using four variant dataset settings was conducted. Each dataset has different rotation per minute (RPM) values of the wind turbine, as follows: Dataset400 has 400 RPM, Dataset500 has 500 RPM, Dataset600 has 600 RPM, and Dataset700 has 700 RPM. Each dataset has a set of signals for each fault class, which are bend, crack, erosion, good, loose, and pitch angle twist. On a blade, these flaws were replicated one at a time, and the related vibration signals were gathered. The datasets contain a set of vibration signals along with a set of labels that refer to the wind blade faults. Table 4 shows the statistical information about the four datasets. As shown, each dataset contains a number of vibration signals for each wind blade fault. The datasets are balanced with approximately the same number of classes at each dataset.
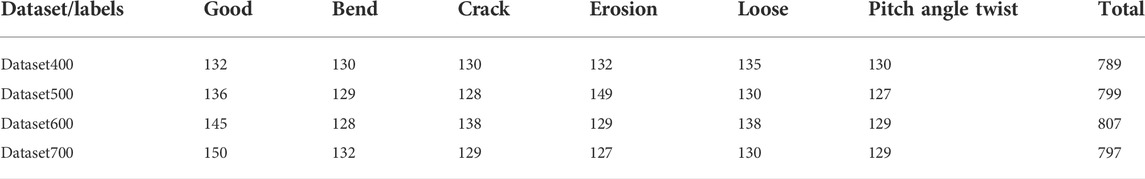
TABLE 4. The statistical information of the datasets.
The stratified 10-fold cross-validation technique divides the dataset into training and test sets of 90% and 10%, respectively. The training and test partitions of datasets are approximately (710, 79), (719, 80), (726, 81), and (717, 80) for Dataset400, Dataset500. Dataset600, and Dataset700, respectively. This division also ensures that each dataset participates more than once to avoid overfitting problems. The performance of the models using the evaluation metrics that are used for comparison was evaluated. The evaluation metrics that are used in this work are accuracy, precision, and recall, as follows:
- Accuracy is the proportion of correctly classified wind blade faults to the total number of classified wind blade faults.
- Precision is the fraction of correctly classified wind blade faults to the to overall classified wind blade faults.
- Recall (known also as sensitivity) refers to the percent of retrieved correctly classified wind blade faults over all correctly classified wind blade faults.
TP denotes the fault blades that have been correctly classified as faults. The unfaulty blades that are successfully categorized as unfaulty are represented by TN. FP refers to blades that are wrongly labeled as faults despite not being faulty. FN refers to blades that are wrongly labeled as faults despite not being faulty.
3.2 Experimental evaluation results
Eight classifiers on the four datasets using the stratified 10-fold cross-validation technique were evaluated. The accuracy performance of the classifiers is depicted in Figure 9 where the x-axes indicate the datasets, while y-axes represent the accuracy values. As shown, the bagging, RF, and XGBoosts techniques show high performance on each dataset with an average accuracy value of approximately 95.4%, 88%, 93.42%, and 89.4% for Dataset400, Dataset500, Dataset600, and Dataset700, respectively. As a result, the tree-based algorithms gain superior performance among all ML techniques. The structure of a tree-based model comprises a set of features in internal nodes and class labels in leaf nodes.
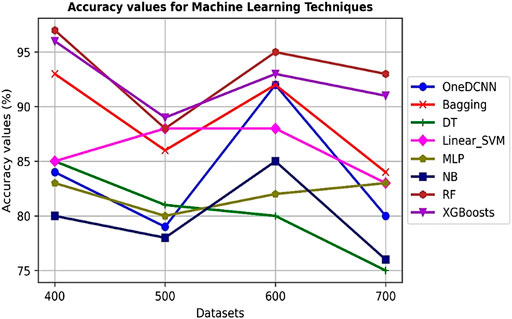
FIGURE 9. The accuracy values of machine learning techniques on four datasets.
In order to build a tree-based classifier, these techniques leverage the idea of entropy to determine the high-entropy gain features that guarantee low randomness when splitting the dataset. A consecutive process in identifying the most entropy gain features results in a coherent and effective tree-based classifier. This ensures that the discrete or relevant features are more compatible with the tree-based methods resulting in solid and effective models. Accuracy is an average value over all the classes that provides an incorrect performance of the model and fails in providing which class has an effect on the performance. In other words, it conceals the information required to better analyze the performance of the classification model. If you have an unbalanced amount of instances in each class or if your dataset has more than two classes, classification accuracy alone can be misleading. As a result, it is critical to describe to what extent is forecasting the real classes to their expected values to demonstrate their influence on model performance.
In contrast, a complete performance analysis might be presented using a confusion matrix, which overcomes the problem of depending just on classification accuracy. The confusion matrix is a two-dimensional structure that describes the results of classification problem prediction. The number of correct and incorrect predictions is summarized with count values and divided by class. As a result, the confusion matrix depicts the various ways in which the classification model is confused when making predictions. In the confusion matrix, the predicted values are on the x-axes, while the actual (or target) values are on the y-axes as shown in Figure 10.
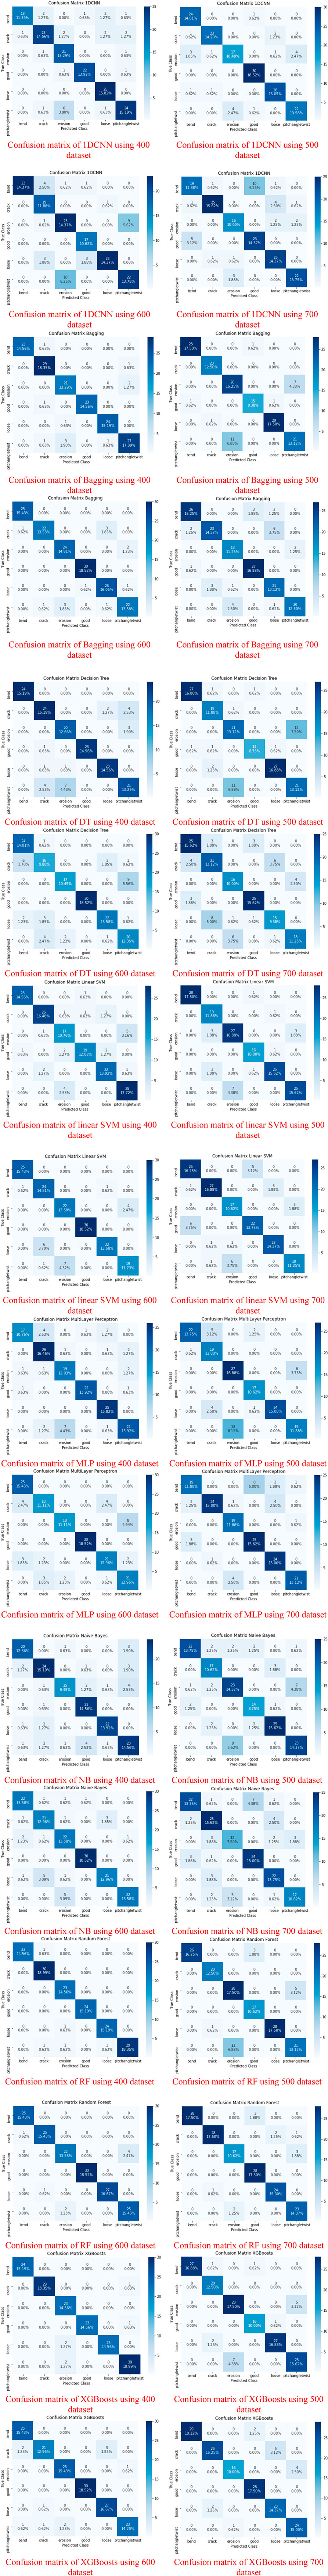
FIGURE 10. (Continued)
The performance of the eight classifiers is evaluated using six classes that represent how good the prediction of the wind blade failures is based on the received signals as input features. The tree-based models, which are the bagging, RF, and XBoosts models, provide effective performance; thus, the focus is on their outcomes for predicting wind blade failures. Focusing on the most effective models, analyse the three tree-based classifier models using a confusion matrix to further depicting their performance. Figure 10 show the percentages of the error rate of the predicted class values to their corresponding actual values, in addition to the other classes’ values. In particular, the bagging classifier has a highly effective performance on predicting the classes where the average predicting error rate to the bend, crack, erosion, good, loose, and pitch angle twist classes are approximately 15.94%, 14.7%, 14%, 14.84%, 15.5%, and 14.1%, respectively, in the four datasets. The prediction effectiveness using the RF classifier is of an approximately average prediction error rate on the same classes of 15.94%, 16.11%, 14.1%, 15.46%, 16.1%, and 15.32% respectively. Using the XGBoosts classifier, the average prediction error rate are 16.41%, 15%, 14.4%, 15.15%, 15.6%, and 15.6%, respectively. The prediction error rate of the classifiers is on average approximately less than 17% over all classes of the four datasets. The wind blade failures have a slightly high error rate, indicating that the signals from such failures have an influence on classification performance. The results show correlation effectiveness between classes, with a signal from one class being more similar to signals from other classes. Thus, the decision-makers have to pay attention to monitoring and identifying the failures that reveal a high error rate along with using automatic predictive classifiers to avoid possible damage in the future.
The precision and recall metric values in ML assessment provide an accurate representation of how a classifier behaves in recognizing the real classes to the predicted values. The estimate of such values is dependent on a confusion matrix, which also illustrates the two types of prediction error. The two error types are false positive and false negative. The precision metric focuses on type I errors, which are the actual classes that are not failure classes but have been predicted as failure classes by the classifier, and the recall measure focuses on type II errors, which are the actual classes with failure tags that are categorized as nonfailure classes. Because forecasting wind blade failures is a vital application, one must emphasize the precision metric findings to assure how well a classifier model performs in minimizing the effect of false-positive predictions. Figure 11 displays bar charts for the precision and recall values of the bagging, RF, and XGBoosts classifiers on the four datasets across the six classes. In particular, the bend, crack, and loose classes have sufficient average precision values on the four datasets using the RF classifier of 0.99, 0.96, and 0.97, respectively. In contrast, the erosion, good, pitch angle twist classes gain competent average precision values of 0.88, 0.97, and 0.9, respectively, using the XGBoosts classifier. The RF classifier provides adequate recall values for crack, good, and loose of 0.97, 1, and 0.96, respectively, while the XGBoosts classifier assumes significant values for bend, erosion, and pitchanglewist classes of 0.97, 0.9, and 0.88, respectively. The results show that the RF classifier has an impact with high precision and recall values to crack and loose classes, while the XGBoosts classifier attains effective values for erosion and pitch angle twist classes. The bend and good classes are affected by the RF and XGBoosts classifiers with alternate precision and recall values. In addition, the results are varied using different environmental settings, whereas the results in Dataset400 obtain high precision and recall values over all classes. Therefore, an environment with a wind blade turbine of 400 rotations per minute is more stable to gather the failure prediction in different situations.
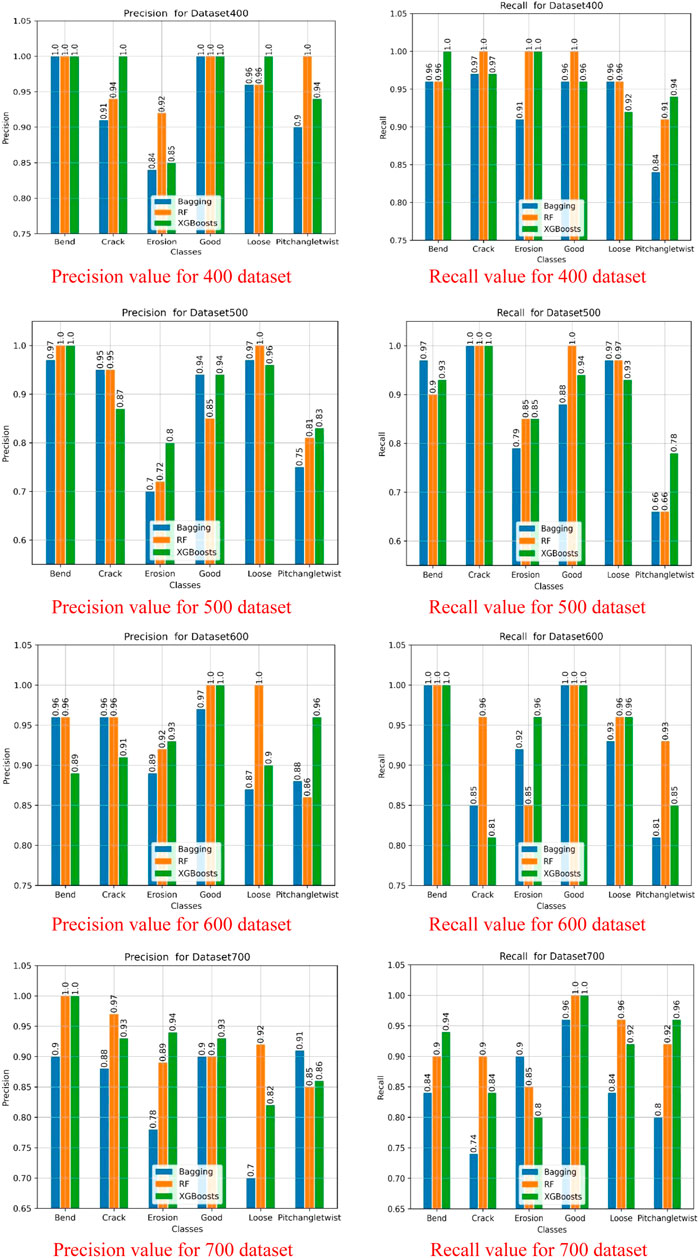
FIGURE 11. Precision and recall values for the 400, 500, 600, and 700 datasets.
In summary, using four datasets in different situations for evaluation, the RF and XGBoosts classifiers outperform the other models, with overall average precision and recall values of (0.93, 0.94) and (0.93, 0.93), respectively. The F1 score is a weighted average of precision and recall that accounts for both false positives and false negatives. F1 is the represented as the concordant mean of precision and recall (i.e.,)
4 Conclusion and future work
Wind energy is one of the natural green and reliable energy assets. However, the WTBs are vulnerable to various frictional forces because of environmental factors and wide structures that can affect the blades. This leads to electricity development and the shutdown of turbines. The downtime is shortened by the continuous diagnosis of blades according to structural health management. Thus, early detection of deficiencies in wind blades contributes to increased productivity and efficiency and reduces operating costs in the WTs. Therefore, building an effective model requires a proper diagnosis of failures. In this study, we present the framework of signal gathering, feature extraction, and classification techniques. Extensive experiments to evaluate a set of classification models from various families of ML techniques were conducted. These experiments are assessed using four different environmental datasets depending on the rotation of the wind turbine per minute. The results showed that the RF and XGBoosts tree-based models outperform the other models, with an accuracy average value of approximately more than 93%. Furthermore, they obtained average precision and recall values of (0.93, 0.94) and (0.93, 0.93), respectively. Thus, this makes them effective in detecting problems with WTBs on real-time blade faults. This study aims to analyze more environmental conditions in future work and study different ML techniques with appropriate hyperparameter settings. In addition, the purpose of this study is to evaluate an ensemble tree-based model that combines the best models into a unified framework. This might boost the performance of detecting the wind blade failures effectively.
Data availability statement
The raw data supporting the conclusions of this article will be made available by the authors, without undue reservation.
Author contributions
JA: experimentation, data collection, writing—original draft, resources, and validation. RA: visualization and investigation. PV: conceptualization, methodology, and writing—original draft. VS: conceptualization, visualization, and investigation. NL: data collection and investigation. PC: methodology, resources, validation, and supervision. PS: experimentation and data collection. KV: writing—original draft, resources, and validation. HF: resources, validation, and supervision. MC: Writing—Review & Editing, SC: Supervision and Funding acquisition, SS: isualization and Project administration.
Conflict of interest
The authors declare that the research was conducted in the absence of any commercial or financial relationships that could be construed as a potential conflict of interest.
Publisher’s note
All claims expressed in this article are solely those of the authors and do not necessarily represent those of their affiliated organizations, or those of the publisher, the editors, and the reviewers. Any product that may be evaluated in this article or claim that may be made by its manufacturer is not guaranteed or endorsed by the publisher.
Abbreviations
ADC, analog-to-digital converter; AIO, analog input and output; ANN, artificial neural network; DAQ, data acquisition; DCNN, deep convolutional neural network; DSF, damage sensitive feature; DT, decision tree; EIA, Energy Information Administration; EOV, environmental and operational variabilities; FBG, fiber Bragg grating; HAWT, horizontal-axis wind turbine; MD, Mahalanobis distance; MFCC, mel-frequency cepstral coefficient; ML, machine learning; MLP, multilayer perceptron; NB, naive Bayes; NI, National Instruments; PC, personal computer; RF, random forest; RFID, radio-frequency identification; RPM, potation per pinute; SHM, structural health monitoring; SVM, support vector machine; TR-PIV, time-resolved particle image velocimetry; UAV, unmanned aerial vehicle; USB, universal serial bus; WT, wind turbine; WTB, wind turbine blade.
References
Alkhawaldeh, R. S. (2019). Dgr: Gender recognition of human speech using one-dimensional conventional neural network. Sci. Program. 2019, 7213717. doi:10.1155/2019/7213717
Alkhawaldeh, R. S., Khawaldeh, S., Pervaiz, U., Alawida, M., and Alkhawaldeh, H. (2019). Niml: Non-intrusive machine learning-based speech quality prediction on voip networks. IET Commun. 13, 2609–2616. doi:10.1049/iet-com.2018.5430
Astolfi, D., Byrne, R., and Castellani, F. (2021). Estimation of the performance aging of the vestas v52 wind turbine through comparative test case analysis. Energies 14, 915. doi:10.3390/en14040915
Astolfi, D. (2021). Wind turbine operation curves modelling techniques. Electronics 10, 269. doi:10.3390/electronics10030269
Bai, T., Yang, J., Yao, D., and Wang, Y. (2021). Information fusion of infrared images and vibration signals for coupling fault diagnosis of rotating machinery. Shock Vib. 2021, 6622041. doi:10.1155/2021/6622041
Baratsas, S. G., Niziolek, A. M., Onel, O., Matthews, L. R., Floudas, C. A., Hallermann, D. R., et al. (2021). A framework to predict the price of energy for the end-users with applications to monetary and energy policies. Nat. Commun. 12, 18. doi:10.1038/s41467-020-20203-2
Bi, J. X., Fan, W. Z., Wang, Y., Ren, J., and Li, H. B. (2021). “A fault diagnosis algorithm for wind turbine blades based on bp neural network,” in IOP Conference Series: Materials Science and Engineering, Shaanxi, China, 8th-11th October 2020 (Shaanxi: IOP Publishing), 022032.
Chen, W., Qiu, Y., Feng, Y., Li, Y., and Kusiak, A. (2021). Diagnosis of wind turbine faults with transfer learning algorithms. Renew. Energy 163, 2053–2067. doi:10.1016/j.renene.2020.10.121
Cho, S., Choi, M., Gao, Z., and Moan, T. (2021). Fault detection and diagnosis of a blade pitch system in a floating wind turbine based on kalman filters and artificial neural networks. Renew. Energy 169, 1–13. doi:10.1016/j.renene.2020.12.116
Entezami, A., Shariatmadar, H., and Mariani, S. (2020). Fast unsupervised learning methods for structural health monitoring with large vibration data from dense sensor networks. Struct. Health Monit. 19, 1685–1710. doi:10.1177/1475921719894186
Gao, Z., and Liu, X. (2021). An overview on fault diagnosis, prognosis and resilient control for wind turbine systems. Processes 9, 300. doi:10.3390/pr9020300
Goodfellow, I., Bengio, Y., and Courville, A. (2016). Deep learning. MIT press. http://www.deeplearningbook.org.
Habibi, H., Howard, I., Simani, S., and Fekih, A. (2021). Decoupling adaptive sliding mode observer design for wind turbines subject to simultaneous faults in sensors and actuators. IEEE/CAA J. Autom. Sin. 8, 837–847. doi:10.1109/jas.2021.1003931
Hinterstoisser, S., Lepetit, V., Wohlhart, P., and Konolige, K. (2018). “On pre-trained image features and synthetic images for deep learning,” in European conference on computer vision (Berlin/Heidelberg, Germany: Springer), 682–697.
Hu, Y., Wu, D., and Nucci, A. (2012). Pitch-based gender identification with two-stage classification. Secur. Comm. Netw. 5, 211–225. doi:10.1002/sec.308
Joshuva, A., and Sugumaran, V. (2020). A lazy learning approach for condition monitoring of wind turbine blade using vibration signals and histogram features. Measurement 152, 107295. doi:10.1016/j.measurement.2019.107295
Joustra, J., Flipsen, B., and Balkenende, R. (2021). Structural reuse of high end composite products: A design case study on wind turbine blades. Resour. Conservation Recycl. 167, 105393. doi:10.1016/j.resconrec.2020.105393
Li, Y., Jiang, W., Zhang, G., and Shu, L. (2021). Wind turbine fault diagnosis based on transfer learning and convolutional autoencoder with small-scale data. Renew. Energy 171, 103–115. doi:10.1016/j.renene.2021.01.143
Lin, Z. C., Liu, S. C., Lu, M., and Zhu, P. Y. (2021). Design of a management system of packaged fbg sensor based on rfid for wind turbine blade. J. Phys. Conf. Ser. 1820, 012023. doi:10.1088/1742-6596/1820/1/012023
Liu, X., Du, J., and Ye, Z. S. (2021a). A condition monitoring and fault isolation system for wind turbine based on scada data. IEEE Trans. Ind. Inf. 18, 986–995. doi:10.1109/tii.2021.3075239
Liu, Z., Wang, X., and Zhang, L. (2020a). Fault diagnosis of industrial wind turbine blade bearing using acoustic emission analysis. IEEE Trans. Instrum. Meas. 69, 6630–6639. doi:10.1109/tim.2020.2969062
Liu, Z., Yang, B., Wang, X., and Zhang, L. (2021b). Acoustic emission analysis for wind turbine blade bearing fault detection under time-varying low-speed and heavy blade load conditions. IEEE Trans. Ind. Appl. 57, 2791–2800. doi:10.1109/tia.2021.3058557
Liu, Z., Zhang, L., and Carrasco, J. (2020b). Vibration analysis for large-scale wind turbine blade bearing fault detection with an empirical wavelet thresholding method. Renew. Energy 146, 99–110. doi:10.1016/j.renene.2019.06.094
Malik, H., and Almutairi, A. (2021). Modified fuzzy-q-learning (mfql)-based mechanical fault diagnosis for direct-drive wind turbines using electrical signals. IEEE Access 9, 52569–52579. doi:10.1109/access.2021.3070483
Mazare, M., Taghizadeh, M., and Ghaf-Ghanbari, P. (2021). Fault tolerant control of wind turbines with simultaneous actuator and sensor faults using adaptive time delay control. Renew. Energy 174, 86–101. doi:10.1016/j.renene.2021.04.077
Mishnaevsky, L., Hasager, C. B., Christian, B., Anna-Maria, T., Rad, S. D., Fæster, S., et al. (2021). Leading edge erosion of wind turbine blades: Understanding, prevention and protection. Renew. Energy 169, 953–969. doi:10.1016/j.renene.2021.01.044
Movsessian, A., Cava, D. G., and Tcherniak, D. (2021). An artificial neural network methodology for damage detection: Demonstration on an operating wind turbine blade. Mech. Syst. Signal Process. 159, 107766. doi:10.1016/j.ymssp.2021.107766
Nielsen, J. S., Tcherniak, D., and Ulriksen, M. D. (2021). A case study on risk-based maintenance of wind turbine blades with structural health monitoring. Struct. Infrastructure Eng. 17, 302–318. doi:10.1080/15732479.2020.1743326
Pandit, R., Infield, D., and Dodwell, T. (2021). Operational variables for improving industrial wind turbine yaw misalignment early fault detection capabilities using data-driven techniques. IEEE Trans. Instrum. Meas. 70, 1–8. doi:10.1109/tim.2021.3073698
Ponci, L. P., Creci, G., and Menezes, J. C. (2021). Simplified procedure for vibration analysis and dynamic balancing in mechanical systems with beats frequency. Measurement 174, 109056. doi:10.1016/j.measurement.2021.109056
Ren, Z., Verma, A. S., Li, Y., Teuwen, J. J., and Jiang, Z. (2021). Offshore wind turbine operations and maintenance: A state-of-the-art review. Renew. Sustain. Energy Rev. 144, 110886. doi:10.1016/j.rser.2021.110886
Santolamazza, A., Dadi, D., and Introna, V. (2021). A data-mining approach for wind turbine fault detection based on scada data analysis using artificial neural networks. Energies 14, 1845. doi:10.3390/en14071845
Shankar Verma, A., Jiang, Z., Ren, Z., Caboni, M., Verhoef, H., van der Mijle-Meijer, H., et al. (2021). A probabilistic long-term framework for site-specific erosion analysis of wind turbine blades: A case study of 31 Dutch sites. Wind Energy 24, 1315–1336. doi:10.1002/we.2634
Shi, Y., Li, S., Wang, S., Zhai, Y., Tian, Y., Yu, D. L., et al. (2021). Pitch angle control with fault diagnosis and tolerance for wind turbine generation systems. Proc. Institution Mech. Eng. Part I J. Syst. Control Eng. 235, 1355–1366. doi:10.1177/0959651821993689
Soulier, A., Braud, C., Voisin, D., and Podvin, B. (2021). Low-Reynolds-number investigations on the ability of the strip of e-telltale sensor to detect the flow features over wind turbine blade section: Flow stall and reattachment dynamics. Wind Energy Sci. 6, 409–426. doi:10.5194/wes-6-409-2021
Wang, M. H., Hsieh, C. C., and Lu, S. D. (2021). Fault diagnosis of wind turbine blades based on chaotic system and extension neural network. Sensors Mater. 33, 2879. doi:10.18494/sam.2021.3208
Wang, Y., Tan, J., Qin, X., Hu, Z., Jing, Y., and Han, G. (2021). “Windturbine blade fault diagnosis based on mfcc feature optimization strategy,” in IOP Conference Series: Earth and Environmental Science, Xiamen, China, 17-19 November 2020 (IOP Publishing.), 012074.
Witten, I. H., Frank, E., Hall, M. A., and Pal, C. J. (2016). “Data mining,” in Practical machine learning tools and techniques. 4th ed. (San Francisco, CA, USA: Morgan Kaufmann Publishers Inc.).
Wodecki, J., Michalak, A., and Zimroz, R. (2021). Local damage detection based on vibration data analysis in the presence of Gaussian and heavy-tailed impulsive noise. Measurement 169, 108400. doi:10.1016/j.measurement.2020.108400
Xiang, L., Wang, P., Yang, X., Hu, A., and Su, H. (2021). Fault detection of wind turbine based on scada data analysis using cnn and lstm with attention mechanism. Measurement 175, 109094. doi:10.1016/j.measurement.2021.109094
Xie, Y., Zhao, J., Qiang, B., Mi, L., Tang, C., and Li, L. (2021). Attention mechanism-based cnn-lstm model for wind turbine fault prediction using ssn ontology annotation. Wirel. Commun. Mob. Comput. 2021, 6627588. doi:10.1155/2021/6627588
Xu, J., Ding, X., Gong, Y., Wu, N., and Yan, H. (2021). Rotor imbalance detection and quantification in wind turbines via vibration analysis. Wind Eng. 46, 3–11. doi:10.1177/0309524X21999841
Yang, X., Zhang, Y., Lv, W., and Wang, D. (2021). Image recognition of wind turbine blade damage based on a deep learning model with transfer learning and an ensemble learning classifier. Renew. Energy 163, 386–397. doi:10.1016/j.renene.2020.08.125
Zare, S., and Ayati, M. (2021). Simultaneous fault diagnosis of wind turbine using multichannel convolutional neural networks. ISA Trans. 108, 230–239. doi:10.1016/j.isatra.2020.08.021
Zhang, C., Wen, C., and Liu, J. (2020). Mask-mrnet: A deep neural network for wind turbine Blade Fault detection. J. Renew. Sustain. Energy 12, 053302. doi:10.1063/5.0014223
Keywords: wind energy production, fault diagnosis, energy prediction, machine learning, wind turbine
Citation: Arockia Dhanraj J, Alkhawaldeh RS, Van De P, Sugumaran V, Ali N, Lakshmaiya N, Chaurasiya PK, S. P, Velmurugan K, Chowdhury MS, Channumsin S, Sreesawet S and Fayaz H (2022) Appraising machine learning classifiers for discriminating rotor condition in 50W–12V operational wind turbine for maximizing wind energy production through feature extraction and selection process. Front. Energy Res. 10:925980. doi: 10.3389/fenrg.2022.925980
Received: 22 April 2022; Accepted: 06 July 2022;
Published: 25 August 2022.
Edited by:
Marianne Rodgers, Wind Energy Institute of Canada, CanadaReviewed by:
Giuseppe Ciaburro, Università della Campania, ItalySaidi Ahmed, Université Ahmed Draia Adrar, Algeria
Copyright © 2022 Arockia Dhanraj, Alkhawaldeh, Van De, Sugumaran, Ali, Lakshmaiya, Chaurasiya, S., Velmurugan, Chowdhury, Channumsin, Sreesawet and Fayaz. This is an open-access article distributed under the terms of the Creative Commons Attribution License (CC BY). The use, distribution or reproduction in other forums is permitted, provided the original author(s) and the copyright owner(s) are credited and that the original publication in this journal is cited, in accordance with accepted academic practice. No use, distribution or reproduction is permitted which does not comply with these terms.
*Correspondence: Sittiporn Channumsin, c2l0dGlwb3JuQGdpc3RkYS5vci50aA==