 Ning Yang
 Tao Yu
 Qingquan Luo1,2
- 1School of Electric Power Engineering South China University of Technology, Guangzhou, China
- 2Guangdong Provincial Key Laboratory of Intelligent Measurement and Advanced Metering of Power Grid, Guangzhou, China
Lithium-ion batteries are widely employed in industries and daily life. Research on the state of health (SOH) of batteries is essential for grasping the performance of batteries, better guiding battery health management, and avoiding safety mishaps caused by battery aging. Nowadays, most research adopts a data-driven artificial intelligence approach to assess SOH. However, the majority of approaches are based on entire voltage, current, or temperature curves. In reality, voltage, current, and temperature are frequently presented in segments, leading to the limited flexibility and slow analysis speed of the traditional techniques. This study solves the problem by dividing the whole voltage curve into many typical kinds of segments with equal timescales based on different typical voltage beginning points. On this foundation, the temporal convolution network (TCN) is used to create a sub-model of SOH estimation for several typical kinds of segments. In addition, the sub-models are fused using the bootstrap aggregating (Bagging) approach to boost accuracy. Finally, this research uses a publicly available dataset from Oxford to demonstrate the effectiveness of the suggested strategy.
Introduction
Lithium-ion batteries are widely used in aerospace, electronic products, electric vehicles, and power systems because they are environmentally friendly, efficient, and long-lived (Bijoy et al., 2019; Zhang et al., 2019). However, the frequent fire accidents have sounded an alarm to people, making people gradually realize the seriousness of the aging problem of lithium-ion batteries and the importance of health management. The battery management system (BMS) (Wang et al., 2022) is an important part of the battery system. For safety and reliability, its most important parameter is the state of health (SOH). SOH reflects the current performance of the battery on a long timescale, which can be used to guide the replacement of lithium-ion batteries and avoid safety accidents caused by battery performance aging to a certain extent.
The definition of a lithium-ion battery health state is usually based on impedance and capacity (Li et al., 2020). The former can be obtained by electrochemical impedance spectroscopy or the equivalent circuit model; the latter is determined by the current integration method. In contrast, the latter is widely used because it is easier to obtain. The definition form of SOH is given below (Lipu et al., 2018):
where
However, the integral operation of the current is accompanied by the accumulation of errors. Therefore, in practice, other methods are often used to evaluate the SOH of the battery. There are three common evaluation methods: empirical model, mechanism model, and data-driven. The method based on the empirical model refers to the equivalent circuit model (Chen et al., 2021a) built by components such as resistance and capacitance to simulate the dynamic behavior of the battery, and realize the evaluation of SOH by identifying the component parameters in the equivalent circuit (Chen et al., 2020; Chen et al., 2021b). However, this method has the disadvantages of low accuracy and unclear physical meaning (Zhao et al., 2019). For the method based on the mechanism model, a series of partial differential equations (Xiong et al., 2018) are used to describe the aging of the battery. Although this method is more accurate, it has problems that are difficult to solve and computationally intensive (Abada et al., 2016). The data-driven method has become the first choice for SOH evaluation because it is no need for modeling.
However, most studies use data-driven methods to estimate SOH by complete curves. In reality, it is difficult to collect complete data in practice (Zhong et al., 2021), so the obtained voltage, temperature, and current are mostly presented in the form of fragments. At present, there are few studies on estimating SOH by curve segments. Therefore, literature (Wang et al., 2021) extracted the isobaric rise time as the health factor through feature engineering to evaluate SOH. Literature (Fan et al., 2021) determined the optimal interval for estimating SOH by traversing to select typical voltage segments and then determines SOH by matching unknown segments with typical segments. However, when the amount of data increases, the computational complexity will further increase. At the same time, it should be noted that the SOH evaluation of the battery belongs to a few-shot problem, so the manually extracted features or set sample intervals are difficult to ensure good generalization performance. Literature (Zhou et al., 2019) used dilated Kalman filter and Gaussian process regression to predict the full charge time and obtain SOH by segmented charging data but did not study the discharge segment. Literature (Liu et al., 2021) obtains fixed-length charging segment, fixed-length discharge segment, and variable-length charging segment based on alignment operation, and uses an encoder to study SOH. However, the selected segment has a long timescale.
There is almost no constant current charge/discharge condition in the real world, but it can be approximated as a constant current condition in a short time. Therefore, it is of practical significance to split the charge/discharge curves obtained under laboratory conditions into small fragments. According to the starting point of voltage, this paper divides the charge/discharge voltage curve under the constant current condition in the laboratory into several kinds of typical segments with the same time scale to simulate the scenarios in practical engineering. The mathematical essence of SOH prediction for segments is time series regression, where TCN performs better than recurrent neural networks (Zhang, 2018). As a result, TCN is used to establish a SOH prediction sub-model with rapid prediction capabilities on various types of segments. To improve the prediction accuracy, Bagging is used for model fusion. The outstanding contributions of this paper are:
1) With the proposed method, lithium-ion batteries can be evaluated for their SOH by using segments, which can be used for rapid evaluation of batteries;
2) The experimental results show that the prediction results of some types of fragments meet the requirements of the actual BMS (i.e. the error is no more than 5%), indicating that the proposed method has good flexibility;
3) Proper integration of models can improve the accuracy of prediction. In view of this, this paper puts forward some suggestions.
SOH Evaluation Model
Acquisition of Curve Segments
In the laboratory, reference charge tests or reference discharge tests are mostly used to determine the SOH, and both of them include the stage of constant current. Since the temperature on the surface of batteries is easily disturbed by the external environment, the voltage is relatively stable. Therefore, the voltage is used to evaluate the SOH in the stage of constant current. As shown in Figure 1, each complete curve is divided into several segments with the same timescale, the timescale of this paper is chosen as 100 s, and the voltage corresponding to the beginning of the segment is an integral multiple of 0.1 V.
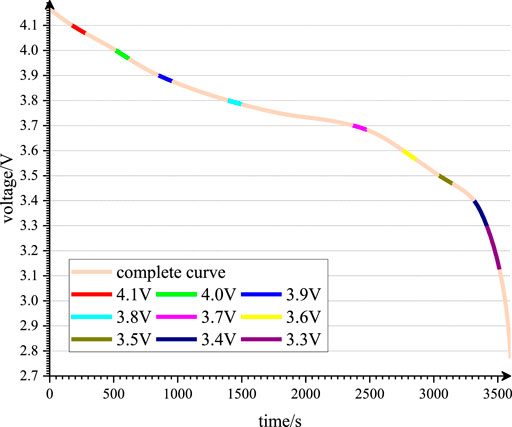
FIGURE 1. Typical fragment extraction.
Temporal Convolutional Network
TCN is mainly composed of dilated causal convolution and residual connection, as shown in Figure 2. Among them, the former is defined as dilated causal convolution given below:
where
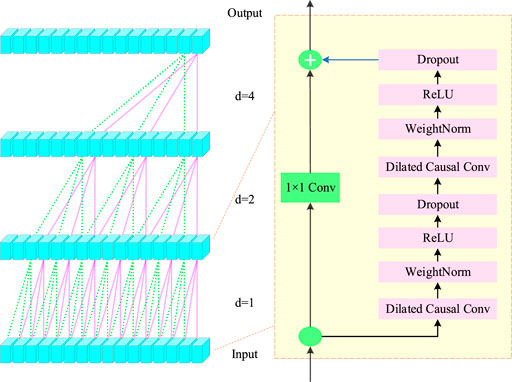
FIGURE 2. TCN architecture.
While for the latter,
where
Bagging
Bagging is an integrated learning method (Wang et al., 2015), which reduces the generalization error and further improves the accuracy and stability of prediction by fusing several sub-models. The basic steps are as follows:
1) Extract the training set from the original sample set. Using Bootstrap, n training samples are extracted from the original data set each time. Therefore, after k rounds of extraction, a total of k training sets are obtained.
2) For each training set, a model is trained respectively, and a total of k models are obtained.
3) Calculate the average of the predicted values of k models as the final prediction result.
Overall Framework of the SOH Estimation Model
As shown in Figure 3, the model framework is mainly divided into two parts: establishing a SOH prediction sub-model based on typical segments by TCN and establishing an ensemble model using Bagging. The sub-models are trained by using the voltage segments as input and the SOH as output, while the ensemble models are trained by using the results of different sub-models as input and the real SOH as output. For the convenience of explanation, the segment is defined by the voltage corresponding to the segment start time, such as segment 3.8. The sub-model established on this type of segment is recorded as sub-model 3.8.
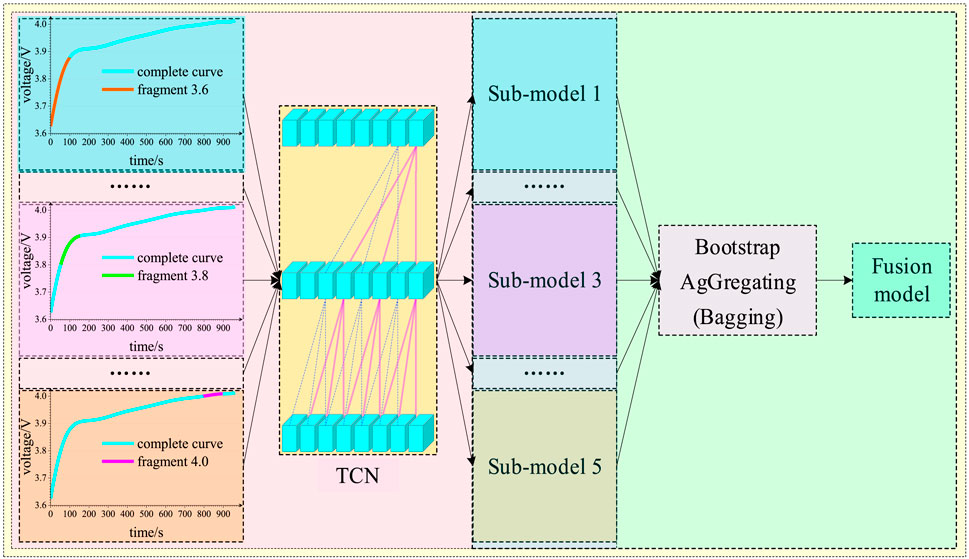
FIGURE 3. The overall framework of the SOH evaluation model.
Oxford Dataset
The test data set is provided by Oxford University (Birkl, 2017). For eight small lithium-ion batteries Cell1 ∼ Cell8 with a capacity of 0.74Ah, the characteristic measurement is carried out after every 100 driving cycle tests (André, 2004). The characteristic measurement includes cyclic charge and discharge tests, i.e. constant current charge and discharge (both charge and discharge currents are 1C, i.e. 0.74 A), charge cut-off voltage, and discharge cut-off voltage is 4.2 and 2.7 V respectively. The voltage and temperature are sampled in the test, and the sampling period is 1 s.
As regards the usage of data, Cell1∼Cell4, Cell5∼Cell6, and Cell7∼Cell8 are used for training set, verification set, and testing set respectively. Different sub-models are obtained according to different typical segments.
For the ensemble model, for the Oxford data set, the prediction results of different sub-models on Cell 7 are selected as the input of the training set, the real SOH value is used as the output, and the Bagging algorithm is used for training to obtain the total model. On this basis, the SOH of Cell8 is predicted.
Example Analysis
Hardware Environment and Experimental Platform
The model is developed in Python language and simulated on a server equipped with four GeForce RTX 2080 Ti graphics cards using pytorch1.7.0 and scikit0.23.1 learning framework.
Experimental Results and Performance Indicators
The prediction results are quantitatively evaluated by max absolute error (AEmax), mean absolute error (MAE), and root mean square error (RMSE) (Lin et al., 2022):
Sub-model Prediction Results
The typical voltage segment of the same type in each charge/discharge process was taken as the input of TCN, and the SOH corresponding to the voltage segment was taken as the output, to establish the SOH evaluation sub-model for the typical voltage segment. As for model parameter configuration, the details are as follows: the learning rate is 1E-3, the size of the convolution kernel is 3, the number of network layers is 8, the batch size is 32, and the optimizer is Adam. Refer to Table 1 for SOH prediction results of the charging and discharging processes of Cell7 and Cell8.
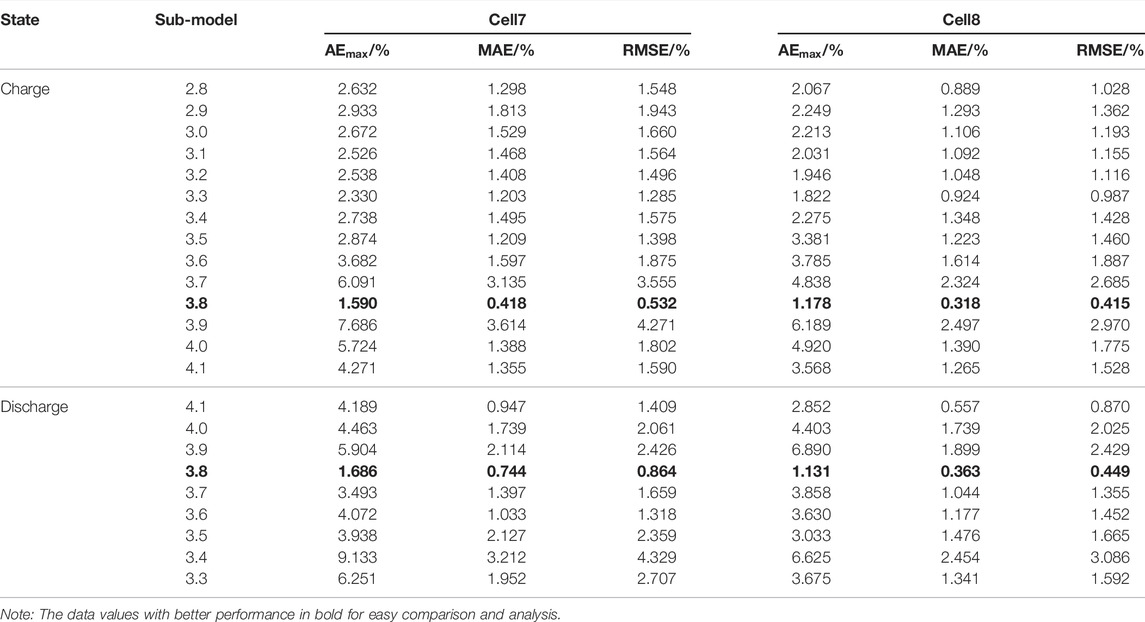
TABLE 1. SOH prediction results of the charging and discharging processes of Cell7 and Cell8.
It can be seen from the table that for the charging process, except that the prediction effects of sub-model 3.7, sub-model 3.9, and sub-model 4.0 can not meet the requirements of BMS, the sub-models based on other typical segments can be used in BMS. For the discharge process, the effect of sub-model 3.9, sub-model 3.4, and sub-model 3.3 is poor. Short-time scale segmentation can be employed for SOH assessment, according to preliminary findings based on analysis and comparison. On the other hand, segments may be flexibly selected in real-world scenarios.
The Prediction Results of the Ensemble Model
We use many methods to fuse models, such as random forest regression (RFR), gradient boosting regressor (GBR), support vector regression (SVR), K-nearest neighbor (KNN), decision tree (DT), extra tree (ET), AdaBoost, and bagging. The basic learners of Bagging and AdaBoost are both decision tree. Different sub-models are selected to build the ensemble model according to
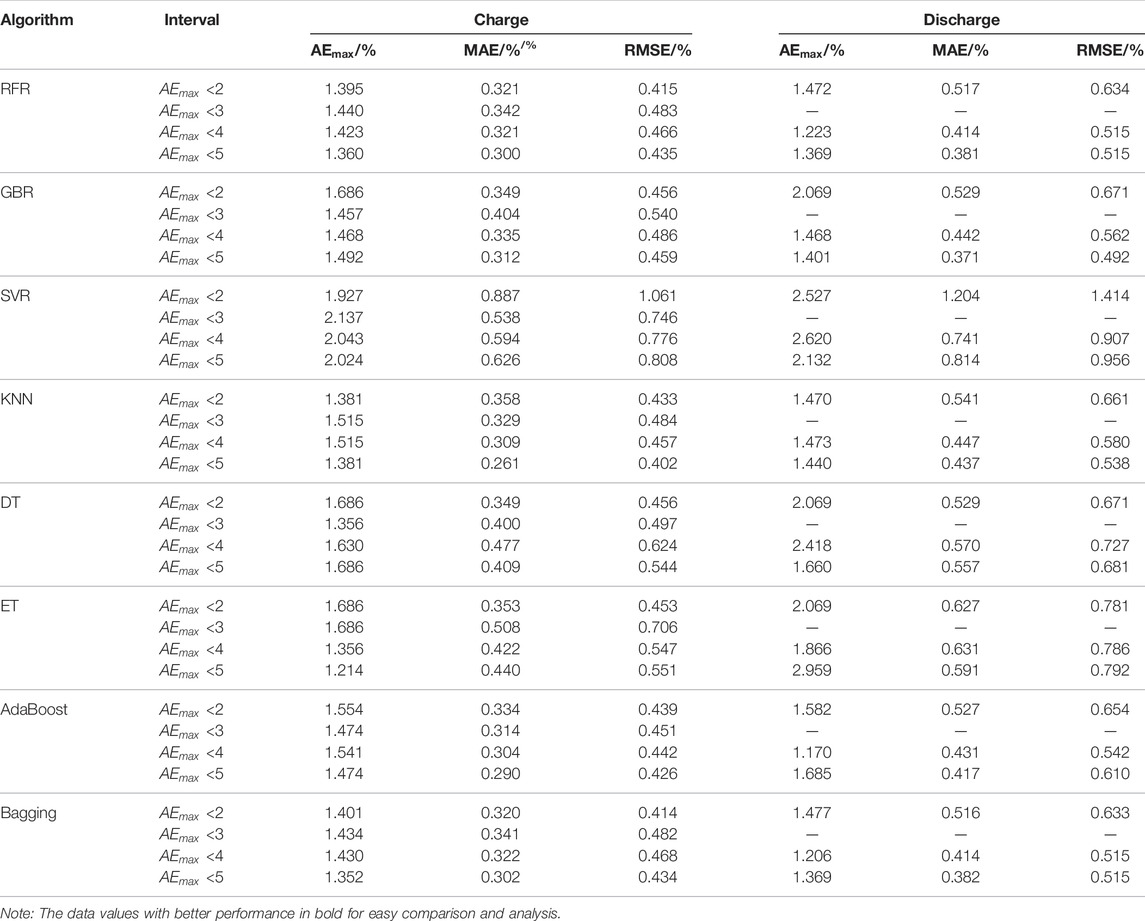
TABLE 2. Prediction effect of the ensemble model by different algorithms.
Sub-model 3.8 performs best in the charging process, and its performance indicators on cell 8 are
It can be found from Table 2 that when a better sub-model is fused with the sub-models with worse performance, the ensemble model’s performance is diminished. As a result, it is proposed that the sub-models should be fused according to the interval split by the
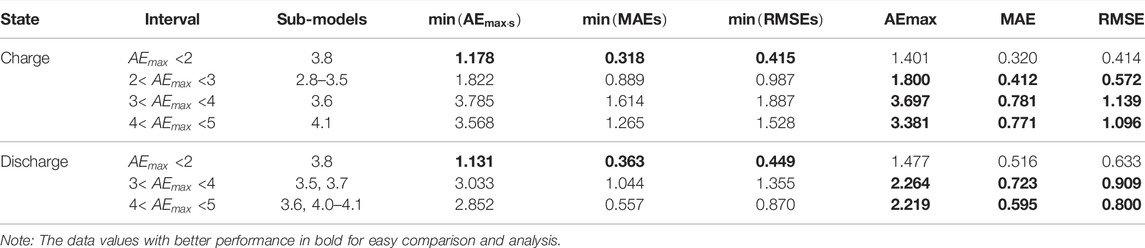
TABLE 3. Prediction effect of the ensemble model (Bagging).
As shown in Table 3,
When sub-models with similar performance are fused, except the ensemble models constructed by sub-model 3.8 in the charging process and sub-model 3.8 in the discharge process are poor, ensemble models show better performance than sub-models. In particular, the
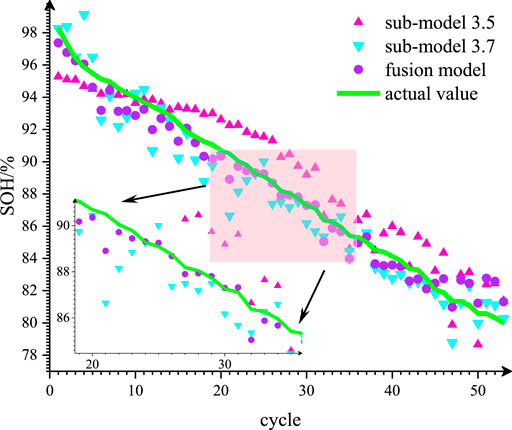
FIGURE 4. Prediction effect of the ensemble model.
Conclusion
The conclusions that can be drawn from the above experiments are: 1) It is feasible to use short timescale segments for SOH estimation, which enables fast estimation of SOH. At the same time, it shows that the selection of segments can be flexible in practice, that is, the segments with shorter time scales or at other locations can be selected for the rapid prediction of SOH. 2) The prediction performance of the ensemble model is closely related to the prediction performance of each sub-model instead of the number of sub-models. When a single sub-model with poor prediction performance participates in model fusion, it may weaken the prediction performance of other sub-models with better performance to a certain extent, and the prediction performance of the ensemble model is even lower than that of a single sub-model. Therefore, when improving the performance of the ensemble model, we should not only consider choosing different algorithms but also try to integrate the models with similar performance, which will achieve better prediction performance. In particular, sub-models with excellent performance are not recommended to participate in the fusion alone, which may lead to the risk of over-fitting.
Since the simulation of the practical application scenarios is still based on the premise of constant current, it is necessary to combine current with voltage for a more rapid and accurate prediction of SOH in the future.
Data Availability Statement
Publicly available datasets were analyzed in this study. This data can be found here: https://howey.eng.ox.ac.uk/data-and-code/.
Author Contributions
Conceptualization, Methodology, Writing—original draft, NY; Resources, Funding acquisition, TY; Writing, QL; Supervision, KW.
Conflict of Interest
The authors declare that the research was conducted in the absence of any commercial or financial relationships that could be construed as a potential conflict of interest.
Publisher’s Note
All claims expressed in this article are solely those of the authors and do not necessarily represent those of their affiliated organizations, or those of the publisher, the editors and the reviewers. Any product that may be evaluated in this article, or claim that may be made by its manufacturer, is not guaranteed or endorsed by the publisher.
Acknowledgments
The authors gratefully acknowledge the support of science and technology project Supported by China Southern Power Grid (GDKJXM20172939).
References
Abada, S., Marlair, G., Lecocq, A., Petit, M., Sauvant-Moynot, V., and Huet, F. (2016). Safety Focused Modeling of Lithium-Ion Batteries: A Review [J]. J. Power Sources 306, 178–192. doi:10.1016/j.jpowsour.2015.11.100
André, M. (2004). The ARTEMIS European Driving Cycles for Measuring Car Pollutant Emissions. Sci. Total Environ. 334-335, 73–84. doi:10.1016/j.scitotenv.2004.04.070
Bijoy, S., Kalita, P., and Garg, A. (2019). A Review of State of Health (SoH) Estimation of Energy Storage Systems: Challenges and Possible Solutions for Futuristic Applications of Li-Ion Battery Packs in Electric Vehicles[J]. J. Electrochem. Energy Convers. Storage 16 (4), 1–12. doi:10.1115/1.4042987
Birkl, C. (2017). Diagnosis and Prognosis of Degradation in Lithium-Ion batteries[D]. Oxford: University of Oxford.
Chen, M., Wu, J., and Jiao, C. (2020). Multi-Factor Online Estimation Method for Health Status of Lithium-Ion Battery[J]. J. Xi'an Jiaot. Univ. 54 (1), 169–175. doi:10.7652/xjtuxb202001021
Chen, L., Chen, J., and Xu, Z. (2021a). State Estimation of Lithium-Ion Battery in Energy Storage System Based on Real-Time Circuit Model[J]. J. Central South Univ. Sci. Technol. 52 (2), 458–464. doi:10.11817/j.issn.1672-7207.2021.02.014
Chen, L., Wang, H., and Li, Y. (2021b). Battery State-Of-Health Estimation by Using Metabolic Extreme Learning Machine[J]. Automot. Eng. 43 (1), 10–18. doi:10.19562/j.chinasae.qcgc.2021.01.002
Fan, Y., Xiao, F., and Xu, J. (2021). State of Health Estimation of Lithium-Ion Batteries Based on the Partial Charging Voltage Segment and Kernel Ridge Regression[J]. Proc. CSEE 41 (16), 5661–5669. doi:10.13334/j.0258-8013.pcsee.201805
Li, X., Xiao, F., and Fan, Y. (2020). An Approach to Lithium-Ion Battery SOH Estimation Based on Convolutional Neural Network[J]. Trans. China Electrotech. Soc. 35 (19), 4106–4119. doi:10.19595/j.cnki.1000-6753.tces.191617
Lin, M., Wu, D., Meng, J., Wu, J., and Wu, H. (2022). A Multi-Feature-Based Multi-Model Fusion Method for State of Health Estimation of Lithium-Ion Batteries[J]. J. Power Sources 518, 1–8. doi:10.1016/j.jpowsour.2021.230774
Lipu, M. S. H., Hannan, M. A., Hussain, A., Hoque, M. M., Ker, P. J., Saad, M. H. M., et al. (2018). A Review of State of Health and Remaining Useful Life Estimation Methods for Lithium-Ion Battery in Electric Vehicles: Challenges and Recommendations. J. Clean. Prod. 205, 115–133. doi:10.1016/j.jclepro.2018.09.065
Liu, H., Wang, P., and Cheng, Z. (2021). A Novel Method Based on Encoder-Decoder Framework for Li-Ion Battery State of Health Estimation[J]. Proc. CSEE 41 (5), 1851–1859. doi:10.13334/j.0258-8013.pcsee.200090
Wang, L., Ma, C., and Zhou, X. (2015). Estimation of Wheat Leaf SPAD Value Using RF Algorithmic Model and Remote Sensing Data[J]. Trans. Chin. Soc. Agric. Mach. 46 (01), 259–265. doi:10.6041/j.issn.1000-1298.2015.01.036
Wang, P., Zhang, J., and Cheng, Z. (2021). A Coupled State Estimation Method of Lithium Batteries Based on Partial Charging Voltage Segment[J]. J. Hunan Univ. Nat. Sci. 48 (10), 187–200.
Wang, P., Zhang, J., and Cheng, Z. (2022). State of Health Estimation of Li-Ion Battery Based on Least Squares Support Vector Machine Error Compensation Model[J]. Power Syst. Technol. 46 (02), 613–623. doi:10.13335/j.1000-3673.pst.2021.0045
Xiong, R., Li, L., Li, Z., Yu, Q., and Mu, H. (2018). An Electrochemical Model Based Degradation State Identification Method of Lithium-Ion Battery for All-Climate Electric Vehicles Application. Appl. Energy 219, 264–275. doi:10.1016/j.apenergy.2018.03.053
Zhang, S., Zhai, B., and Guo, X. (2019). Synchronous Estimation of State of Health and Remaining Useful Lifetime for Lithium-Ion Battery Using the Incremental Capacity and Artificial Neural Networks[J]. J. Energy Storage 26, 1–12. doi:10.1016/j.est.2019.100951
Zhang, S. (2018). A New Method for Lithium-Ion Battery's SOH Estimation and RUL prediction[C], 2693–2697.
Zhao, Y., Xu, J., and Wang, H. (2019). An Estimation Method of Relative State-Of-Health for Lithium-Ion Batteries Using Morlet Wavelet[J]. J. Xi'an Jiaot. Univ. 53 (12), 97–103. 130. doi:10.7652/xjtuxb201912013
Zhong, J., Liao, K., and Li, B. (2021). State Estimation Method of Lithium Battery Based on Random Fragment Data[J]. Electr. Power Autom. Equip. 41 (10), 205–212. doi:10.16081/j.epae.202110003
Keywords: lithium-ion batteries, state of health, temporal convolutional networks, bootstrap aggregating, segments, model fusion
Citation: Yang N, Yu T, Luo Q and Wang K (2022) Fast and Accurate Health Assessment of Lithium-Ion Batteries Based on Typical Voltage Segments. Front. Energy Res. 10:925947. doi: 10.3389/fenrg.2022.925947
Received: 22 April 2022; Accepted: 04 May 2022;
Published: 23 May 2022.
Edited by:
Bo Yang, Kunming University of Science and Technology, ChinaReviewed by:
Yixuan Chen, The University of Hong Kong, Hong Kong SAR, ChinaYang Cui, Northeast Electric Power University, China
Copyright © 2022 Yang, Yu, Luo and Wang. This is an open-access article distributed under the terms of the Creative Commons Attribution License (CC BY). The use, distribution or reproduction in other forums is permitted, provided the original author(s) and the copyright owner(s) are credited and that the original publication in this journal is cited, in accordance with accepted academic practice. No use, distribution or reproduction is permitted which does not comply with these terms.
*Correspondence: Tao Yu, dGFveXUxQHNjdXQuZWR1LmNu