 Bowen Liu1,2,3
 Da Xu
Da Xu Lin Jiang
- 1School of Automation, China University of Geosciences, Wuhan, China
- 2Hubei Key Laboratory of Advanced Control and Intelligent Automation for Complex Systems, Wuhan, China
- 3Engineering Research Center of Intelligent Technology for Geo-Exploration, Ministry of Education, Wuhan, China
- 4Department of Electrical Engineering and Electronics, University of Liverpool, Liverpool, United Kingdom
- 5School of Energy and Power Engineering, Huazhong University of Science and Technology, Wuhan, China
- 6Institute of New Energy, Wuhan, China
The worldwide coronavirus disease 2019 (COVID-19) pandemic has greatly affected the power system operations as a result of the great changes of socio-economic behaviours. This paper proposes a short-term load forecasting method in COVID-19 context based on temporal-spatial model. In the spatial scale, the cross-domain couplings analysis of multi-factor in COVID-19 dataset is performed by means of copula theory, while COVID-19 time-series data is decomposed via variational mode decomposition algorithm into different intrinsic mode functions in the temporal scale. The forecasting values of load demand can then be acquired by combining forecasted IMFs from light Gradient Boosting Machine (LightGBM) algorithm. The performance and superiority of the proposed temporal-spatial forecasting model are evaluated and verified through a comprehensive cross-domain dataset.
Introduction
Accurate short-term load forecasting can reduce unnecessary power loss and dispensable cost, which is the premise to ensure the supply-demand balance and the stability of the power system (Yang et al., 2022; Yao et al., 2022). With the volatility of power load and the complex external factors, it is critical to improve the forecasting accuracy, especially in extreme conditions (Shi et al., 2020). Most countries and regions were forced to implement strict blockade measures during coronavirus disease 2019 (COVID-19), which only opened a few essential enterprises and isolated residents at home. The major interruption caused by this policy will greatly change the load consumption patterns of various industries compared with the past. Because the training process of traditional load forecasting models relies heavily on historical data of calendar, meteorological information and power load. they have performed poorly from the beginning of COVID-19.
Traditional methods mainly include a variety of mathematical statistical methods, such as generalized exponential smoothing (Christiaanse et al., 1971), grey forecasting model (Tsai and Hsu, 2010), autoregressive comprehensive moving average (ARIMA) (Amjady et al., 2001; Wang et al., 2014), multiple linear regression analysis (Jiang et al., 2018), etc. Although these methods can perfectly capture the linear characteristics of the data set, nonlinear and non-stationary characteristics still remains unsolvable. Nowadays, machine learning methods have been found by researchers to be effective in forecasting scenarios, such as support vector regression (SVM) (Che and Wang, 2014), convolutional neural networks (CNNs) (Zhang et al., 2018), long short-term memory (LSTM) (Li et al., 2021), graph attention networks (GATs) (Zhang et al., 2022).
Intelligent evolutionary algorithm (Li et al., 2020) is also adopted to predict short-term power load. There is no consensus over a particular forecasting model and the use of a method over another is often the result of the authors’ preferences. Since individual forecasting model has its own forecasting shortcomings, more and more hybrid forecasting methods are utilized to make an obvious improvement on forecasting performance. Hybridization of multiple forecasting methods can inherit advantages of individuals, including convergence performance, sensitive on small-scale variation, showing remarkable complementary characteristics in dealing with complex forecasting problems. For instance, through using CNN to reduce dimension and LSTM to dynamically model the forecasting time series, CNN and LSTM are combined to improve the forecasting accuracy (Jiang et al., 2021). Various boosting algorithms inspired by gradient lifting decision tree (GBDT), including extreme gradient lifting (XGBoost) (Chen and Guestrin, 2016) and light Gradient Boosting Machine (LightGBM) (Wang et al., 2020), are also applied in handing time series. As a result of parallel learning, and strong adaptability, and robustness, they have played a significant role in the performance improvement of other types of models in various fields, showing remarkable performances on time-series problem (Park et al., 2021).
Short-term power load involves complex characteristics, including chaos, periodicity and volatility. The function of time series decomposition technique is to decompose and extract several subsequences from the original load sequences. By considering of the non-linearity and non-stationarity characteristics, Empirical mode decomposition (EMD) (Flandrin et al., 2004) could extract the main mode components and the intrinsic mode functions (IMFs). However, it has many disadvantages, including unable to establish accurate mathematical model, difficult to determine the optimal interpolation, and poor anti-interference ability to noise. The signal decomposed by EMD will be mixed with discontinuous signals with high frequency and small amplitude, which can not be effectively separated according to the time scale. Such modal aliasing is detrimental to the forecasting performance enhancement. Then, a new multi-resolution variational mode decomposition (VMD) algorithm is introduced to overcome the limitations of EMD algorithm. VMD can separate the limited-bandwidth load data components with different center frequencies into modal functions with different characteristics (Lahmiri et al., 2015). Comparisons of extensive literatures (Huang et al., 2004; Zhu et al., 2017; He et al., 2019) show VMD has better prediction accuracy than EMD after decomposing and modeling time series data.
In this study, a temporal-spatial model for short-term power load accurate forecasting in the context of COVID-19 is proposed. In addition to weather, calendar and other traditional factors, the nonlinear correlation between public health factors, including the confirmed and dead cases’ numbers, the proportion of migrant workers under COVID-19 and power load are also considered. Here, the importance of meteorological and COVID-19 related factors is analyzed based on copula theory to obtain the corresponding key influencing factors in the spatial scale, while the VMD algorithm decomposes the original load time series into various IMFs with different characteristics in the temporal scale. Then, each subsequence is forecasted with the help of light Gradient Boosting Machine (LightGBM), and the final forecasting result is obtained by synthesizing multiple subsequences’ forecasting values. The effectiveness and superiority of the above scheme have been benchmarked on a COVID-19 related dataset.
Variational Mode Decomposition-Copula Based Temporal-Spatial Analysis
Variational Mode Decomposition
As a new complex nonlinear high-order time series decomposition tool, VMD has non-recursive and adaptive characteristics. By constantly updating the central frequency and iteratively searching the optimal solution of the mode function, VMD can extract the corresponding smooth amplitude modulation sub-modal function with different sparse features after determining the relevant finite frequency band and central pulsation. The overall flow of VMD algorithm is actually to solve the constructed variational problem: 1) since each modulus function is near the central frequency, the solution process of variational problem is essentially to seek the minimum of each sub-mode’s estimated bandwidth on the basis that the superposition of subsequences can restore the original signal equivalently; 2) the corresponding unilateral spectrum corresponding to each modal component is extracted by Hilbert transform; 3) the corresponding center frequency and exponential term are aliased to adjust the spectrum to the corresponding fundamental frequency band; 4) the decomposed signal gradient’s square L2 norm is obtained by H1 Gaussian smoothing (Dragomiretskiy and Zosso, 2013), so as to appraise the bandwidth of the subsequence. The constructed variational problem is expressed as:
where
Based on the Lagrange multiplier method, an unconstrained problem can be reformulated as:
where
The alternate direction method of multipliers method is used to the above minimization optimization problem. After iteration optimization,
where n represents number of iterations,
VMD decomposes the non-stationary and nonlinear original complex load sequence from the perspective of signal, and finally obtains multiple groups of stable natural mode functions, which has strong adaptability and anti-noise performance. Because there is no modal aliasing between modal components, the method has great advantages for extracting the local features of load series. The natural mode function and residual obtained by decomposition analyze the power load series from multiple temporal scales such as random information, periodic component and long-term change trend, which can greatly avoid the impact of the fluctuation and randomness of power load series on the prediction.
Definition and Derivation of Copula Function
External environmental factors, including real-time local electricity price and temperature will affect the power load. In the context of COVID-19, public safety data, including confirmed cases and public measures can also affect the power load. In order to analyze the inherent couplings among above factors, it is necessary to study the dependence of power load on each influencing factor. By introducing the copula function to connect the marginal distribution function, multiple variables can be flexibly formed into joint distribution, and the complex process of deriving the analytical expression of the joint distribution function can then be avoided.
The multivariate Sklar theorem (Zhao et al., 2021) points out that an n-dimensional joint distribution function can be represented by an integration of N univariate marginal distribution functions and Copula Functions. The classical copula model can be stated as (6).
where F1 (x1), F2 (x2),…, FN(xN) are marginal distribution function of power load and various influencing factors whose joint distribution function is F (x1, x2, … , xN). When F1 (x1), F2 (x2),
Copula function is different from the marginal distribution of traditional linear correlation analysis. It can accurately and quantitatively describe the correlation and consistency between nonlinear and asymmetric variables and input variables, and will not be affected by the enlargement of variable values. In addition, Copula function accurately describes the nonlinear correlation between variables and retains the analysis and estimation of the linear correlation between variables. In this paper, the tail and rank coefficients of correlation between variables are calculated by binary t-copula function, and their distribution characteristics are displayed by corresponding density function. Power load time series and external influencing factors are regarded as the inputs of Copula function, which provides Kendall and Spearman coefficients between input variables finally.
The quantitative relationship between the copula function C and Kendall rank correlation coefficient τ, Spearman’s rank correlation coefficient ρS, and tail correlation coefficient λ can be described by the following formulas:
where F(x), G(y) represent the marginal distribution of X, Y which are persistent random variables;
Through the calculation of Copula theorem, the rank correlation coefficients of Kendall and Spearman reflect the consistency of random variables X and Y, and tail correlation coefficient can feed back the probability that X and Y change in direct proportion to each other. The size of the rank correlation coefficient is independent of the marginal distribution of X and Y, and remains constant with random variables’ strictly monotonic transformation, indicating its wider application range than the traditional linear correlation coefficient.
The density function of the joint distribution function constructed by copula function accurately depicts the correlation structure between variables, and the derived rank phase relationship number ρS quantitatively analyzes the overall correlation and nonlinear coupling between power load and multiple external influence factors. By retaining the influence factors strongly related to power load and forming the input sample set of multiple load forecasting model, the dimension of the input data set can be reduced from the spatial scale, so as to efficiently abate the redundancy of the dataset and improve the forecasting accuracy and correctness.
Short-Term Power Load Forecasting
Light Gradient Boosting Machine
Due to its parallel learning, low memory utilization and fast training speed of distributed learning framework, LightGBM has a good performance in machine learning tasks. The technological innovation of LightGBM based on gradient unilateral sampling and exclusive feature bundling has been proved to ensure the accuracy of integrated learning algorithm and greatly save operation time.
Assuming that there are
where
The forecasting value of the new spanning tree branch is obtained by the superposition of its residual and the previous prediction. The complete process is (12), with objective function and residual in (13):
where
The tree that minimizes the sum of losses in (13) can be found and retained by continuously enumerating new tree branches with different structures. This process is repeated until the number of trees reaches the preset value. In other words, in each iteration, the optimal segmentation points and features are determined with the aid of the s splitting gain in (14), so as to determine an optimal structure tree.
where GL, HL and GR, HR respectively represents the first, second derivatives of the left and right branch sample nodes. If the gain is positive, it can ensure that the leaf nodes of the tree branches can be segmented only at the best feature segmentation point, so as to enhance the performance of the segmented model. If gain is negative, tree splitting will be stopped and the segmentation and optimization will not be carried out.
In order to accurately determine the best splitting point, GBDT algorithm uses presorting method to select and segment indicators, which needs a lot of time and memory. LightGBM adopts gradient-lifting one-side sampling and leaf-wise growth strategy with maximum depth limit to optimize GBDT, which reduces the number of samples and features, and improves the training speed. It can not only find the splitting points with better feature, but also cut down memory consumption. The main advantages of LightGBM are as follows:
1) Reduce the number of samples. The samples are sorted according to the absolute value of the gradient. In this process, the first a% of the whole sample is retained, and then b% of the remaining samples is selected. The information gain of the enlarged gradient sample is amplified
2) Reduce the splitting of the leaves with lower gain. The growing tree strategy is different from the traditional level-wise strategy, which avoids the division of redundant leaves with low gain and reduces the undue computing resources consumption. The leaf-wise growth will select the leaves with the largest splitting gain among all leaves for splitting and repeat this step. Then, more errors can be reduced and better accuracy can be obtained.
To sum up, LightGBM has the characteristics of distributed operation, faster training efficiency, lower memory use and better accuracy. When dealing with complex, massive and highly volatile data sets such as public health data and social distancing data under COVID-19, it can ensure the prediction accuracy and save a lot of prediction time.
Variational Mode Decomposition-Copula-LightGBM Forecasting Framework
Figure 1 illustrates the specific flow chart of the proposed short-term prediction scheme.
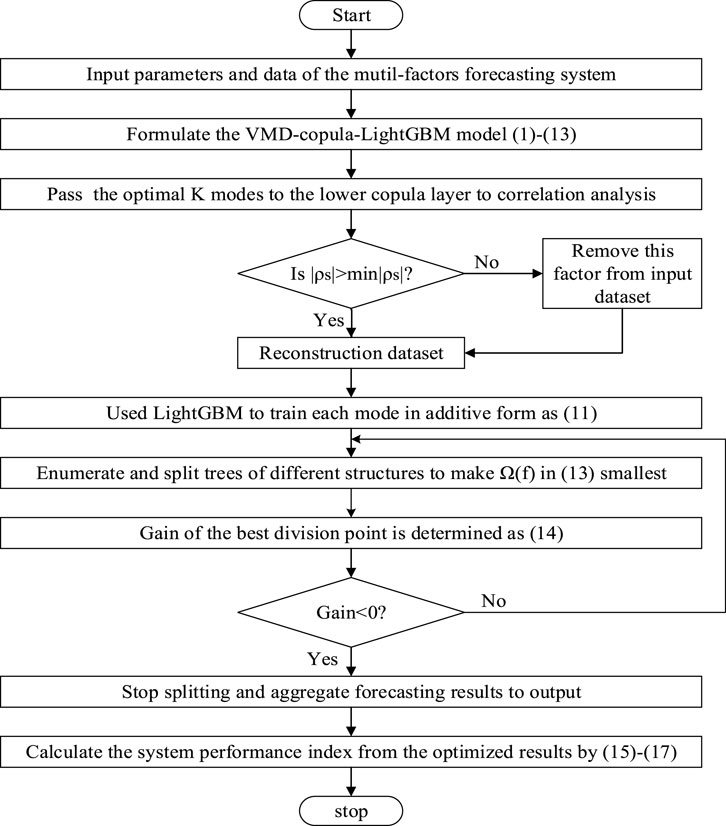
FIGURE 1. Temporal-spatial load forecasting model.
It mainly includes the following four steps:
1) Copula theorem is introduced into the quantitative analysis of the relationship of nonlinear correlation and tendency interlinkages between each external influencing variable during COVID-19 and power load so that the key influencing factors can be obtained for the next short-term forecasting during COVID-19.
2) After determining the optimal number of decomposition modes by permutation entropy and stable center frequency, the subsequences are decomposed from the original load data through VMD.
3) Different subsequences of the VMD decomposition have their own periodicity and volatility, which can fully reflect the data characteristics of power load. The forecasting results are obtained by superimposing the electric load subsequences forecasted by LightGBM, which determines whether the optimal splitting state is achieved by observing the gain.
4) The root mean square error (RMSE), mean absolute error (MAE), and mean absolute percentage error (MAPE) are used as the performance indexes to calculate the forecasting accuracy, as follows:
Case Study
Dataset Formulation
The original US COVID-19 data is obtained from (Ruan G et al., 2020), which includes the electricity market data, weather data, public health data, and mobile equipment position data. As shown in Figure 2, in addition to meteorological factors, power load patterns are closely related to the social, economic and productive activities and policies. For example, strict blockade measures during COVID-19 would force regions to open a few essential enterprises and isolate residents at home. In order to effectively analyze the effects of the cross-domain couplings analysis between these factors on load changes, a restricted vector autoregression model is selected to strictly evaluate the influence degree of relevant factors. The final results show that social and public measures such as retail liquidity have the strongest explanation for the power load change.
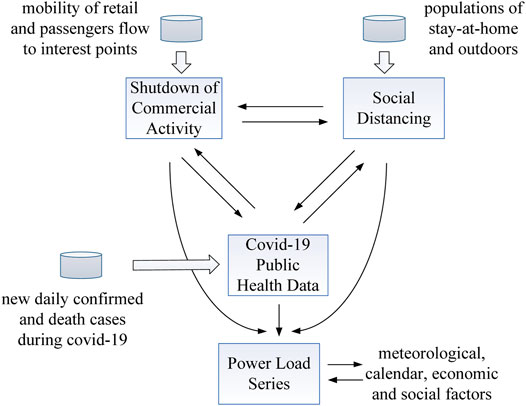
FIGURE 2. Coupling relationship between COVID-19 related factors.
Temporal-Spatial Analysis Results
Here, the nonlinear and trend correlation between environmental factors and power load series is evaluated based on Copula theory. The empirical copula function is used to establish the empirical joint distribution model of influencing factors and loads, and the square Euclidean distance is adopted to quantify their distance between the empirical copula model and other copula model. According to the square Euclidean distance criterion, the binary t copula function is more suitable for correlation analysis. The correlation analysis results can be found in Table 1. In order to better screen out the influencing factors with strong correlation with power load, the threshold of Spearman correlation coefficient of t-copula function is set to 0.1. As shown in Table 1, locational marginal power price has the highest correlation with electric power load, which is much higher than that of other factors with power load. Thus, the locational marginal price, relative humidity, wind speed, access rate of entertainment and retail industry, percentage of home working hours, percentage of part-time work behavior equipment, COVID-19 pandemic’s infection rate, fatal rate and so on can be chosen as key input factors, which have the most direct impact on the accuracy of the model.
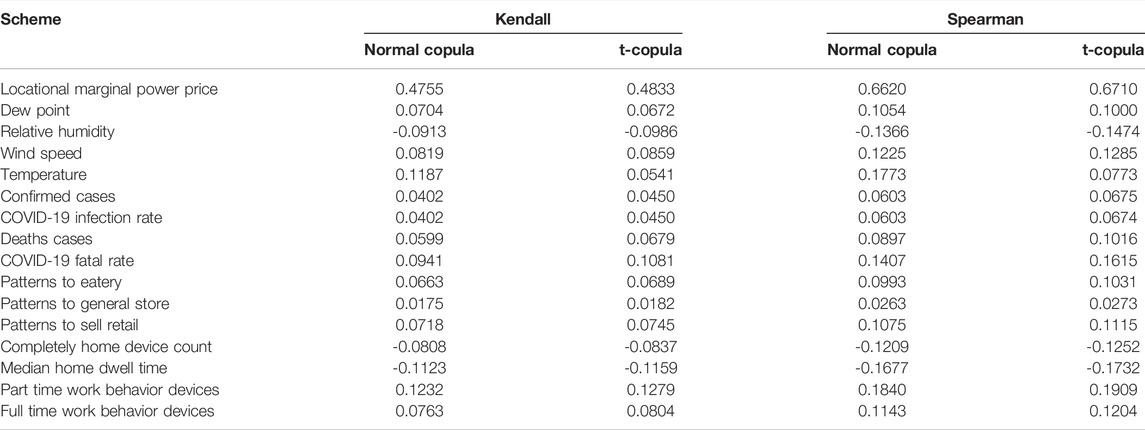
TABLE 1. Correlation analysis between influencing factors and power load during COVID-19.
Then, VMD decomposes the primary short-term power load sequences. Until the center frequency of sub-modal component of the last layer maintains strong stability, the optimal value of mode number K is determined. Through calculation, for COVID-19 specific dataset, optimal modal number K is determined as 6. The decomposition component in Figure 3 shows that the fluctuation frequency increases gradually from IMF1 to IMF6. Among them, very stable IMF1 represents low-frequency components and reveals the trend of the original power load time series’ overall cycle. The intermediate frequency component IMF2-IMF5 contains the original sequence’s details, which reflect the effect of different factors on the electric load time series under different frequencies. The last mode with high frequency and small amplitude fluctuation captures short variations of power load series and reflects white noise in the electric load, indicating that the VMD has completely decomposed the high-frequency part.

FIGURE 3. VMD decomposition results for original time series of power load.
Comparative Analysis
This paper adopts dataset with hourly resolution from 2020 to 2021. All the experimental models run in Python 3.7 programming environment, and super parameters such as maximum depth, learning rate, feature score and so on are set in advance. This section provides three schemes:
1) Scheme 1 is the LightGBM forecasting method with all influencing factors.
2) Scheme 2 is the proposed forecasting method based on copula and VMD.
3) Scheme 3 is the XGBoost, GBDT and SVM method.
Figure 4 and Table 2 show the power load forecasting error and the corresponding comparison calculated through MSE, MAE and MAPE. By comparison with the single LightGBM model, the MAE, MAPE, and RMSE of the proposed VMD-copula-LightGBM method are decreased by 29.46%, 13.06%, and 16.99%. It is thus found that the proposed VMD copula light GBM method can greatly enhance the prediction accuracy by selecting influencing factors with stronger correlation as the input and decomposing the primary electric load time series into stable sub-modal components.
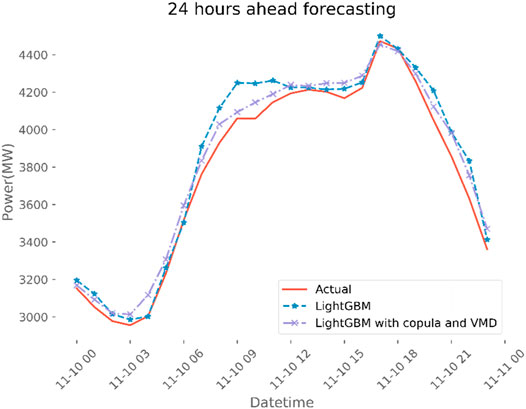
FIGURE 4. Forecasting results with LightGBM algorithm, copula and VMD theory.
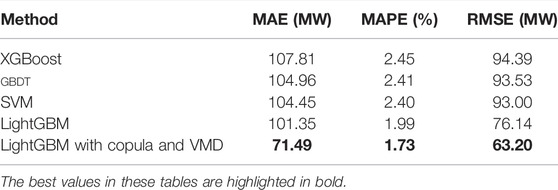
TABLE 2. comparison of evaluation results with three schemes.
The comparisons of SVM, GBDT, LightGBM and VMD-copula-LightGBM methods are displayed in Figure 5. As a result of discarding low correlation factors, the randomness and fluctuation of power load can be reduced. The VMD-copula-LightGBM method performs best in forecasting error, and the MAPE is only 1.73%. On the other hand, using the accessional measured key factors as training set and reducing the non-stationarity of the original power load series by VMD can improve forecasting performance. By comparison with the XGBoost algorithm, the MAE, MAPE, and RMSE of the proposed method are decreased by 33.69%, 29.39% and 33.04%. As for the GBDT method, the proposed method improved the MAE, MAPE, and RMSE decreased by 31.89%, 28.22% and 32.43%. In terms of SVM, the MAE, MAPE, and RMSE of the proposed method are decreased by 31.56%, 27.92% and 32.04%. All in all, the comparative results can demonstrate the superior performance of the proposed VMD-copula-LightGBM method on load forecasting, especially in the context of COVID-19.
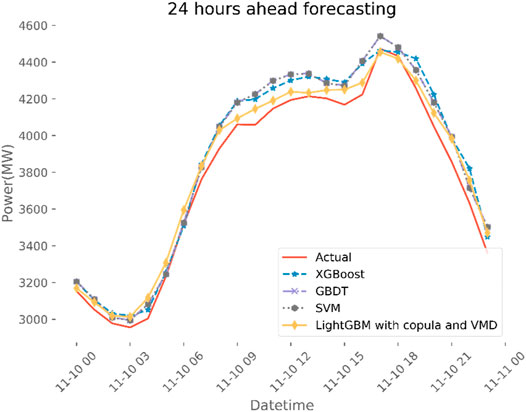
FIGURE 5. Comparison of forecasting results between the proposed scheme and traditional schemes.
Conclusion
In this paper, a short-term load forecasting method in COVID-19 context is proposed on the basis of temporal-spatial model. The forecasting methods are achieved by selecting the best input dataset strongly linked to power load with the aid of copula function, and then decomposing the original complex data into simple sequences with VMD. Comparative analysis has shown the effectiveness and superiority of the proposed temporal-spatial forecasting method. It can be concluded:
1) In addition to being closely related to traditional factors like calendar and weather, the electricity consumption will also be affected by social and economic factors such as COVID-19 confirmed cases, social distance, business rate of shopping malls and so on. In more detail, the accuracy of power load forecasting can be further improved by cross-domain analysis of public safety data, social intervention and mobility data under COVID-19.
2) Based on VMD and Copula theory, the complexity of short-term load forecasting problem can be reduced with the temporal-spatial analysis. The short-term power forecasting accuracy is largely improved compared to the traditional prediction methods, such as GBDT and SVM.
Though satisfying forecasting results can be obtained with the proposed model in COVID-19 context, different countries have different social-economic activities and policies. Along with it comes the more complex feature selection and nonlinear relationships, which would be our future work.
Data Availability Statement
The original contributions presented in the study are included in the article/Supplementary Material, further inquiries can be directed to the corresponding author.
Author Contributions
All authors listed have made a substantial, direct, and intellectual contribution to the work and approved it for publication.
Funding
The authors gratefully acknowledge the support of the National Key Research and Development Program of Hubei Province (2020BHB008), the China Postdoctoral Science Foundation funded project under Grant 2021M692992, and the Fundamental Research Funds for the Central Universities, China University of Geosciences (Wuhan) (No. CUG2106349).
Conflict of Interest
The authors declare that the research was conducted in the absence of any commercial or financial relationships that could be construed as a potential conflict of interest.
Publisher’s Note
All claims expressed in this article are solely those of the authors and do not necessarily represent those of their affiliated organizations, or those of the publisher, the editors and the reviewers. Any product that may be evaluated in this article, or claim that may be made by its manufacturer, is not guaranteed or endorsed by the publisher.
References
Amjady, N. (2001). Short-term Hourly Load Forecasting Using Time-Series Modeling with Peak Load Estimation Capability. IEEE Trans. Power Syst. 16, 498–505. doi:10.1109/59.932287
Che, J., and Wang, J. (2014). Short-term Load Forecasting Using a Kernel-Based Support Vector Regression Combination Model. Appl. Energy 132, 602–609. doi:10.1016/j.apenergy.2014.07.064
Chen, T., and Guestrin, C. (2016). XGBoost: A Scalable Tree Boosting System. In Proceedings of the 22nd acm sigkdd international conference on knowledge discovery and data mining, California, San Francisco, USA, August 2016, 785–794. doi:10.1145/2939672.2939785
Christiaanse, W. (1971). Short-term Load Forecasting Using General Exponential Smoothing. IEEE Trans. Power Apparatus Syst. PAS-90, 900–911. doi:10.1109/tpas.1971.293123
Dragomiretskiy, K., and Zosso, D. (2013). Variational Mode Decomposition. IEEE Trans. Signal Process. 62, 531–544. doi:10.1109/TSP.2013.2288675
Flandrin, P., Rilling, G., and Goncalves, P. (2004). Empirical Mode Decomposition as a Filter Bank. IEEE Signal Process. Lett. 11, 112–114. doi:10.1109/LSP.2003.821662
He, F., Zhou, J., Feng, Z.-k., Liu, G., and Yang, Y. (2019). A Hybrid Short-Term Load Forecasting Model Based on Variational Mode Decomposition and Long Short-Term Memory Networks Considering Relevant Factors with Bayesian Optimization Algorithm. Appl. energy 237, 103–116. doi:10.1016/j.apenergy.2019.01.055
Huang, G. B., Zhu, Q. Y., and Siew, C. K. (2004). Extreme Learning Machine: a New Learning Scheme of Feedforward Neural Networks. IEEE Int. Jt. Conf. Neural Netw. 2, 985–990. doi:10.1109/IJCNN.2004.1380068
Jiang, H., Zhang, Y., Muljadi, E., Zhang, J. J., and Gao, D. W. (2018). A Short-Term and High-Resolution Distribution System Load Forecasting Approach Using Support Vector Regression with Hybrid Parameters Optimization. IEEE Trans. Smart Grid 9, 3341–3350. doi:10.1109/tsg.2016.2628061
Jiang, L., Wang, X., Li, W., Wang, L., Yin, X., and Jia, L. (2021). Hybrid Multitask Multi-Information Fusion Deep Learning for Household Short-Term Load Forecasting. IEEE Trans. Smart Grid 12, 5362–5372. doi:10.1109/TSG.2021.3091469
Lahmiri, S. (2015). Comparing Variational and Empirical Mode Decomposition in Forecasting Day-Ahead Energy Prices. IEEE Syst. J. 11, 1907–1910. doi:10.1109/JSYST.2015.2487339
Li, C. (2020). Designing a Short-Term Load Forecasting Model in the Urban Smart Grid System. Appl. Energy 266, 114850. doi:10.1016/j.apenergy.2020.114850
Li, J., Deng, D., Zhao, J., Cai, D., Hu, W., Zhang, M., et al. (2021). A Novel Hybrid Short-Term Load Forecasting Method of Smart Grid Using MLR and LSTM Neural Network. IEEE Trans. Ind. Inf. 17, 2443–2452. doi:10.1109/tii.2020.3000184
Park, S., Jung, S., Jung, S., Rho, S., and Hwang, E. (2021). Sliding Window-Based LightGBM Model for Electric Load Forecasting Using Anomaly Repair. J. Supercomput 77, 12857–12878. doi:10.1007/s11227-021-03787-4
Ruan, G., Wu, D., Zheng, X., Zhong, H., Kang, C., Dahleh, M. A., et al. (2020). A Cross-Domain Approach to Analyzing the Short-Run Impact of COVID-19 on the US Electricity Sector. Joule 4, 2322–2337. doi:10.1016/j.joule.2020.08.017
Shi, Z., Yao, W., Li, Z., Zeng, L., Zhao, Y., Zhang, R., et al. (2020). Artificial Intelligence Techniques for Stability Analysis and Control in Smart Grids: Methodologies, Applications, Challenges and Future Directions. Appl. Energy 278, 115733. doi:10.1016/j.apenergy.2020.115733
Tsai, M.-S., and Hsu, F.-Y. (2010). Application of Grey Correlation Analysis in Evolutionary Programming for Distribution System Feeder Reconfiguration. IEEE Trans. Power Syst. 25, 1126–1133. doi:10.1109/TPWRS.2009.2032325
Wang, J., Wang, J., Li, Y., Zhu, S., and Zhao, J. (2014). Techniques of Applying Wavelet De-noising into a Combined Model for Short-Term Load Forecasting. Int. J. Electr. Power & Energy Syst. 62, 816–824. doi:10.1016/j.ijepes.2014.05.038
Wang, Y., Chen, J., Chen, X., Zeng, X., Kong, Y., Sun, S., et al. (2020). Short-term Load Forecasting for Industrial Customers Based on TCN-LightGBM. IEEE Trans. Power Syst. 36, 1984–1997. doi:10.1109/TPWRS.2020.3028133
Yang, X., Wang, Y., Zhang, Y., Yao, W., and Wen, J. (2022). Impact Analysis of Cyber System in Microgrids: Perspective from Economy and Reliability. Int. J. Electr. Power & Energy Syst. 135, 107422. doi:10.1016/j.ijepes.2021.107422
Yao, W., Wang, L., Xiong, Y., et al. (2022). Interaction Mechanism and Coordinated Control of Commutation Failure Prevention in Multi-Infeed Ultra-HVDC System. Int. Trans. Electr. Energy Syst. 2022, 7088114. doi:10.1155/2022/7088114
Zhang, M., Li, W., and Du, Q. (2018). Diverse Region-Based CNN for Hyperspectral Image Classification. IEEE Trans. Image Process. 27, 2623–2634. doi:10.1109/tip.2018.2809606
Zhang, R., Yao, W., Shi, Z., Zeng, L., Tang, Y., and Wen, J. (2022). A Graph Attention Networks-Based Model to Distinguish the Transient Rotor Angle Instability and Short-Term Voltage Instability in Power Systems. Int. J. Electr. Power & Energy Syst. 137, 107783. doi:10.1016/j.ijepes.2021.107783
Zhao, X., Bai, M., Yang, X., Liu, J., Yu, D., and Chang, J. (2021). Short-term Probabilistic Predictions of Wind Multi-Parameter Based on One-Dimensional Convolutional Neural Network with Attention Mechanism and Multivariate Copula Distribution Estimation. Energy 234, 121306. doi:10.1016/j.energy.2021.121306
Keywords: load forecasting, time series, multi-factor fusion, machine learning, COVID-19
Citation: Liu B, Xu D, Jiang L, Chen S and He Y (2022) A Temporal-Spatial Model Based Short-Term Power Load Forecasting Method in COVID-19 Context. Front. Energy Res. 10:923311. doi: 10.3389/fenrg.2022.923311
Received: 19 April 2022; Accepted: 25 April 2022;
Published: 11 May 2022.
Edited by:
Xiaoshun Zhang, Northeastern University, ChinaCopyright © 2022 Liu, Xu, Jiang, Chen and He. This is an open-access article distributed under the terms of the Creative Commons Attribution License (CC BY). The use, distribution or reproduction in other forums is permitted, provided the original author(s) and the copyright owner(s) are credited and that the original publication in this journal is cited, in accordance with accepted academic practice. No use, distribution or reproduction is permitted which does not comply with these terms.
*Correspondence: Da Xu, eHVkYUBjdWcuZWR1LmNu