 Dong Wang
 Yongming Li2
- 1New Energy Project Department of Changqing Oilfield Branch of China National Petroleum Corporation, Xi’an, China
- 2State Key Laboratory of Oil and Gas Reservoir Geology and Development Engineering, Southwest Petroleum University, Chengdu, China
- 3Changqing Oilfield Company Sulige South Operation Branch of China National Petroleum Corporation, Xi’an, China
Field production data indicate that the shale gas production rate decreases sharply after a few years of the first fracking. Feasible enhanced gas recovery (EGR) approaches are very necessary to be investigated. In this study, we compared re-fracturing with a huff-n-puff gas injection scheme in a shale gas reservoir for EGR. A fully compositional simulation approach coupled with a dual porosity and dual permeability model is used. The gas production performances by using different fracturing fluids (i.e., slickwater and supercritical CO2) are evaluated. The effects of huff-n-puff parameters and matrix permeability on the gas production rate and carbon sequestration are investigated. The results show that using a re-fracturing approach yields a better recovery performance than the huff-n-puff gas injection method. Re-fracturing using supercritical CO2 performs better than using slickwater because the former can create complex three-dimensional fracture networks. Huff-n-puff CO2 injection can enhance the gas recovery effectively in ultra-tight formations. In a relatively high permeable formation, viscous flow instead of adsorption-desorption isotherms becomes the primary mass transfer mechanisms, resulting in a lower gas recovery. Both the re-fracturing treatment and huff-n-puff CO2 injection are profitable from a long-term cash flowback perspective.
Introduction
Driven by the long horizontal well and multi-stage hydraulic fracture, gas has been successfully produced from the ultra-tight shale reservoirs. In the United States, dry shale gas production takes up 79% of the total dry natural gas market share in 2021 (EIA 2022). In China, the identified shale gas resources reach 402.62 billion cubic meters. Shale gas production achieved 23 billion cubic meters in 2021, but field data from different shale gas plays invariably indicated a sharp decrease in the production rate after a few years of first fracking (Baihly et al., 2010). Re-fracturing treatment has been proposed as a practicable enhancing gas recovery (EGR) approach in such reservoirs. Different studies were conducted to examine the feasibility of re-fracturing from the technical level and economic perspective (French, S et al., 2014; Eshkalak et al., 2014a; 2014b). Re-fracturing treatment is defined as the following concepts: 1) re-fracking the closed fractures and using the high-strength fractured sand to support the cracks and restore the recovery; 2) using temporary plugging additive to plug the old fractures and forcing the fracturing fluid to flow to unblocked paths to create new cracks; 3) sealing the original perforation clusters to produce new perforation clusters; and 4) reserving the original perforation clusters and adding new perforation clusters in originally fractured horizontal wells to re-stimulate low permeability reservoirs and revive gas production (Sheng et al., 2019; Huang et al., 2021; Liu et al., 2021; Xu et al., 2021; Deng et al., 2022).
In addition to re-fracturing treatment, enhancing gas recovery with CO2 injection is also redeemed as a potential enhancing gas recovery approach. CO2 has a preferential adsorption over CH4 in organic-rich shale reservoirs. Experimental results show that the adsorption capacity of CO2 is two to five times larger than that of CH4 and one order of magnitude smaller than that in coalbed (Nuttal, 2010; Chareonsuppanimit et al., 2012; Heller and Zoback, 2014; Chen et al., 2018). CO2 injection into shale reservoirs can not only improve natural gas production through CO2 adsorption and CH4 desorption but also realize the underground carbon sequestration. Shale gas formation is analogous to coalbed methane reservoirs from the perspective of methane occurring status in tight organic-rich formations (Jenkins and Boyer, 2008; Ross and Bustin, 2009). The sorbed gas content in the shale gas reservoir is relatively smaller than coalbed methane reservoirs. In the shale matrix, the gas occurs in the adsorbed status in organic nano-pores and exists in the free status in inorganic micro-pores and micro-fractures. The physio-chemical differences between the two types of formations are tabulated in Table 1 (Du and Nojabaei,2019). In the past, CO2 injection into coalbed reservoirs has been extensively studies. Coalbed methane resources have also been commercially recovered in many countries through the gas injection technique (Marvor et al., 2004; Gunter et al., 2005; Fujioka et al., 2010). However, only a few filed pilots were performed in shale gas formations (Nuttall et al., 2005; Louk et al., 2017). Nuttall et al. (2005) conducted an in situ test of CO2 geological sequestration in the Devonian Ohio Shale, located at eastern Kentucky. Almost 100 tons of CO2 was planned to be injected into a vertical well. However, the injection has been forced to suspend, owing to a packer failure. Louk et al. (2017) performed a small-scale field pilot of the CO2 huff-n-puff gas injection in the Chattanooga Shale formation, Tennessee. In this project, up to 510 tons of CO2 was targeted injected into the formation from the depth of 777.2–1120.1 m. After shut-in for 4 months, the gas flow rate was eight times larger than before in the first month. More valuable natural gas liquid (ethane, propane, and butane) was brought out with CO2 and methane. By the end of 17 months, more than 59% of injected CO2 was successfully stored in the formation. This CO2 injection test is the first successful field trial in shale gas formation.
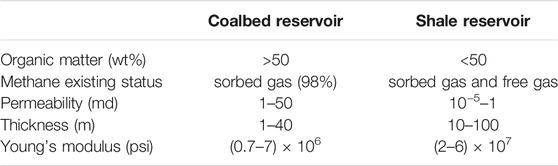
TABLE 1. Physio-chemical differences of the coalbed methane reservoir and the shale gas reservoir.
Different simulation studies were performed to examine the effect of CO2 injection in shale gas formation for enhancing natural gas recoveries. Yu et al. (2014) found the huff-n-puff CO2 injection approach was unable to improve methane recovery in shale formation (matrix permeability is 500 nD). They concluded that a large amount of injected CO2 (almost 96%) flowed back with natural gas instead of being stored in the reservoir in an adsorbed status. Huang et al. (2020) developed a multi-continuum simulation model by distinguishing the molecular transport mechanisms in organic and inorganic matter. Both the gas flooding and huff-n-puff gas injection schemes were performed in an organic-rich shale gas reservoir. The results showed that the injected CO2 in inorganic pores were quickly being reproduced without displacing the adsorbed CH4. Meanwhile, they also found that CO2 flooding is not favorable for enhancing gas recovery in an ultra-tight formation, owing to the low injectivity. CO2 huff-n-puff showed a better performance than gas flooding, and more than 50% of the injected CO2 was successfully sequestrated in the reservoir. Du and Nojabaei (2020;2021) included the nano-confinement effect to calculate the diffusion coefficient of CO2 in a shale gas reservoir and optimized the huff-n-puff gas injection parameters.
In the past, few attempts have been made to compare refracturing with the huff-n-puff gas injection scheme in a shale gas reservoir for EGR. Meanwhile, there is a lack of extensive investigation about the economic differences of these two well stimulation EGR approaches. The primary objective of this work was to examine and compare the re-fracturing and huff-n-puff CO2 injection approaches to improving gas productions and economic perspectives. The CO2 sequestration potential in shale formation is also evaluated. A fully compositional simulation approach coupled with a dual-porosity dual-permeability model is used. The differences in adsorption capacities of CO2 and methane in the shale matrix are considered. The effects of different fracturing fluids, huff-n-puff cycles, and matrix permeabilities on shale gas recovery are also investigated.
Materials and Methods
In this study, a fully compositional simulation approach is used to study the shale gas production. Based on the mass balance equation, the governing equation is shown as follows:
where
The Peng–Robinson equation of state is used to calculate the phase compositions and gas compressibility factors, and the cubic equation is shown as follows:
where
The classical Langmuir adsorption isotherm is used to calculate the adsorption or desorption of methane and carbon dioxide. The equation is shown as follows:
where b is the Langmuir adsorption constant, and Vm is the maximal adsorbed mass. For methane and carbon dioxide, the two parameters that are used in this study are listed in Table 2.
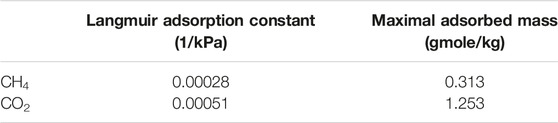
TABLE 2. Adsorption parameters of methane and carbon dioxide.
The net present value (NPV) of a horizontal well is calculated as per Eshkalak et al. (2014):
where
Simulation Model
In this section, we compared re-fracturing with CO2 huff-n-puff injection in a fractured tight shale reservoir for enhancing gas production. The shale reservoir is a 3-D cubic model with 2400 m in length, 900 m in width, and 70 m in thickness. The initial reservoir pressure is 28.7 MPa. The matrix permeability is 0.125 µD, and the porosity is 0.031. The shale reservoir properties are tabulated in Table 3. A horizontal well is located in the center with 1800 m in length.
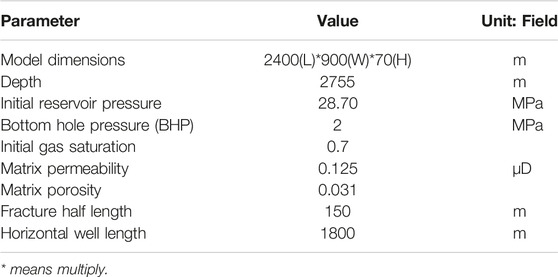
TABLE 3. Shale reservoir simulation model.
The reservoir is initially subjected to fracking with six stages. The fracture half-length is 150 m. After gas production for 5 years, the reservoir is re-fractured. The schematic diagram is shown in Figure 1. Here, we compared two fracture fluids, i.e., supercritical carbon dioxide and water in the re-fracturing scheme. Normally, the cracks extend along a flat plane when using water as the fracture fluid. Using supercritical CO2 as the fracture fluid generally create cracks extending three dimensions, and the breakdown pressure is lower than the hydraulic fracturing. Given that using critical the CO2 fracture creates a more complex fracture network, we added the natural fracture in the CO2 fracturing scheme. The effective permeabilities of the hydraulic fracture and supercritical CO2 fracture are listed in Table 4. When using supercritical CO2 as the fracture fluid, after generating the fractures, we injected CO2 for 1 month prior to production to account for the remaining CO2 during the fracturing process.
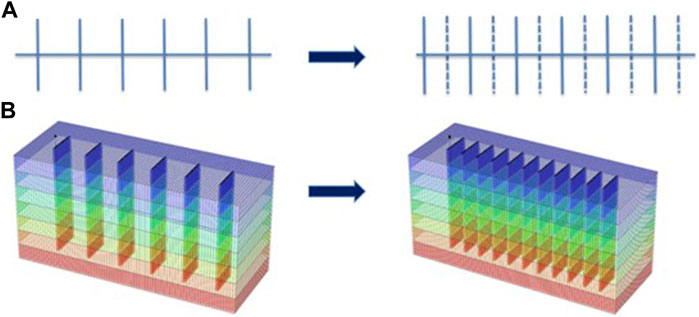
FIGURE 1. (A) Schematic diagram and (B) 3-D simulation diagram of the reservoir re-fractured by adding five more stages evenly.
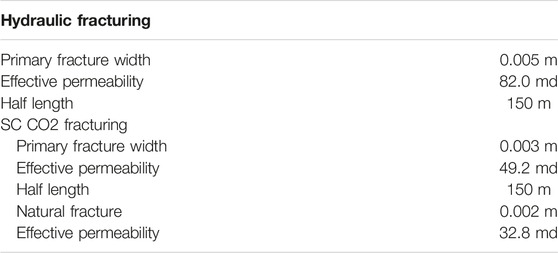
TABLE 4. Fracture properties of the hydraulic fracture and supercritical CO2 fractures.
Results and Discussion
In this section, we investigated re-fracturing and gas injection methods for enhancing gas recovery and compared the production performance with the base case, i.e., initially fractured with six stages. Two simulation schemes are separately conducted, i.e., fracking with slickwater and fracking with supercritical CO2. It should be noted that in the case of re-fracturing with supercritical CO2, the initial fracture is also created by using supercritical CO2 as the fracturing fluid. The fracture properties by using the two types of fracturing fluids are listed in Table 3. The simulation results of cumulative gas recovery are plotted in Figure 2.
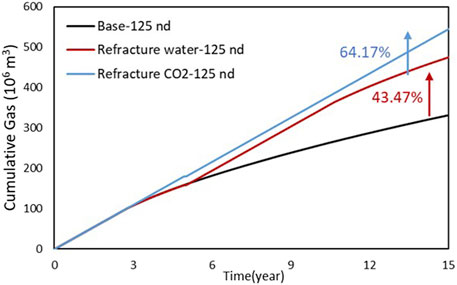
FIGURE 2. Cumulative gas production of the base case, fracturing with slickwater, and fracturing with CO2 when the matrix permeability is 125 nd.
The pressure distributions of the base case (after 15 years), prior to re-fracturing (at the 5th year), and the cases of fracturing with slickwater and supercritical CO2, respectively, (after 15 years) are shown in Figure 3. The results showed that re-fracturing allows more gas between the previous two stages to be produced and significantly reduces the residual oil.
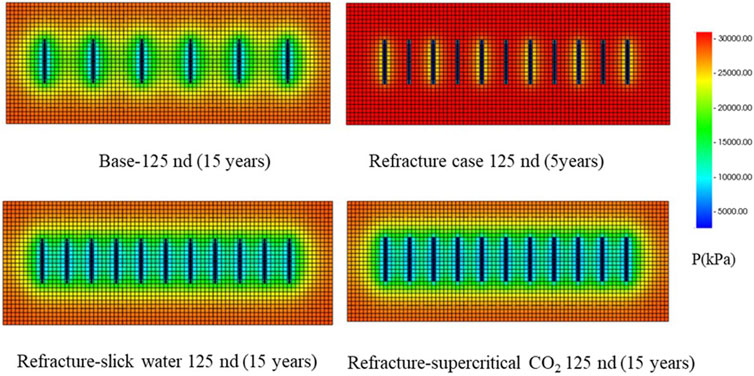
FIGURE 3. Pressure distributions of the base case (after 15 years), prior to re-fracturing (at the 5th year), and the cases of fracturing with slickwater and supercritical CO2, respectively, (after 15 years).
The results showed that re-fracturing significantly improves the gas production. After producing for 15 years, using slickwater and supercritical CO2 as fracturing fluids can improve the gas recovery production by 43.47 and 64.17%, respectively. Using supercritical CO2 as the fracturing fluid to frack the formation yields more gas production. This is because that CO2 create more extended three-dimensional cracks. For a very tight formation (permeability: 0.125 nd), complex fracture networks are very important for gas migration from the tight matrix to the main fracture.
In the huff-n-puff CO2 injection method, the reservoir is initially fractured with six stages. Two schemes are conducted, i.e., one cycle and two cycles of huff-n-puff. In one cycle of huff-n-puff, after primary production for 5 years, CO2 is injected at 100,000 m3/d for 1 year, and then, the well is shut-in for 1 year. After 1-year soaking time, the well is re-produced for 8 years. In two cycles of huff-n-puff, CO2 is re-injected at 100,000 m3/d for 1 year at the 10th year, followed with 1-year soaking time. Then, the well is re-producing for 3 years. The simulation results are plotted in Figure 4. The results showed that the cumulative gas production is improved by 32.85 and 14.71% corresponding to one cycle and two cycles of huff-n-puff, respectively. One cycle of gas injection performs better than two cycles. One reason is that in two cycles of the gas injection scheme, twice of injection time and soaking time occupies too much of the total production time. Given that the produced gases include not only methane but also injected CO2, we also plotted the produced pure methane in Figure 5.
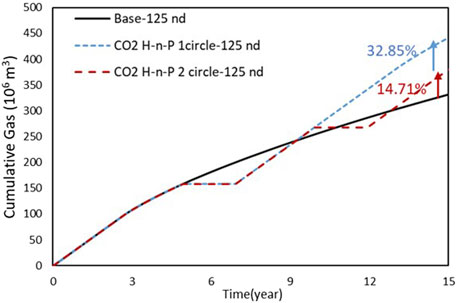
FIGURE 4. Cumulative gas production of the base case, CO2 huff-n-puff with one cycle, and CO2 huff-n-puff with two cycles when the matrix permeability is 125 nd.
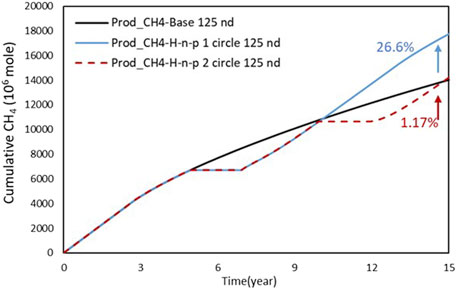
FIGURE 5. Cumulative methane production of the base case, CO2 huff-n-puff with one cycle, and CO2 huff-n-puff with two cycles when the matrix permeability is 125 nd.
The results show that the produced pure methane is increased by 26.6 and 1.17% for one cycle and two cycles of huff-n-puff, respectively. It means that CO2 injection indeed shows the ability to increase methane production. To investigate the CO2 sequestration potential, we also plotted the total moles of injected CO2 and produced CO2 in Figure 6 and calculated the percentage of sequestrated CO2 in the reservoir.
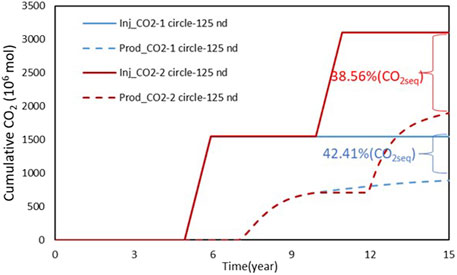
FIGURE 6. Cumulative injection and production of CO2 of the huff-n-puff with one cycle and CO2 huff-n-puff with two cycles when the matrix permeability is 125 nd.
A total of 42.41 and 38.6% of CO2 is successfully sequestrated in the reservoir at the end of 15 years for one cycle and two cycles of gas injection schemes, respectively. The results show that CO2 can replace the adsorbed methane from the tight shale matrix, owing to its stronger adsorption potential. A large amount of injected CO2 is successfully stored in the reservoir. This shows that the tight shale matrix is a huge potential geological sequestration site. A sensitivity analysis is conducted to investigate the matrix permeability on gas production and CO2 sequestration performances. The results are plotted in Figure 7. When the matrix permeability is 500 nd, the huff-n-puff gas injection schemes yield a lower gas production than the base case. The gas recoveries are reduced by 13.33 and 26.66% for one cycle and two cycles of gas injection, respectively. Given that the produced gas contains injected CO2, we also calculated the produced pure methane in Figure 7B. The results show that the recoveries of pure methane are decreased by 18.61 and 36.47%, respectively. It indicates that CO2 huff-n-puff in a higher permeability reservoir is not very feasible in improving the gas production. One reason is that the Darcy’s flow plays the most important role in gas transport in a not-too-tight formation. Gas is displaced driven by the pressure gradient. The effect of adsorption-desorption becomes less crucial in a relatively high-permeable formation. We also plotted the sequestrated amount of CO2 in Figure 7C. The sequestrated CO2 is 20.96 and 26.48% for one cycle and two cycles of huff-n-puff gas injection, respectively. Compared to tighter formation (permeability = 125 nd), the sequestrated amount of CO2 is much reduced. It means a lot amount of CO2 is re-produced after shut-in time. The results show that a tighter formation is more suitable for CO2 huff-n-puff gas injection from the view of enhancing gas recovery and CO2 geological sequestration.
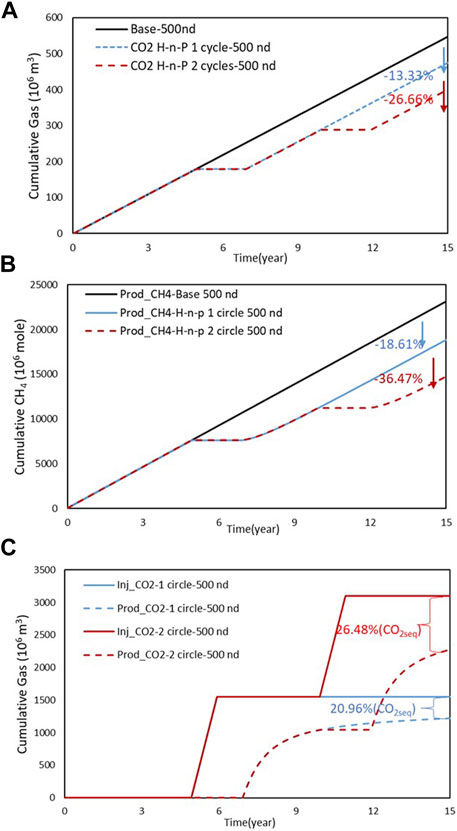
FIGURE 7. (A) Cumulative gas production and (B) cumulative methane production of the base case, CO2 huff-n-puff with one cycle, and CO2 huff-n-puff with two cycles. (C) Cumulative injection and production of CO2 of the huff-n-puff with one cycle and CO2 huff-n-puff with two cycles when the matrix permeability is 500 nd.
To compare re-fracturing and huff-n-puff gas injection schemes on improving gas recovery, we also tabulated the produced gas and increased gas recovery in Table 5. The matrix permeability is 125 nd. Overall, using the refracturing approach can produce more gas than the huff-n-puff gas injection method. One possible reason is that in the huff-n-puff gas injection process, the gas injection and shut-in process takes up 2 years of the total production time (10 years), leaving the production process shorter. Another finding is that re-fracturing with supercritical CO2 shows the best performance among all the cases.
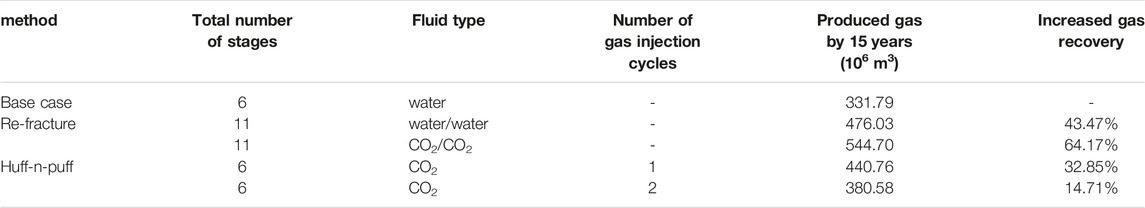
TABLE 5. Comparison of re-fracturing and huff-n-puff gas injection schemes on improving gas recovery.
To evaluate the huff-n-puff gas injection scheme on carbon sequestration performance, we also calculated the total injected CO2, total re-produced CO2, and the sequestrated percentage of CO2, as shown in Table 6. At a tighter shale matrix, more CO2 can be stored in the reservoir instead of being re-produced. This is because the adsorption-desorption isotherm plays a more important role than the viscous flow. Meanwhile, one cycle of gas injection in a tighter formation is more favorable in a tighter shale matrix than a higher permeable matrix in terms of carbon sequestration.
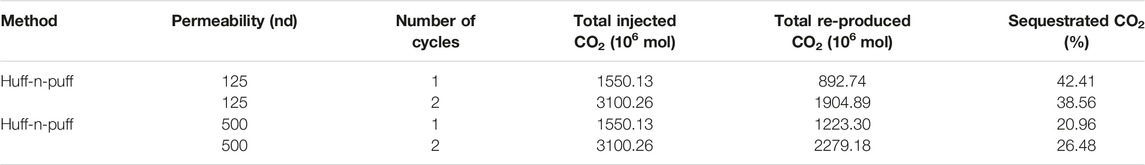
TABLE 6. Total injected CO2, total re-produced CO2, and the sequestrated percentage of CO2 in the reservoir for huff-n-puff gas injection schemes at permeabilities of 125 nd and 500 nd, respectively.
The costs of drilling, fracturing, and gas prices are listed in Table 7. We calculated the NPV of cash flow for the base case, re-fracturing case, and CO2 huff-n-puff injection case by 10 and 15 years. The results are plotted in Figure 8. The results show that after producing for 10 years, the differences of NPV among the five cases (the base case, re-fracturing with slickwater and supercritical CO2, huff-n-puff with one and two cycles) are not very significant. However, after 15 years of production, re-fracturing with CO2 yields the largest NPV, followed by re-fracturing with slickwater. Despite the fact that the NPV of CO2 huff-n-puff gas injection is lower than that of the re-fracturing schemes, it is still higher than the base case. In other words, both re-fracturing treatment and huff-n-puff CO2 injection are profitable from a long-term cash flow perspective.
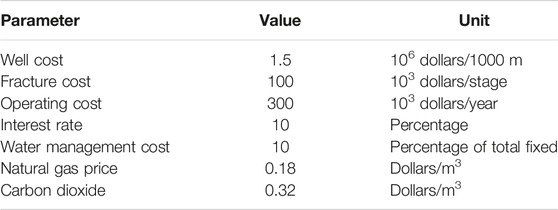
TABLE 7. Costs of fracturing treatment and gas prices.
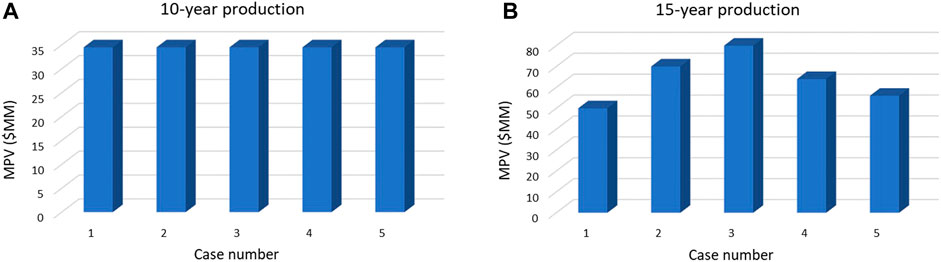
FIGURE 8. (A) The NPV of five cases at 10 years and (B) The NPV of five cases at 15 years (Case 1: base case; Case 2: Re-fracturing with slick water; Case 3: Re-fracturing with SC CO2; Case 4: CO2 Huff-n-puff with one cycle; Case 5: CO2 huff-n-puff with two cycles).
Conclusion
In this study, we compared re-fracturing with the huff-n-puff gas injection scheme in a shale gas reservoir for EGR. A fully compositional simulation approach coupled with a dual-porosity dual-permeability model is used. EGR approaches are initiated after 5 years of first fracking. The following conclusion is addressed:
• Using refracturing approach yields a better recovery performance than the huff-n-puff gas injection method.
• Re-fracturing using slickwater and supercritical CO2 can improve the gas production by 43.47 and 64.17%, respectively, compared to the base case without re-fracturing;
• Huff-n-puff CO2 injection can enhance the gas recovery effectively in ultra-tight formations (permeability is 125 nd). The less the cycle numbers, the more gas production is achieved;
• Huff-n-puff CO2 injection is not feasible in a high-permeable formation. One possible reason is that the viscous flow instead of adsorption-desorption isotherms becomes the primary mechanisms in mass transfer;
• More than 40% of injected CO2 can be successfully sequestrated in a tight shale gas formation (125 nD) with one cycle of huff-n-puff injection process;
• Both re-fracturing treatment and huff-n-puff CO2 injection are profitable from a long-term cash flowback perspective.
Data Availability Statement
The original contributions presented in the study are included in the article/Supplementary Material, further inquiries can be directed to the corresponding author's.
Author Contributions
DW was responsible for conceptualization, methodology, and writing; YL was responsible for data curation, and formal analysis; BW was responsible for simulation analysis; JS was responsible for visualization and supervision, and LD was responsible for writing and data analysis.
Conflict of Interest
Author DW was employed by the New Energy Project Department of Changqing Oilfield Branch of China National Petroleum Corporation. Authors BW, JS, and LD were employed by the Changqing Oilfield Company Sulige South Operation Branch of China National Petroleum Corporation.
The remaining authors declare that the research was conducted in the absence of any commercial or financial relationships that could be construed as a potential conflict of interest.
Publisher’s Note
All claims expressed in this article are solely those of the authors and do not necessarily represent those of their affiliated organizations, or those of the publisher, the editors, and the reviewers. Any product that may be evaluated in this article, or claim that may be made by its manufacturer, is not guaranteed or endorsed by the publisher.
References
Baihly, J., Altman, R., Malpani, R., and Luo, F. (2010) Shale Gas Production Decline Trend Comparison over Time and Basins. Paper SPE 135555 Present at the SPE Annual Technical Conference and Exhibition, Florence, Italy. 19−22 September 2010,
Chareonsuppanimit, P., Mohammad, S. A., Robinson, R. L., and Gasem, K. A. M. (2012). High-pressure Adsorption of Gases on Shales: Measurements and Modeling. Int. J. Coal Geol. 95, 34–46. doi:10.1016/j.coal.2012.02.005
Chen, T., Feng, X.-T., and Pan, Z. (2018). Experimental Study on Kinetic Swelling of Organic-Rich Shale in CO2, CH4, and N2. J. Nat. Gas Sci. Eng. 55, 406–417. doi:10.1016/j.jngse.2018.04.027
Deng, H., Sheng, G., Zhao, H., Meng, F., Zhang, H., Ma, J., et al. (2022). Integrated Optimization of Fracture Parameters for Subdivision Cutting Fractured Horizontal Wells in Shale Oil Reservoirs. J. Petroleum Sci. Eng. 212, 110205. doi:10.1016/j.petrol.2022.110205
Du, F., and Nojabaei, B. (2019). A Review of Gas Injection in Shale Reservoirs: Enhanced Oil/gas Recovery Approaches and Greenhouse Gas Control. Energies 12 (12), 2355. doi:10.3390/en12122355
Du, F., and Nojabaei, B. (2020). Estimating Diffusion Coefficients of Shale Oil, Gas, and Condensate with Nano-Confinement Effect. J. Petroleum Sci. Eng. 193 (1), 107362. doi:10.1016/j.petrol.2020.107362
Du, F., and Nojabaei, B. (2021). A Diffusion-Based Compositionally-Extended Black Oil Model to Investigate Produced Gas Re-injection EOR in Eagle Ford. Fuel 306 (2), 121711. doi:10.1016/j.fuel.2021.121711
Eshkalak, M. O., Al-Shalabi, E. W., Sanaei, A., Aybar, U., and Sepehrnoori, K. (2014) Enhanced Gas Recovery by CO2 Sequestration versus Re-fracturing Treatment in Unconventional Shale Gas Reservoirs. In: Paper SPE 172083 Presented at the Abu Dhabi International Petroleum Exhibition and Conference, Abu Dhabi, UAE. 10‒13 November 2014,
Eshkalak, M. O., Aybar, U., and Sepehrnoori, K. (2014a). An Economic Evaluation of the Re-fracturing Treatment of the U.S. Shale Gas Resources. In: Paper SPE 171009 Presented at the SPE Eastern Regional Meeting, Charleston, WV, USA. 21–23 October.
French, S., Rodgerson, J., and Feik, C. (2014). Re-fracturing Horizontal Shale Wells: Case History of a Woodford Shale Pilot Project. In: Paper SPE 168607 Presented at the SPE Hydraulic Fracturing Technology Conference, Woodlands, Texas, USA. 4−6 February.
Fujioka, M., Yamaguchi, S., and Nako, M. (2010). CO2-ECBM Field Tests in the Ishikari Coal Basin of Japan. Int. J. Coal Geol. 82, 287–298. doi:10.1016/j.coal.2010.01.004
Gunter, W. D., Mavor, M. J., and Robinson, J. R. (2005). CO2 Storage and Enhanced Methane Production: Field Testing at Fenn-Big Valley, Alberta, Canada, with Application. In: Proceedings of 7th Conference on Greenhouse Gas Control Technologies, Vancouver, Canada. 5−9 September.
Heller, R., and Zoback, M. (2014). Adsorption of Methane and Carbon Dioxide on Gas Shale and Pure Mineral Samples. J. Unconv. Oil Gas Resour. 8, 14–24. doi:10.1016/j.juogr.2014.06.001
Huang, J., Jin, T., Barrufet, M., and Killough, J. (2020). Evaluation of CO2 Injection into Shale Gas Reservoirs Considering Dispersed Distribution of Kerogen. Appl. Energy 260 (12), 114285. doi:10.1016/j.apenergy.2019.114285
Huang, L., Sheng, G., Li, S., Tong, G., Wang, S., Peng, X., et al. (2021). A Review of Flow Mechanism and Inversion Methods of Fracture Network in Shale Gas Reservoirs. Geofluids 2021, 6689698. doi:10.1155/2021/6689698
Jenkins, C. D., and Boyer, C. M. (2008). Coalbed- and Shale-Gas Reservoirs. J. Pet. Technol. 60, 92–99. doi:10.2118/103514-ms
Liu, J., Lu, M., and Sheng, G. (2021). Description of Fracture Network of Hydraulic Fracturing Vertical Wells in Unconventional Reservoirs. Front. Earth Sci. 9, 749181. doi:10.3389/feart.2021.749181
Louk, K., Ripepi, N., Luxbacher, K., Gilliland, E., Tang, X., Keles, C., et al. (2017). Monitoring CO2 Storage and Enhanced Gas Recovery in Unconventional Shale Reservoirs: Results from the Morgan County, Tennessee Injection Test. J. Nat. Gas Sci. Eng. 45, 11–25. doi:10.1016/j.jngse.2017.03.025
Mavor, M. J., Gunter, W. D., and Robinson, J. R. (2004) Alberta Multiwell Micro-pilot Testing for CBM Properties, Enhanced Methane Recovery. In: Paper SPE 90256 Presented at the SPE Annual Technocal Conference and Exhibition, Houston, Texas. 26‒29 November.
Nuttal, B. C. (2010). Reassessment of CO2 Sequestration Capacity and Enhanced Gas Recovery Potential of Middle and Upper Devonian Black Shales in the Appalachian Basin. Proceedings of the MRCSP Phase II Topical Report. Lexington, Kentucky. 2005 October‒2010 October. Available online: https://irp-cdn.multiscreensite.com/5b322158/files/uploaded/topical_4_black_shale.pdf.
Nuttall, B. C., Eble, C. F., Drahovzal, J. A., and Bustin, R. M. (2005)“Analysis of Devonian Black Shales in Kentucky for potential carbon dioxide sequestration and enhanced natural gas production,” in Greenhouse Gas Control technologies 7; Report Kentucky Geological Survey/University of Kentucky (DE-FC26-02NT41442), Amsterdam, Netherlands, Elsevier Science Ltd..
Ross, D. J. K., and Marc Bustin, R. (2009). The Importance of Shale Composition and Pore Structure upon Gas Storage Potential of Shale Gas Reservoirs. Mar. Petroleum Geol. 26, 916–927. doi:10.1016/j.marpetgeo.2008.06.004
Sheng, G., Su, Y., and Wang, W. (2019). A New Fractal Approach for Describing Induced-Fracture Porosity/permeability/Compressibility in Stimulated Unconventional Reservoirs. J. Petroleum Sci. Eng. 179, 855–866. doi:10.1016/j.petrol.2019.04.104
U.S. Energy Information Administration (EIA), (2022), How Much Shale Gas is Produced in the United States?
Xu, Y., Sheng, G., Zhao, H., Hui, Y., Zhou, Y., Ma, J., et al. (2021). A New Approach for Gas-Water Flow Simulation in Multi-Fractured Horizontal Wells of Shale Gas Reservoirs. J. Petroleum Sci. Eng. 199, 108292. doi:10.1016/j.petrol.2020.108292
Keywords: shale gas, re-fracture treatment, CO2 huff-n-puff injection, CO2 sequestration, EGR approaches
Citation: Wang D, Li Y, Wang B, Shan J and Dai L (2023) Re-Fracturing vs. CO2 Huff-n-Puff Injection in a Tight Shale Reservoir for Enhancing Gas Production. Front. Energy Res. 10:922860. doi: 10.3389/fenrg.2022.922860
Received: 18 April 2022; Accepted: 18 May 2022;
Published: 06 January 2023.
Edited by:
Xun Zhong, Yangtze University, ChinaReviewed by:
Fengshuang Du, China University of Geosciences Wuhan, ChinaJingwei Huang, Texas AM University, United States
Copyright © 2023 Wang, Li, Wang, Shan and Dai. This is an open-access article distributed under the terms of the Creative Commons Attribution License (CC BY). The use, distribution or reproduction in other forums is permitted, provided the original author(s) and the copyright owner(s) are credited and that the original publication in this journal is cited, in accordance with accepted academic practice. No use, distribution or reproduction is permitted which does not comply with these terms.
*Correspondence: Dong Wang, NTQyMzI0OTg5QHFxLmNvbQ==