- 1State Key Laboratory of Offshore Oil Exploitation, Beijing, China
- 2CNOOC Research Institute Ltd., Beijing, China
The water sweep efficiency is an important parameter in oilfield development. The present method needs to fit the core relative permeability curve, which has the problem of low accuracy and poor practicability. Based on three kinds of calculation formulas of water saturation, the calculation method of limit water sweep efficiency is put forward, and the dynamic method of two parameters in the index relationship between oil-water relative permeability ratio and water saturation is established. On this basis, the dynamic calculation method of sweep efficiency, oil displacement efficiency and oil-water relative permeability curve is formed, which overcomes the dependence on core permeability curve. The XJ oilfield calculation shows that for the south china sea marine sandstone oil field with abundant side water, the oil production is mainly from the water flooding region expansion in the initial oilfield developed period and then change to enhance oil displacement efficiency as the water sweep efficiency is to be stable, so the development policy of this oilfield should be to perfect production patterns nets in the initial oilfield developed period, then be to installe larger pumps and increase liquid production in the middle-later developed period. The proposed method is featured with accessible date, convenient calculation, showing a broad application prospect in dynamic analysis and development effect evaluation of oilfield.
Introduction
The relative permeability of oil and water is a parameter to measure the ability of oil and water to flow in the pore’s media, which is a key parameter in oilfield development. The relative permeability is influenced by the reservoir’s pore structure, surface wettability, fluid composition, and physical properties.
The relative permeability of oil and water can be measured by core flooding experiments in laboratory, which can be divided into steady state method and unsteady state method (Barenblatt et al., 2003; Aryana and Kovscek, 2013). However, these two experimental methods have certain shortcomings. Steady-state methods usually consume a lot of time to obtain a set of data. Unsteady-state methods have certain limitations in data interpretation. In addition, due to the very high requirements on measurement accuracy, it is difficult to accurately obtain the relative permeability of oil and water under formation conditions with existing experimental techniques (Civan and Donaldson, 1989; Jahanbakhshi et al., 2015).
Therefore, based on experimental data and certain assumptions, many mathematical models have been proposed to predict relative permeability, which can assist the reservoir dynamic analysis and development prediction for the reservoirs without experimental data (Purcell, 1949; Guler et al., 2003). Among them, the linear model proposed by Craft et al. (Craft et al., 1959) in 1959 has received extensive attention. Through the analysis of a large number of experimental data, Craft et al. found that the oil-water relative permeability ratio kro/krw has a good linear relationship with water saturation in a semi-logarithmic plot. The model is simple and practical, and many methods are extended based on this model for the dynamic analysis of water-flooding reservoirs.
Based on the linear correlation between ln(kro/krw) and Sw, combined with the B-L equation (Buckley and Leverett, 1942) and the Welge equation (Welge, 1952), many different types of water flooding curves are proposed. Among these water flooding curves, Type-A and -B are the most commonly used. Type-A describes the linear relationship between cumulative oil production (Np) and cumulative water production (WP) on a semi-logarithmic scale, while Type-B curves describe the water-oil ratio (WOR) and Np on a semi-logarithmic scale The linear relationship in the graph. After practical verification in a large number of oil fields (Yu, 2000), Type-A and B have been recognized as industry standards.
The water flooding curve predicts the reservoir/single well dynamics based on the most conventional production data such as cumulative oil production and cumulative liquid production of the reservoir/single well. Compared with laboratory core experiments, logging data, and other tests, the water flooding curves reflect the actual flow dynamics of the reservoir more realistically. Water flooding curves have been widely used in oilfield development, such as the analysis of reservoir volume conformance efficiency and the calculation of reservoir relative permeability curve.
The volume conformance efficiency of water-flooding reservoirs is an important indicator to evaluate the development of water-flooding oilfields. It can provide a reference for further reservoir development strategies. In order to accurately evaluate the volume conformance efficiency of water-flooding reservoirs, various methods have been proposed including numerical simulation method (Zhu et al., 1998), image recognition method (Wang et al., 2006), and water flooding curve method. Among them, the water flooding curve method is widely used because the data is directly collected from the field. Also, the water flooding curve can more objectively evaluate the macroscopic performance of the entire reservoir, when compared with the other methods. A method to calculate water flooding volume conformance efficiency has been proposed by considering the oil displacement efficiency of the water sweep area as a fixed value (Chen and Guo, 2007). From the macroscope, the oil displacement efficiency is changing with the oilfield development. Thus, by assuming the water saturation at the outlet end as the same as the average water saturation in the oil-water two-phase region (Hu, 2013), the quantitative relationship between oil displacement efficiency and volume conformance efficiency is established based on the water flooding curve.
Similarly, by regarding the water saturation at the outlet end as the same as the average water saturation in the oil-water two-phase zone, a method to calculate the oil-water phase permeability curve has been proposed based on the water flooding curve (Liang et al., 2005; Wang et al., 2005; Lv et al., 2009; Yang et al., 2010; Du et al., 2013; Jin, 2015; Yuan et al., 2018). With this method, the inversion of the oil-water relative permeability curve from production data is realized.
In fact, the water saturation at the outlet end and the average water saturation in the oil-water two-phase zone can only be approximately equal in the ultra-high water-cut period, and the two are not equal in most oilfield development stages. Simply assuming the water saturation at the outlet end is equivalent to oil-water The average water saturation in the two-phase region will bring a large error in the calculation.
Therefore, a method to calculate the water flooding volume conformance efficiency combining the core experimental relative permeability curve and the water flooding curve recently (Xun et al., 2018; Zhu et al., 2018; Yang et al., 2019). This method needs to obtain the oil-water relative permeability curve from the laboratory first. However, due to the heterogeneity of the reservoir, the core relative permeability curve cannot fully reflect the oil-water two-phase flow in the complex reservoirs, which restricts the promotion of this method.
In this study, based on three different water saturation calculation formulas, a method to calculate the ultimate water flooding volume conformance efficiency and establish a method to dynamically solve the oil-water relative permeability ratio and the water saturation with their exponential relationship. On this basis, a dynamic calculation method for the sweep efficiency, oil displacement efficiency, and relative permeability curve of water-flooding reservoirs is formed, which overcomes the dependence of existing methods on experimental data. Tests based on actual field production data show that the new method is feasible and has the advantages of convenient operation and more reliable results.
The following sections firstly introduce the quantitative relationship between the average water saturation in the reservoir, the average water saturation in the oil-water two-phase zone, and the water saturation at the outlet. Then a method to calculate the parameters a and b in the oil-water phase permeability exponential relationship is proposed. The third part discusses the calculation methods of water flooding volume conformance efficiency, oil displacement efficiency, and oil-water relative permeability curve. Further, the feasibility and reliability of the new method are verified based on the field production data. Finally, our conclusion is formed.
Theoretical Basis
Calculation of the Water Saturation
(1) The water saturation at the outlet
The water saturation at the outlet is the average water saturation at the wellbore. According to the definition of the partial flow equation and the relative permeability curve, the water cut on each flow section in the two-phase zone corresponds to the water saturation (Zhang et al., 2005). Therefore, the water saturation at the outlet can be obtained based on the water cut at the outlet.
Without considering the gravity and capillary force, the partial flow equation can be expressed as (Zhang et al., 2005):
The oil-water two-phase relative permeability ratio and water saturation have the following relationship (Qin et al., 1989; Craft and Hawkins, 1991):
Substitute Eq. 2 into Eq. 1 to get:
(2) The average water saturation in the oil-water two-phase zone
The average water saturation in the oil-water two-phase zone can be expressed by the Welge equation (Welge, 1952):
Substitute Eq. 2 into Eq. 1 and obtain the derivative of Eq. 1. Then, substitute the derivative into Eq. 4 to get:
It can be seen from the above formula that the gap between the average water saturation in the oil-water two-phase zone and the water saturation at the outlet decreases with the increase of water cut, and the two are not equal, and the water saturation at the outlet is always smaller than the average water saturation in the oil-water two-phase zone.
Substitute Eq. 3 into Eq. 5 to get:
(3) The average water saturation of the reservoir
The average water saturation of the reservoir refers to the average water saturation of the entire reservoir, which includes the water swept area and the unswept area (He, 2009). Assume that the effective pore volume of the reservoir is V, and the water flooding volume conformance efficiency is EA.
According to the definition of the average water saturation of the reservoir:
It can be seen from Eq. 7 that the difference between the average water saturation of the whole reservoir and the average water saturation of the oil-water two-phase zone mainly depends on the water flooding volume conformance efficiency. When the water flooding volume conformance efficiency tends to a fixed value, the two have a linear relationship. Only when the water flooding volume conformance efficiency is 1, the average water saturation of the whole reservoir is equal to the average water saturation of the oil-water two-phase area.
In addition, according to the mass balance equation, it can be known that:
From Eqs 8, 9, it can be known that the average water saturation of the whole reservoir can be directly obtained according to the cumulative oil production of the oilfield.
Calculation of the Parameters a and b of Kro/Krw
The key of the three methods to calculate the water saturation is the parameters a and b, which can be easily obtained by directly using the laboratory permeability curve (Yang et al., 2010), but considering the limitations of the experimental relative permeability (Yuan et al., 2018; Zhu et al., 2018), this paper proposes a dynamic calculation method based on the production data. And on this basis, the dynamic calculation methods of sweep efficiency, oil displacement efficiency, and relative permeability curve of water flooding reservoir are established.
Simultaneous Eqs 6–8 can be obtained:
The formula (10) is transformed into:
For a particular reservoir, B is a constant and A is a function of the water flooding sweep efficiency EA. When the reservoir enters stable water flooding, the water flooding sweep efficiency increases slowly, and it can be approximated that it tends to be a constant (Yang, 2008; Wang et al., 2021) (related to the physical properties of the reservoir fluid, well pattern, and well type). At this time, Y and X will Show a linear relationship, A and B can be obtained by linear regression fitting.
Taking the ratio of water-drive movable oil reserves to geological reserves as the ultimate water-drive recovery factor, we have:
The ultimate water flooding recovery factor can be expressed as:
The formula is defined according to the ultimate oil displacement efficiency:
Combining Eqs 12–14, the ultimate water flooding volume conformance efficiency can be obtained as:
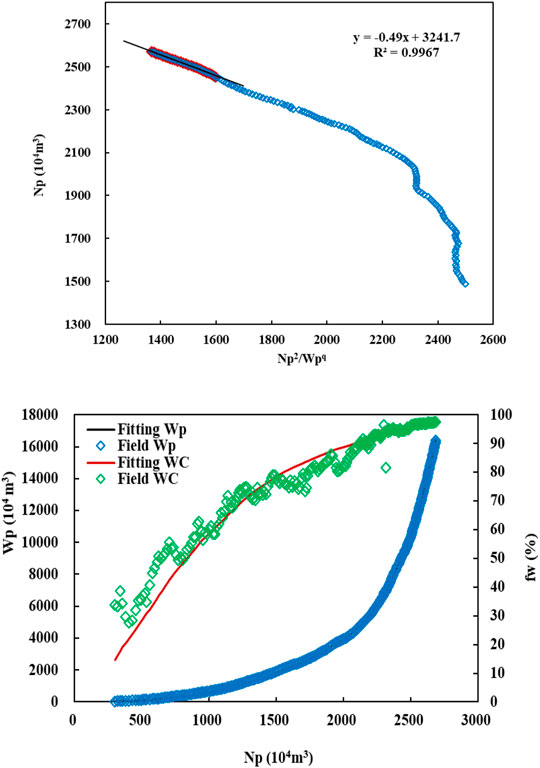
The water drive movable oil reserves NR can be obtained by the water flooding curve (Zhang, 2012; Chen et al., 2016; Chen et al., 2017). Construct the linear relationship of NP2/WPq ∼ NP, and the intercept of the linear relationship is NR. The value of variable parameter q is usually between 0 and 2, which can be determined by trial calculation based on the uniformity between the production indexes such as WP and fW calculated by the linear relationship and the actual situation. Then the limit volume conformance efficiency can be obtained from formula (15), and then the efficiency a and b can be obtained by substituting it into A and B.
Water Flooding Volume Conformance Efficiency/Oil Displacement Efficiency/The Oil-Water Relative Permeability
The oil displacement efficiency of water flooding reservoir can be calculated by the following formula:
Substituting Eq. 6 into Eq. 16, the relationship between oil displacement efficiency and water cut can be obtained:
The recovery degree R of the reservoir in place with different water cuts can be expressed as:
From Eqs 17, 18, the relationship between water flooding volume conformance efficiency and water cut can be obtained:
The relationship between the recovery degree and the water cut can be obtained from the water flooding curve, and then the water drive volume conformance efficiency at different water cuts can be obtained from formula (19).
The relative permeability of oil-water two-phase can be expressed by an exponential relationship (Craft and Hawkins, 1991):
Divide Eq. 21 by Eq. 20 and take the logarithm to get:
The formula (22) can be transformed into:
After the parameter a and b are obtained based on the production data, the corresponding Kro/Krw can be obtained by taking a series of different Swe values based on formula 2, so as to construct a series of discrete points of Kro/Krw∼Swe. These discrete points are substituted into formula 23, and the parameter such as no, nw, and W can be obtained by binary linear regression. Generally, the oil-water phase permeability curve is transformed into the normalized oil-water relative permeability curve based on the oil-phase effective permeability under irreducible water saturation as the benchmark permeability, that is, Kro(Swi) is 1, then the water-phase relative permeability Krw(Sor) to obtain the exponential expression of the relative permeability of oil-water phase.
Field Application
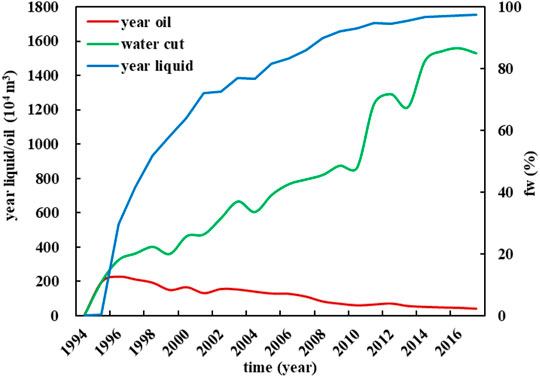
XJ Oilfield is a marine sandstone oilfield in the South China Sea. The reservoir is dominated by marine delta plain deposits, with good pore connectivity, with a porosity of 20.7–32.7% and a permeability of 436–3243 × 10−3 μm2. Oilfields rely on natural energy to develop, and the energy of edge water is sufficient (Figure 1). The formation crude oil viscosity is 2.7 mPa·s, the formation oil volume coefficient is 1.05, the formation water viscosity is 0.36 mPa·s, the formation water volume coefficient is 1.028, the irreducible water saturation is 0.253, and the residual oil saturation is 0.1582.
(1) Calculation of a and b
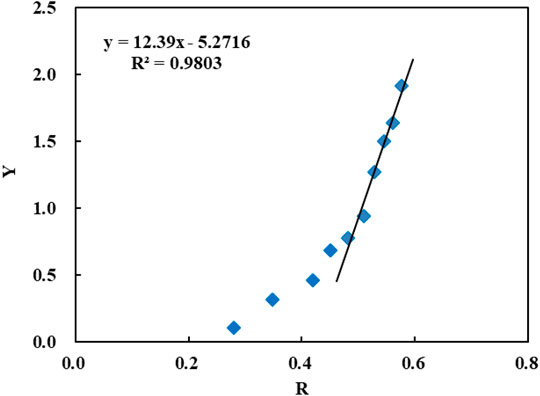
According to the production data and parameters such as oil-water phase viscosity, volume coefficient, etc., the Y-R relationship curve is drawn from Eq. 11 (Figure 2).
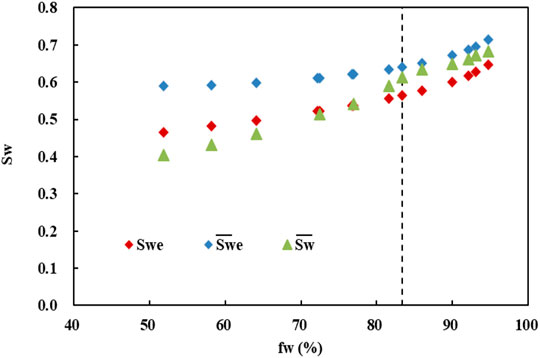
It can be seen from Figure 2 that after the recovery degree reaches 0.48, Y and R have a good linear relationship. A = 12.3901 and B = −5.2716 were obtained by linear regression. According to the dynamic fitting of the general applied water flooding curve (Figure 3), the water-drive movable oil reserve NR is 3060 × 104 m3. According to formula (15), the ultimate water drive sweep efficiency under the current well pattern is 0.94, which is substituted into Formula (10) obtains a = 10059.1515, b = 15.5913. From formulas (3), (6), (8), three types of the relationship between the water saturation and the water cut can be obtained (Figure 4).
It can be seen from Figure 4 that the three kinds of water saturation are significantly different in the middle and low water cut stages, and the average water saturation in the oil-water two-phase zone is much higher than the average water saturation in the whole reservoir. With the increase of water cut, all three kinds of water saturation increase, and the difference between them gradually decreases. When the water cut reaches 81.0%, the difference between the average water saturation in the oil-water two-phase zone and the average water saturation in the entire reservoir drops to less than 10%, which can be approximately equal. When the water cut reaches 93.0%, the difference between the average water saturation in the oil-water two-phase zone and the water saturation at the outlet is reduced to within 10%, and the two can be approximately equal. It can be seen that only in the high water cut period, the three kinds of water saturation can be approximately equivalent.
(2) Oil displacement efficiency and volume conformance efficiency
According to Eqs 17–19, the water flooding volume conformance efficiency and oil displacement efficiency can be obtained with different recovery degrees of geological reserves (Figure 5).
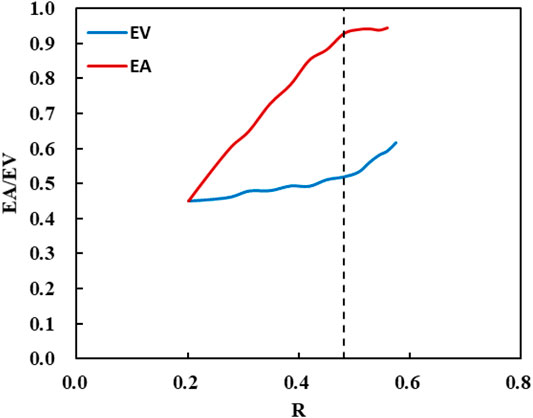
FIGURE 5. The relation curve of sweep efficiency and oil displacement efficiency with the recovery of reservoir.
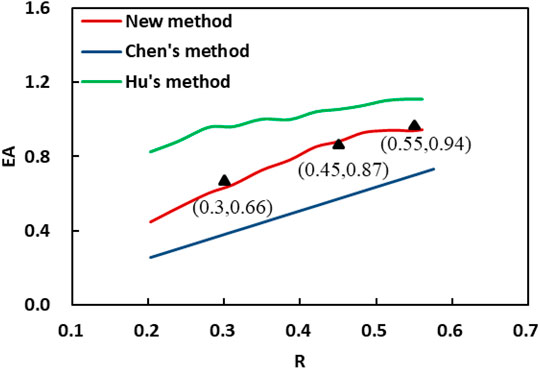
It can be seen from Figure 5 that XJ Oilfield performed differently at different development stages. In the early stage of development, the water flooding sweep efficiency increased, and the oil displacement efficiency increased slowly. After the water flooding sweep efficiency stabilized, the oil displacement efficiency was mainly improved. XJ Oilfield has low crude oil viscosity, good reservoir physical properties, and sufficient edge water energy. After the oilfield is put into production, the pressure wave expands, the edge water influx rapidly, and the water flooding swept area increases rapidly. After the well pattern control area is completely flooded, the water flooding swept efficiency tends to be stable, and after that, the production mainly focuses on improving the oil washing efficiency in the flooded area. This is consistent with production data. By analyzing the new wells’test data and the performance of production wells, it is considered that when the recovery degree is 30%, the field sweep efficiency is 0.66, when the recovery degree is 45%, the field sweep efficiency is 0.87, and when the recovery degree is 55%, the field sweep efficiency is 0.94. It can be seen from Figure 6 that the new method is in good agreement with the actual data, where Hu’s method and Chen’s method are in poor agreement.
(3) The normalized oil-water relative permeability curve
The Kro/Krw∼Swe relationship is obtained from Eq. 2, and the binary linear regression is performed according to Eq. 23 to obtain nw = 2.5496, no = 1.8660, and W = 0.0846. Combined with Eqs 20, 21, the relative permeability of oil-water phase can be obtained Exponential expression for the rate.
Figure 7 is a comparison diagram of the normalized relative permeability curve calculated theoretically and the normalized relative permeability curve measured experimentally. It can be seen from Figure 8 that the oil phase relative permeability curve has little difference, and the water phase relative permeability curve has an obvious difference. The XJ Oilfield has sufficient natural energy, and a high-speed development strategy is implemented. The strong water washing effect weakens the flow resistance of residual oil to the water phase.
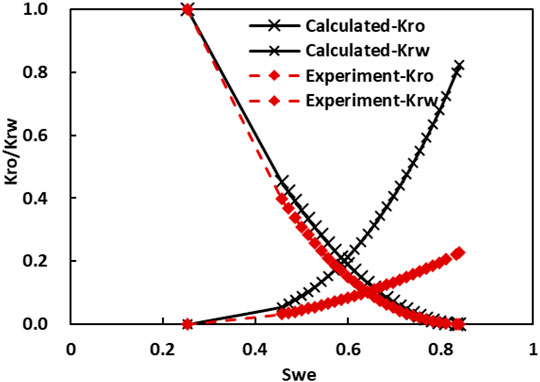
FIGURE 7. The comparison of theoretical relative permeability curves and experiment relative permeability curves.
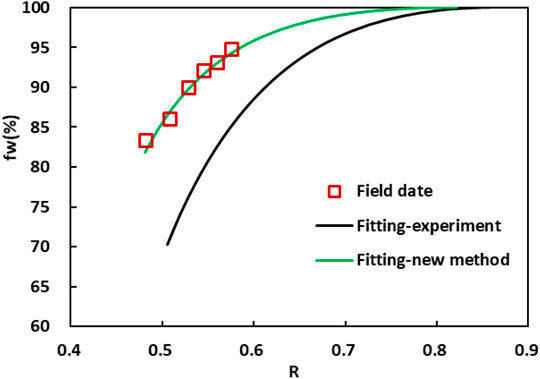
FIGURE 8. The comparison of oil field rising water-cut predicted by theoretical relative permeability curves or experiment relative permeability curves.
At the same time, it can be seen from Figure 8 that the relationship between the oilfield water cut and the recovery degree predicted by the theoretically calculated relative permeability curve is consistent with the actual production data, and is obviously better than the prediction result of the experimental relative permeability curve, which verifies the reliability of the calculation results in this paper.
Conclusion
(1) Based on the partial flow equation and Welge equation, the calculation method of the ultimate water flooding volume conformance efficiency is proposed, and the dynamic solution method of the two parameters in the relationship between the oil-water relative permeability ratio and the water saturation index is established.
(2) The dynamic calculation method of sweep efficiency and relative permeability curves that only needs daily production data such as cumulative oil production and cumulative liquid production is established, which overcomes the dependence of existing methods on core-laboratory permeability curves. The application in XJ oilfield proves the reliability of the new method.
(3) The new method has the advantages of simple data requirements, reliable results, and simple calculation. It can be used for production performance analysis, development effect evaluation, and potential measures at medium-high water cut reservoirs.
Symbol Annotations
fw——Water cut, dimensionless;
Krw——Relative permeability of water phase, dimensionless;
Kro——Relative permeability of oil phase, dimensionless;
μo——Formation oil viscosity, mPa•s;
μw——Formation water viscosity, mPa•s;
Bo——Formation oil volume coefficient, dimensionless;
Bw——Formation water volume coefficient, dimensionless;
Swe——The water saturation at the outlet, dimensionless;
a, b——Coefficient, dimensionless;
V——Effective pore volume of reservoir, m3;
EA——Water flooding volume conformance efficiency;
Swi——Irreducible water saturation of reservoir, dimensionless;
R——Recovery degree of geological reserves, dimensionless;
Np——Cumulative oil production, 104 m3;
N——Geological reserves, 104 m3;
Ve——Swept volume of water drive, m3;
Lp——Cumulative liquid production, 104 m3;
EV——Oil displacement efficiency, dimensionless;
NR——Water drive movable oil reserves, 104 m3;
Rf——Ultimate water drive recovery, dimensionless;
EVf——Ultimate oil displacement efficiency, dimensionless;
EAf——Ultimate water flooding volume conformance efficiency, dimensionless;
Sor——Residual oil saturation, dimensionless;
Krw(Sor)——Relative permeability of water phase at residual oil saturation, dimensionless;
Kro(Swi)——Relative permeability of oil phase at irreducible water saturation, dimensionless;
nw——Water phase index, dimensionless;
no——Oil phase index, dimensionless;
Data Availability Statement
The original contributions presented in the study are included in the article/Supplementary Material, further inquiries can be directed to the corresponding author.
Author Contributions
CL: Investigation; Formal analysis; Conceptualization; Writing - Original Draft; WZ: Resources; Supervision; Methodology; JJ: Formal analysis; Writing - review and editing.
Funding
This work is supported by the National Science and Technology Major Project (Grant No. 2016ZX05025-001), and CNOOC Scientific Research Project (2021-YXKJ-002).
Conflict of Interest
Authors CL, WZ and JJ were employed by CNOOC Research Institute Ltd.
The authors declare that the research was conducted in the absence of any commercial or financial relationships that could be construed as a potential conflict of interest.
Publisher’s Note
All claims expressed in this article are solely those of the authors and do not necessarily represent those of their affiliated organizations, or those of the publisher, the editors and the reviewers. Any product that may be evaluated in this article, or claim that may be made by its manufacturer, is not guaranteed or endorsed by the publisher.
References
Aryana, S. A., and Kovscek, A. R. (2013). Nonequilibrium Effects and Multiphase Flow in Porous Media. Transp. Porous Med. 97 (3), 373–394. doi:10.1007/s11242-013-0129-y
Barenblatt, G. I., Patzek, T. W., and Silin, D. B. (2003). The Mathematical Model of Nonequilibrium Effects in Water-Oil Displacement. SPE J. 8 (04), 409–416. doi:10.2118/87329-pa
Buckley, S. E., and Leverett, M. C. (1942). Mechanism of Fluid Displacement in Sands. Trans. AIME 146 (1), 107–116. doi:10.2118/942107-g
Chen, Y., and Guo, E. (2007). A Method to Predict Volumetric Sweep Efficiency and Recoverable Reserves of Water-Drive Oilfields. China Offshore Oil Gas 19 (6), 387–389. doi:10.3969/j.issn.1673-1506.2007.06.006
Chen, L., Zhang, J., and Zhou, W (2016). Modeling of Liquid Production Optimization in High Water Cut Offshore Oilfield Group and its Application. China Offshore Oil Gas. 28 (6), 46–52. doi:10.11935/j.issn.1673-1506.2016.06.008
Chen, L., Zhang, J., and Wang, K. (2017). Correlation Among Characteristic Curves of Widely Applicable Type and Type A Waterflooding. Special Oil Gas Reservoirs. 24 (1), 106–109. doi:10.3969/j.issn.1006-6535.2017.01.021
Civan, F., and Donaldson, E. C. (1989). Relative Permeability from Unsteady-State Displacements with Capillary Pressure Included. SPE Form. Eval. 4 (2), 189–193. doi:10.2118/16200-pa
Craft, B. C, and Hawkins, M. F. (1991). Applied Petroleum Reservoir Engineering. New Jersey: Prentice-Hall, Inc. Englewood. Cliffs,1991:341-343.
Craft, B. C., Hawkins, M. F., and Terry, R. E. (1959). Applied Petroleum Reservoir Engineering. New Jersey: Prentice-Hall.
Du, D., Lin, X., and Zhongchen, B. (2013). Calculation of Relative Permeability Curve with Type A Characteristic Curve of Water Drive. Special Oil Gas Reservoirs 20 (5), 93–96. doi:10.3969/j.issn.1006-6535.2013.05.02
Guler, B., Ertekin, T., and Grader, A. S. (2003). An Artificial Neural Network Based Relative Permeability Predictor. J. Can. Pet. Technol. 42, 4. doi:10.2118/03-04-02
He, J. (2009). Influencing Factors of Abnormal Oil/Water Relative Permeability Curve. Petroleum Geol. Recovery Effic. 16 (2), 74–76. doi:10.3969/j.issn.1009-9603.2009.02.023
Hu, G. (2013). A New Method for Calculating Volumetric Sweep Efficiency in a Water-Flooding Oilfield. Petroleum Explor. Dev. 40 (1), 103–106. doi:10.1016/s1876-3804(13)60011-7
Jahanbakhshi, S., Pishvaie, M. R., and Boozarjomehry, R. B. (2015). Joint Estimation of Absolute and Relative Permeabilities Using Ensemble-Based Kalman Filter. J. Nat. Gas Sci. Eng. 26, 1232–1245. doi:10.1016/j.jngse.2015.08.029
Jin, R. (2015). Derivation of the New Theoretical Relationship Curve Between Watercut and Recovery Factor. Petroleum Geol. Oilfield Dev. Daqing 34 (3), 72–75. doi:10.3969/J.ISSN.1000-3754.2015.03.013
Liang, S., Zhao, H., and Song, H. (2005). Method of Calculating Relative Permeability Curve by Production Data. Petroleum Geol. Oilfield Dev. Daqing 24 (2), 24–25. doi:10.3969/j.issn.1000-3754.2005.02.008
Lv, X., Feng, W., and Yang, Y. (2009). A New Method of Calculation Relative Permeability Curve with Performance Data. Special Oil Gas Reservoirs 16 (5), 65–66. doi:10.3969/j.issn.1006-6535.2009.05.018
Purcell, W. R. (1949). Capillary Pressures - Their Measurement Using Mercury and the Calculation of Permeability Therefrom. Trans. AIME 1, 39–48. doi:10.2118/949039-G
Qin, T., Li, T., and Chen, Y. (1989). Practical Reservoir Engineering Method. Beijing: Petroleum Industry Press.
Wang, N., Chen, H., and Wang, T. (2005). Calculating Method of Relative Permeability Curve from Production Data. J. South West Petroleum Inst. 27 (5), 26–28. doi:10.3863/j.issn.1674-5086.2005.05.007
Wang, R., Li, Z., and Zhang, B. (2006). Estimating the Waterflood Sweep Efficiency of Core Profile by Image Processing Technology. Petroleum Geol. Recovery Effic. 13 (3), 77–78. doi:10.3969/j.issn.1009-9603.2006.03.024
Wang, S., Qin, C., Feng, Q., Javadpour, F., and Rui, Z. (2021). A Framework for Predicting the Production Performance of Unconventional Resources Using Deep Learning. Appl. Energy 295, 117016. doi:10.1016/j.apenergy.2021.117016
Welge, H. J. (1952). A Simplified Method for Computing Oil Recovery by Gas or Water Drive. J. Pet. Technol. 4 (4), 91–98. doi:10.2118/124-g
Xun, J., Liu, Z., and Xue, L (2018). Study on Displacement Degree and Sweep Efficiency Variation of Water-Drive Reservoirs at High Water-Cut Stage. Petroleum Geol. Recovery Effic. 39 (5), 573–577. doi:10.7657/XJPG20180512
Yang, Y., Zhou, W., and Qiu, K. (2010). A New Method of Calculation Relative Permeability Curve. Petroleum Geol. Recovery Effic. 17 (2), 105–107. doi:10.3969/j.issn.1009-9603.2010.02.030
Yang, M., Chen, C., and Wang, Y. (2019). Injected Water Volume Sweep Efficiency of High Water-Cut Stage in Medium-Light Oil Reservoirs. Special Oil Gas Reservoirs 26 (6), 93–97. doi:10.3969/j.issn.1006-6535.2019.06.017
Yang, Z. (2008). A New Diagnostic Analysis Method for Waterflood Performance. SPE Reserv. Eval. Eng. 2008 (4), 341–351. doi:10.2118/113856-ms
Yu, Q. (2000). “A Generalized Water Drive Curve of Forecasting Oilfield Development Indexes,” in International Oil and Gas Conference and Exhibition (SPE).
Yuan, Z, Yang, B., and Yang, L. (2018). Water-cut Rising Mechanism and Optimized Water Injection Technology for Deepwater Turbidite Sandstone Oilfield. Petroleum Explor. Dev. 45 (2), 287–296. doi:10.1016/s1876-3804(18)30033-8
Zhang, J., Lei, G., and Zhang, Y. (2005). Percolation Mechanics in Oil and Gas Reservoirs. Dongying: China University of Petroleum Press.
Zhang, J. (2012). The Prediction Model of Oilfield Production Water Flooding. Beijing: Petroleum Industry Press.
Zhu, J., Lang, Z., and Zhang, L. (1998). Percolation Method in Multiscale Numerical Reservoir Simulation. Acta Pet. Sin. 19 (2), 49–53. doi:10.7623/syxb199802010
Keywords: water flooding reservoir, water saturation, water sweep efficiency, oil displacement efficiency, relative permeability curve
Citation: Liu C, Zhou W and Jiang J (2022) Dynamic Calculation of Water Sweep Efficiency and Relative Permeability Curve on Water Drive Reservoir. Front. Energy Res. 10:922435. doi: 10.3389/fenrg.2022.922435
Received: 18 April 2022; Accepted: 11 May 2022;
Published: 31 May 2022.
Edited by:
Xun Zhong, Yangtze University, ChinaReviewed by:
Jiyuan Zhang, China University of Petroleum (East China), ChinaMin Yang, University of Calgary, Canada
Copyright © 2022 Liu, Zhou and Jiang. This is an open-access article distributed under the terms of the Creative Commons Attribution License (CC BY). The use, distribution or reproduction in other forums is permitted, provided the original author(s) and the copyright owner(s) are credited and that the original publication in this journal is cited, in accordance with accepted academic practice. No use, distribution or reproduction is permitted which does not comply with these terms.
*Correspondence: Chen Liu, NDIyODEwNDgyQHFxLmNvbQ==
 Chen Liu
 Wensheng Zhou1,2