
95% of researchers rate our articles as excellent or good
Learn more about the work of our research integrity team to safeguard the quality of each article we publish.
Find out more
ORIGINAL RESEARCH article
Front. Energy Res. , 17 June 2022
Sec. Carbon Capture, Utilization and Storage
Volume 10 - 2022 | https://doi.org/10.3389/fenrg.2022.921669
This article is part of the Research Topic Recent Advances in High-efficiency Development of Conventional/Unconventional Gas Reservoirs and CCUS Technologies View all 51 articles
 Peng Cao1,2,3Yongjun Wang4Zhanfeng Qiao2,3Guangya Zhu4Haiyang Su4Guanming Shao2,3
 Jie Gong5*Haiyang Deng5
The permeability interpretation accuracy of single wells in the Middle East super-thick carbonate reservoir can hardly meet the actual demand of water injection development. Therefore, this study develops an iterative split algorithm to calculate single-well segmental dynamic permeability and SPI (specific production index) based on the dynamic and static well test, PLT (production log test), production test, and logging interpretation data. Moreover, the dynamic permeability classification evaluation index was optimized. The detailed steps are as follows: 1) The liquid supply of a single well is split according to tp PLT. 2) For some production intervals, the log interpretation data are applied to carry out the second iteration splitting of formation coefficient and fluid supply. 3) The proportion of liquid supply in the stratification section is calculated based on the calculation results of steps 1 and step 2. 4) The total formation coefficient of well test interpretation is divided based on the calculation results of step 3. 5) The dynamic permeability and SPI are calculated. The research results show that the dynamic permeability and SPI of a single well are accurate to the scale of one meter from the several original meters to tens of meters, which can better meet the needs of water injection development. In addition, SPI can be used as an essential index for permeability classification evaluation. Taking the Halfaya Oilfield and the Mishrif format reservoir as examples, the low penetration rate of the MB1-2 high penetration rate is 200md and the lower specific production index limit is 0.35 bbl/(d·m·psi), respectively. The dynamic foundation of the high-permeability layer is identified. This method offers a new idea for the title of high-permeability streaks. Moreover, this method can provide the scientific basis for correcting the permeability attribute model, water injection plan optimization, single-well completion cementing scheme, and water coning control, which can be popularized and applied in the same reservoirs.
The lithology of carbonate reservoirs in the Middle East is mainly bioclastic limestone, and the thickness is large. Moreover, porous carbonate reservoirs dominate, microfractures are abundant, and internal physical properties vary considerably (George, 1997; Smith et al., 2003; Ehrenberg et al., 2008; Sayers and Dasgupta, 2015; Wu and Duan, 2021). The oilfields of the Iran–Iraq area are mainly developed in a depletion mode, and the recovery rate is only 4.5%–7.0%. To improve the overall development effect of the oil field, enhancing oil recovery through water injection is the key to the development of this type of reservoir (Song and Li, 2018; LiuHangyu and Liu, 2019; Wang et al., 2020a; Guang-wei et al., 2021; Miaomiao et al., 2021). The calculation and interpretation of reservoir permeability are essential to alleviate the horizontal and vertical contradiction of water injection development. However, due to the large reservoir thickness (generally more than 50 m) and strong heterogeneity of this type of reservoir, the reservoir permeability explained by conventional methods cannot meet the needs of water injection development.
From the perspective of reservoir genesis, many factors affect the reservoir physical properties of carbonate reservoirs. During its formation, it was greatly influenced by sedimentation, tectonic movement, and diagenesis (Joachim et al., 1994; Ramm, 2000; Aguilera, 2006; Rotevatn et al., 2016; Goodner et al., 2020; Massiot et al., 2022). The carbonate reservoir’s matrix physical properties are relatively dense in the process of high-quality reservoir formation. On the one hand, large fault zones, fracture zones, or microfracture zones are produced by tectonic movement. Suppose the stratum is exposed for a long time. In that case, it will be affected by atmospheric water dissolution to varying degrees to form the fracture-cavity reservoir, and even the cave reservoir will develop in some areas. On the other hand, carbonate reservoirs buried underground will be further affected by multiple factors such as hydrothermal karst, organic acid dissolution, or biological disturbance, which eventually leads to significant differences in their internal physical properties.
Through the superposition of various physical and chemical actions, the different physical properties of this type of reservoir are formed, which directly affects its development effect, especially in the stage of water injection development. Therefore, the permeability calculation of this type of reservoir is critical in the life cycle development of an oilfield. Many scholars have explored the calculation methods of permeability in different scales, such as core pores, fractures, and dissolution pores (Christiansen and Iturrino, 2004; Farough et al., 2019; Kowalski et al., 2021a; Kowalski et al., 2021b). Some scholars have combined geophysical techniques to predict the physical properties of this type of reservoir with seismic inversion and 4D seismic methods (Maleki et al., 2018; Kaur et al., 2022). In addition, due to the great uncertainty of the physical property distribution of this type of reservoir, many artificial intelligence technologies such as artificial neural grid and deep learning have been introduced to calculate and predict the permeability of carbonate reservoirs (Rasolofosaon and Zinszner, 2002; El-Sebakhy et al., 2012; Akhilesh et al., 2014; Loucks and Dutton, 2019; Parra, 2022). Different methods have played an essential role in the development of oil fields.
Previous studies show that there are three primary sources of interpretation of single-well permeability: coring section test, electrical curve calculation, and equivalent permeability of well test interpretation; other methods are based on these three methods as standard samples for calculation and prediction. The significant influence of sedimentation, diagenesis, and tectonic movement on the physical characteristics of huge thick carbonate reservoirs. The physical characteristics of reservoirs are significantly different. Especially in the Middle East, the thickness of carbonate reservoirs is significant, showing strong longitudinal heterogeneity.
From the field practice, the permeability obtained from the three aforementioned methods is often difficult to meet the needs of water injection development. There are three main reasons as follows: 1) For the section with excellent single-well permeability, it is often difficult to obtain the core due to serious fragmentation during the drilling. Therefore, the permeability of the real drilling core test can only reflect the physical properties of the medium and low permeability sections. While for the high-permeability sections, especially the ultra-high-permeability section, the permeability value can hardly be obtained. 2) The logging interpretation mainly reflects the permeability of the wellbore vicinity with a scale range of 0.1–2.0 m, and for carbonate reservoirs, there are many uncertainties in the permeability interpretation using electrical logging curves (Chen, 2019; Mu et al., 2019; Wang et al., 2020b; Cheng, 2020). Therefore, it is still challenging to identify high-permeability layers only by the permeability interpretation using the electrical logging curve (Charlaix et al., 1988; Smeulders et al., 1992; Yeganeh et al., 2010; Feng et al., 2013; Cao et al., 2017; Munawar et al., 2018; Cao et al., 2019; Thomas et al., 2021). 3) Due to the influence of unstable political status in the Middle East and the limitations of engineering technology conditions, the multi-layer commingled production model is currently widely used. It is challenging to fully implement the delamination development mode (Liang et al., 2019; Sun et al., 2019; Wang et al., 2019; Liu et al., 2020; Shao et al., 2020; Cui et al., 2021). The disadvantage of multi-layer commingled production is that there are large differences in sedimentation and diagenesis between neighboring layers. However, the equivalent permeability interpreted by the well test can only reflect an equivalent value within the control range of a single well. Therefore, it is difficult to determine the permeability values of different sections in the vertical direction of a single well only by well test interpretation, and it is also impossible to decide on the physical property differences within the reservoir.
We want to meet the production demand and improve the efficiency of water injection development; a split iteration algorithm of segmental dynamic permeability and specific production liquid index for a single well is developed based on the dynamic and static data of the well test, liquid production profile, production test and logging interpretation. On this basis, the classification evaluation of dynamic permeability is carried out. This method provides a new idea for identifying the widely developed high-permeability layers in this area, and it also provides technical support for the correction of the permeability property model, the optimization of the water injection scheme, the optimization of the single-well completion and cementing scheme, and the treatment of water channeling. It can be popularized and applied in the same type of reservoirs.
The Halfaya Oilfield is located in the foredeep zone in the southern Mesopotamia Basin, which is an NW-SE anticline structure (Figure 1). The Mishrif Formation is the main development reservoir in the Halfaya Oilfield. Its peak production can account for more than 80% of the total oilfield production. In vertical, the Mishrif Formation is divided into three primary layers: MA, MB, and MC, and can be further subdivided into 18 sublayers to meet the development needs. The main production layer MB is subdivided into MB2 and MB1. The MB2 comprises coarse-grained bioclastic limestone, with an average thickness of about 30 m and good physical properties. The MB1-1 is mainly composed of tight micrite limestone, about 10–20 m in thickness, and basically, no reservoir is developed. The MB1-2 can be further subdivided into three small layers, MB1-2A, MB1-2B, and MB1-2C, with an average thickness of 20.1, 27.9, and 27.8 m, respectively (Sun et al., 2020).
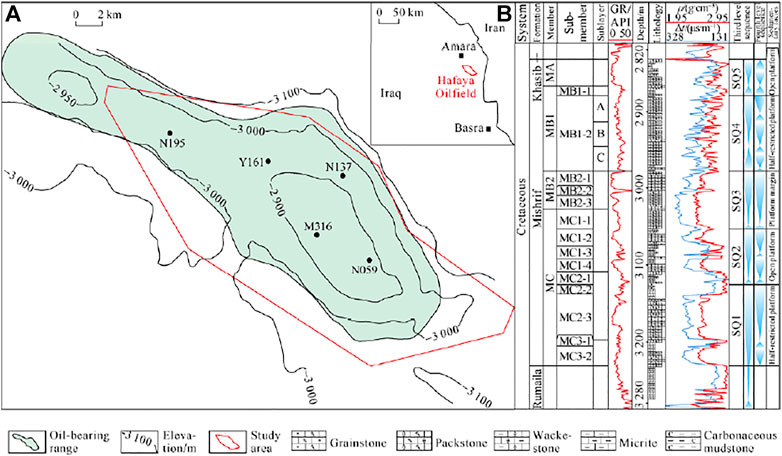
FIGURE 1. Structural and well location map (A) and composite columnar section of the Mishrif formation (B) in the Halfaya Oilfield, Iraq. GR—natural gamma, ρ—denstiy; t—acoustic differential time (Sun et al., 2020).
The main production layers of Mishrif Reservoir MB2-1 and MB1-2 have different sedimentary environments. Among them, MB2-1 shows a weak rimmed platform sedimentary environment, tidal delta deposits are developed, and the overall physical properties are good. In contrast, the MB1-2 small layer shows a semi-restricted platform sedimentary environment, debris beach, tidal channel, lagoon, and subtidal deposits developed in the platform. The reservoir is dominated by the interactive development of thin layers with significant differences in physical properties. The oilfields have gradually shifted from depletion-type development to the water-flooding development stage. An exemplary determination and classification evaluation of dynamic reservoir permeability can help alleviate the contradiction between vertical and horizontal development and improve the efficiency of water injection development.
The well test and well test interpretation are essential methods to know formation and bottom hole properties. They are also one of the most critical field testing methods in oil and gas production. Based on the theory of pressure recovery well test, the bottom hole recovery pressure can be obtained from Horner’s equation (Li, 2011) as follows:
where
The measured data of pressure recovery well test in the rectangular coordinate system can be drawn in the semi-logarithmic coordinate system after being sorted out according to the Horner formula. The Horner curve can be obtained (Figure 2).
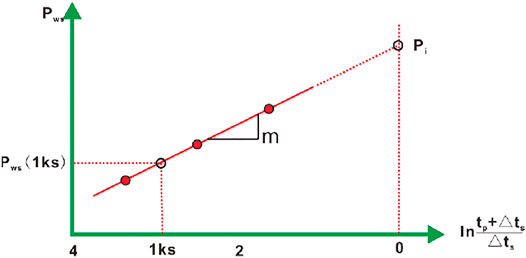
FIGURE 2. The plot of Horner (Li, 2011)
The slope of the straight line can be obtained from Eq. 2:
According to the aforementioned equation, it is easy to obtain the corresponding formation parameters, such as formation coefficient, formation flow coefficient, flow coefficient, and formation permeability (Li, 2011).
However, the permeability interpreted from the well test is equivalent to permeability within the control range of a single well. However, for super-thick reservoirs, one equivalent permeability cannot only accurately characterize the reservoir’s internal heterogeneity. Given this, the liquid production profile test data are introduced. The fluid production profile test is a basic method of production logging, and actual oil production, water production, wellbore flow pressure, and flow temperature of different perforated layers can be obtained. However, it is impossible to determine the average pressure of each small formation layer accurately.
We want to meet the practical needs of the oilfield. The production pressure difference of different reservoir sections of the same well is assumed to be approximately the same in the vertical direction. According to the flow theory and material balance principle (Li, 2011), Eqs 1, 2, for the same well, the production is directly proportional to the formation coefficient, as shown in the following equation:
Based on the aforementioned theory, it can be seen that using the well test and the liquid production profile test data to carry out one-time splitting and using the static logging curve interpretation results to perform secondary iterative splitting simultaneously, the interpretation accuracy of dynamic permeability can be significantly improved to meet the needs of engineering applications.
Considering the actual production situation of large single-well longitudinal perforation thickness and laminated production in the Mishrif formation, we selected the oil wells in which the pressure recovery well test and the liquid production profile test are conducted. The segmental dynamic permeability splitting calculation is undertaken. The steps are as follows:
Step 1: we use the liquid production profile test to obtain the actual fluid supply volume and the liquid supply thickness of the perforation section in a single well, that is, the first split of the liquid production volume;
Step 2: For the section with a single-layer liquid supply, the thickness tested for liquid production profiles is more than 5 m. The curve shows a significant difference in physical properties. It is necessary to use the relative value of the logging interpretation coefficient to carry out the secondary splitting of liquid supply. GR, RHOB, and other electrical measurements are sensitive to the reflection of reservoir physical properties, and the interpretation principle is as follows: we research the top of purpose section as a small unit to statistic the average of porosity and permeability by logging interpretation. Then, the formation coefficient value of each interval is calculated separately. And on this basis, it is assumed that the production pressure difference of different intervals does not change much. The relative size of the formation coefficient is explained by logging to make a second split of the liquid supply in this section.
Step 3: we integrate the relative magnitude of the liquid supply in each section of a single well calculated in the previous two steps and calculate the contribution ratio of the fluid supply of each section;
Step 4: we obtain a single well’s total equivalent formation coefficient based on the well test interpretation. Then, the total formation coefficient is split according to the contribution ratio of liquid supply of each section to obtain the formation coefficient of each interval;
Step 5: we calculate the dynamic permeability of each section by using the segmental formation coefficient and the thickness value of each section.
The core algorithm and calculation flow are shown in Figure 3.
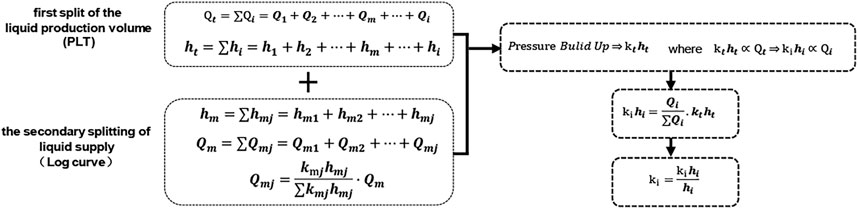
FIGURE 3. The workflow of single-well dynamic permeability splitting iterative algorithm.
In the workflow:
Take Well P1 in the Halfaya Oilfield as an example. This well was drilled in 2011 and put into production in 2012. The well has carried out the pressure recovery and liquid production profile tests, which is a representative well in this area. The well test logarithmic curve is shown in Figure 4. The well test interpretation results are shown in Table 1.
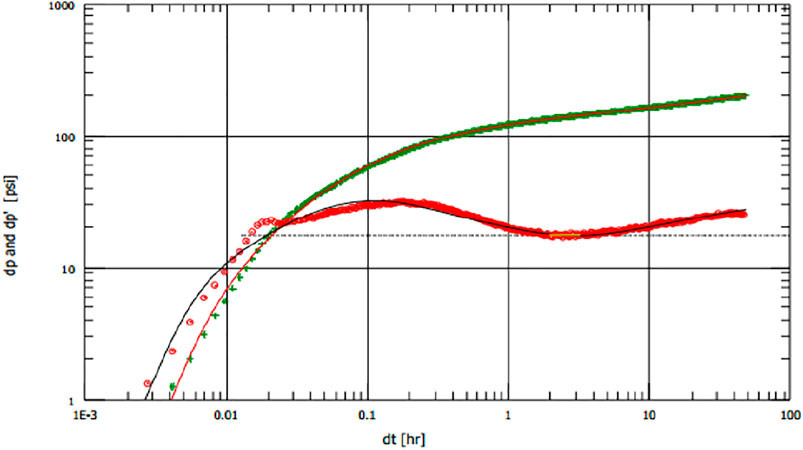
FIGURE 4. The log-log curve of P1.
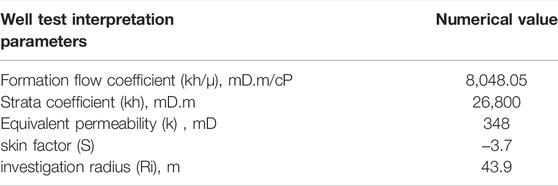
TABLE 1. The result of the well test on P1.
The test results of the fluid production profile in Well P1 are shown in Table 2. Combined with Figure 5, it can be seen that the test results of the liquid production profile in the MB2-1∼MB2-3 test sections are consistent with the porosity and permeability properties interpreted by the logging curve. However, for the 46 m testing section in MB1_2B and MB1_2C, there is only one test result. Therefore, it is necessary to carry out the secondary splitting in combination with the logging curve to meet the production requirements. The results of secondary splitting are shown in Table 3.
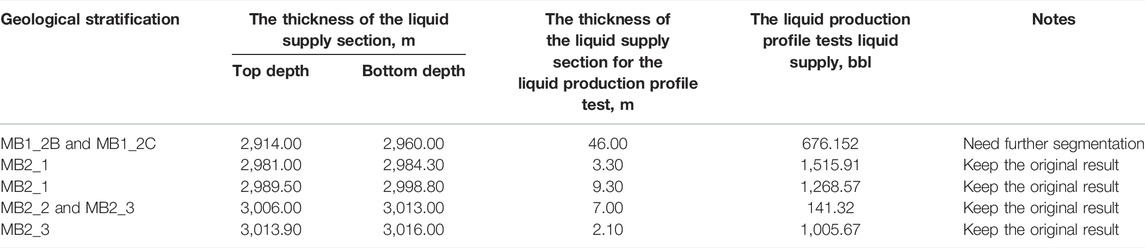
TABLE 2. The result of the production profile of P1.
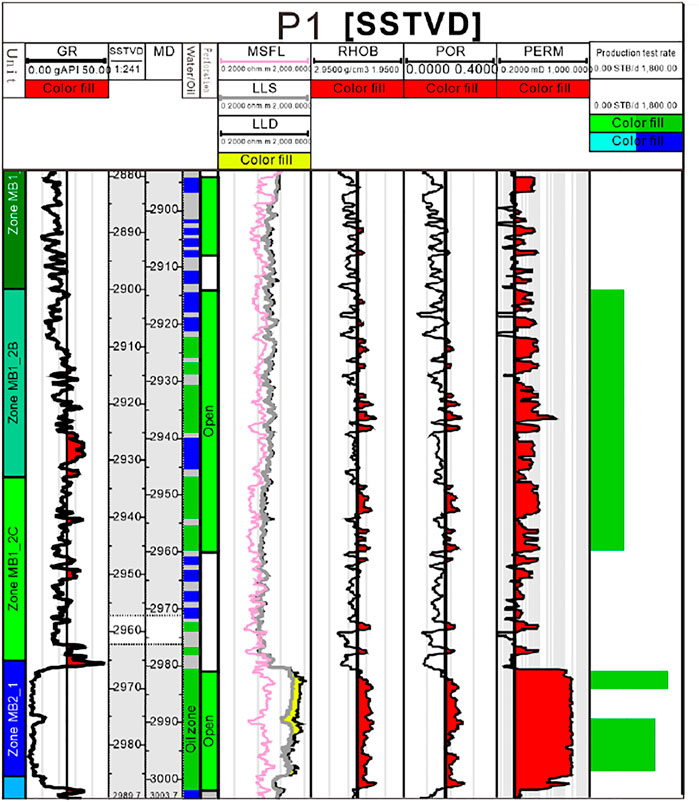
FIGURE 5. The figure of the production profile of P1
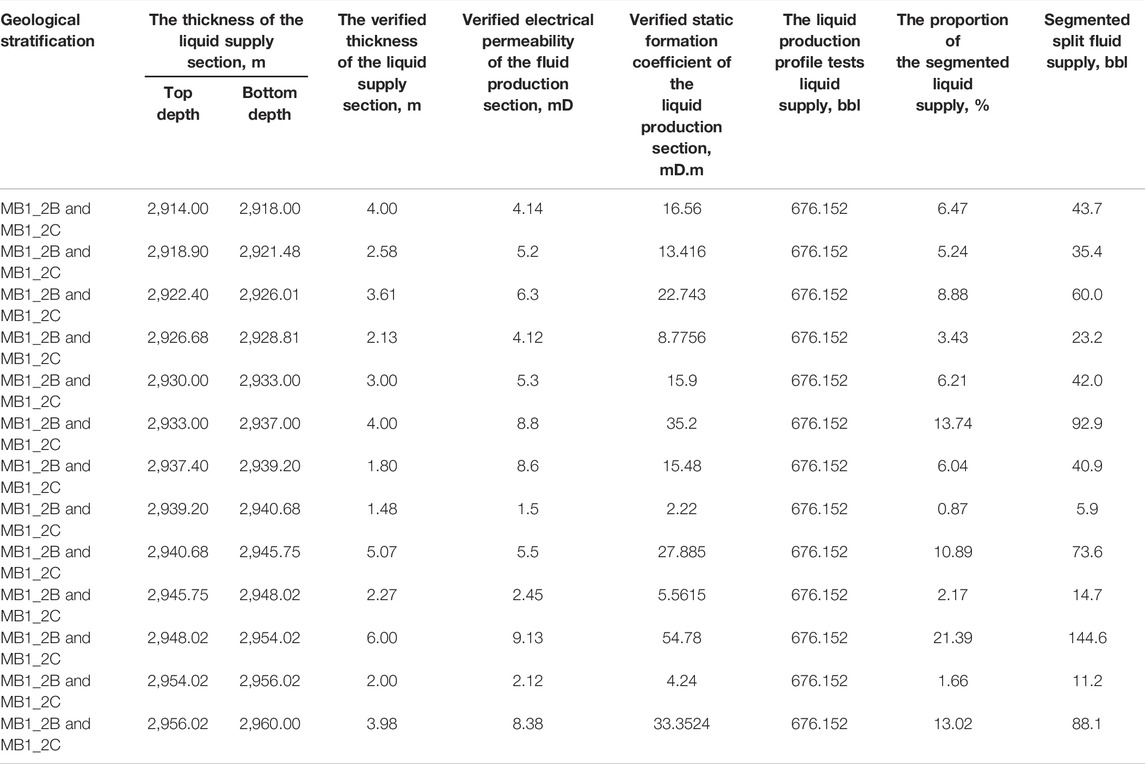
TABLE 3. Summary of secondary splitting test results of MB1-2 of production profile of P1.
Based on the core algorithm, the segmental dynamic permeability can be calculated by combining the two splitting results of the liquid production profile. The results are shown in Table 4 and Figure 6. The calculated results are pretty different from the overall permeability explained by the well test. The equivalent permeability of the single-well controlled area explained by the well test is 348 mD. After the second splitting iterative calculation, a single well can be divided into 17 layers. The dynamic permeability is about 23.0–2,785.4 mD, which better reflects the vertical heterogeneity, and shows higher consistency with the test results of the liquid production profile, which can meet the needs of field practice.
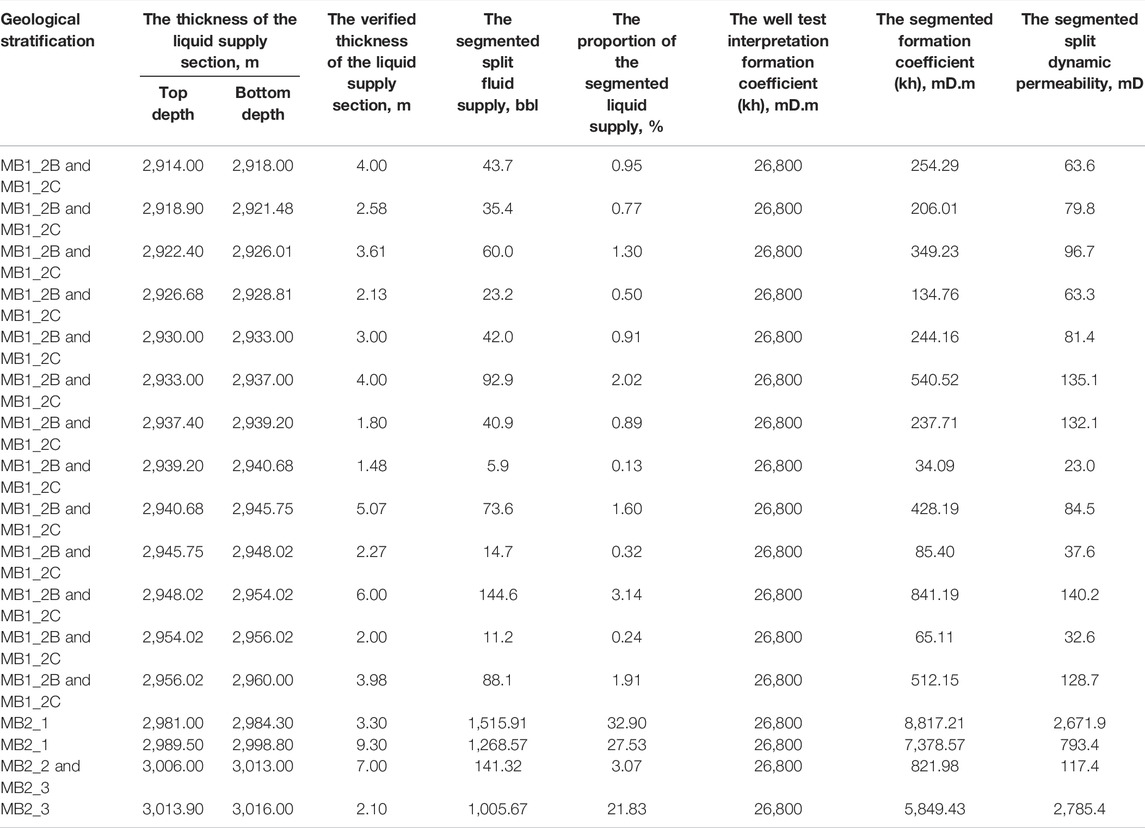
TABLE 4. Summary of sectional dynamic permeability calculation of P1.
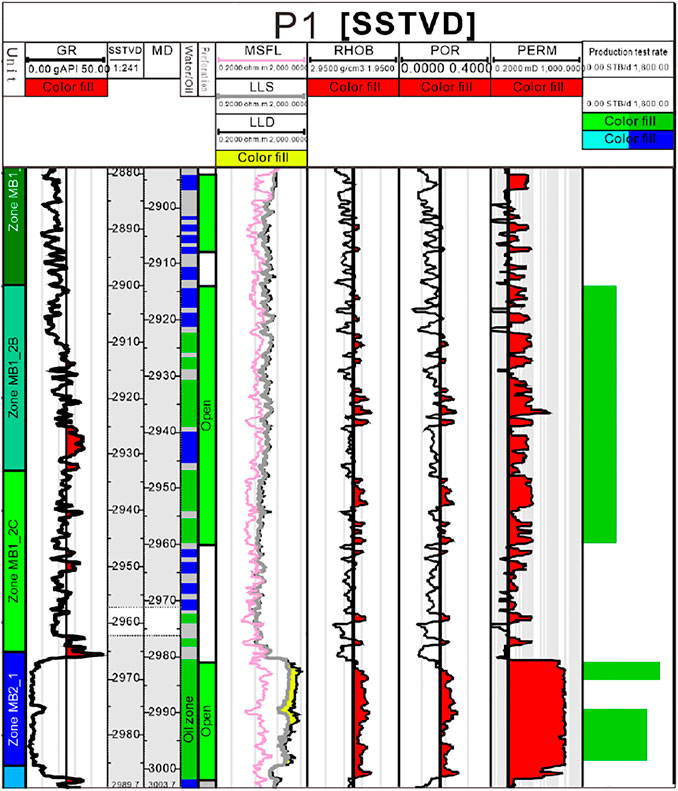
FIGURE 6. Histogram of dynamic permeability calculation results of secondary splitting iteration of P1
For the super-thick carbonate reservoirs in the Middle East, many production practices show that there are a large number of interlayers and high-permeability layers in the reservoir (LiuHangyu and Liu, 2019; Guang-wei et al., 2021; Massiot et al., 2022), in which the interlayers are mainly controlled by lithology (Mu et al., 2019; Wang et al., 2020b). However, the concealed and developed high-permeability layers make it challenging to achieve the ideal effect of oilfield water injection development. Therefore, it is necessary to carry out classification evaluation research on the dynamic permeability calculated by single-well splitting to provide the dynamic basis for identifying the later hyperpermeability zones.
According to the single-phase/two-phase flow theory, the specific liquid productivity index is an essential dynamic index for classification evaluation. The particular liquid production index is defined as the liquid production under unit pressure difference, which is an essential parameter for evaluating the fluid supply capacity of the reservoir. For the super-thick reservoir, using a method similar to the calculation of segmental dynamic permeability of a single well, the analysis of segmental specific fluid production index is carried out. The calculation method is shown in Figure 7.
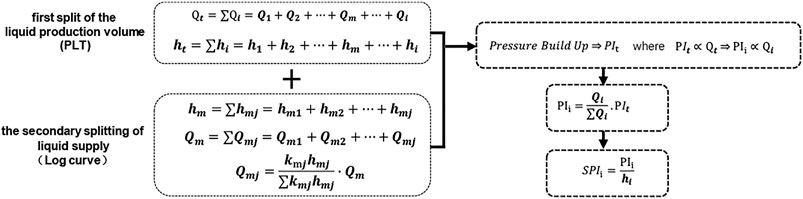
FIGURE 7. The workflow of the calculation method of specific production liquid index.
MB1-2 and MB2 are pretty different in reservoir physical properties; thus, the classification evaluation of dynamic permeability should be carried out separately in separate layers. We take the MB1-2 layer as an example, the aforementioned algorithms calculate the tested wells’ segmented dynamic permeability and fluid production index, and the semi-logarithmic diagram (Figure 8) is drawn. According to the inflection point position in the diagram, the dynamic standard of the high-permeability layer in the MB1-2 layer is determined as follows: when the permeability is greater than 200 mD, and the specific production fluid index is greater than 0.35bbl/(d.m.psi). The determination of this parameter lays a good foundation for the following quantitative characterization of high-permeability bands in the whole area.
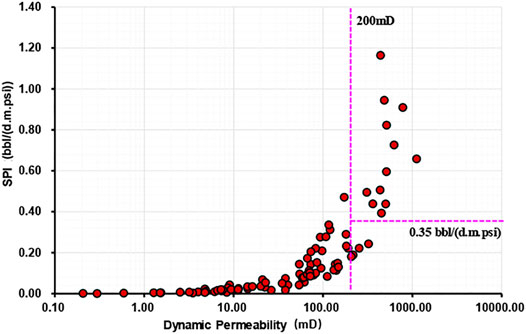
FIGURE 8. Scatter diagram of the relationship between sectional dynamic permeability and specific production fluid index of MB1-2.
By finely dividing the dynamic permeability of a single well, the interpretation accuracy of dynamic permeability is greatly improved. The dynamic identification standards of high-permeability layers in different layers can be clarified through the classification evaluation of dynamic permeability. This method has achieved good application results in identifying high-permeability layers and establishing attribute models in the Mishrif formation.
With the adequate evaluation and identification of dynamic permeability, combined with geology, logging, and other disciplines, 30 well points in the whole area of the Mishrif formation are selected, basically covering the entire work area, and the evaluation results are representative. By formulating the identification criteria for the dynamic permeability of high-permeability layers, new ideas and methods are provided for the dynamic and static comprehensive identification of high-permeability layers in this area. The results of the sedimentation and diagenetic interpretation will use the dynamic permeability obtained from the test well as the primary sample point. The high-permeability layer is established using full use of the electrical characteristics of the logging curve, and the dynamic and static comprehensive identification. It is applied to the untested wells in the whole area, and the coincidence rate with dynamic characteristics is higher than 90% (Figure 9).

FIGURE 9. Comprehensive histogram of P2
Due to the powerful heterogeneity of the super-thick carbonate reservoir in the Middle East, there is an inevitably large error between the permeability model established only by logging interpretation permeability in the early stage of fine geological modeling and the actual underground reservoir conditions. However, with conventional methods, when establishing dynamic numerical models, it is difficult to characterize the internal heterogeneity of the reservoir by using well test interpretation results for local correction. Therefore, when well testing and liquid production profile testing well points are fully covered vertically and horizontally in the work area, using the calculation results of single-well-segmented dynamic permeability. It can provide a basis for modeling and numerical model personnel to correct the attribute model. Compared with the original model, the newly established attribute model of the Mishrif reservoir is significantly improved. The high-permeability layers and interlayers in the new acceptable geological model are more clearly represented. The freshly based attribute model aligns with the reservoir geological understanding. The history matching accuracy is significantly improved (Figures 10, 11).
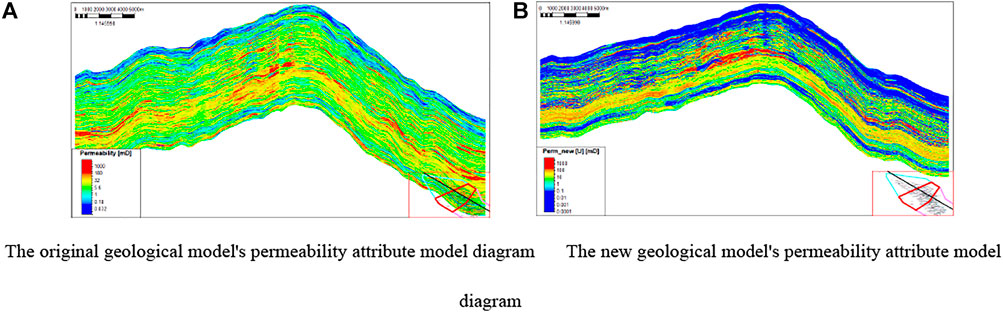
FIGURE 10. Profile of permeability model in the long axis direction of the work area. (A) The original geological model’s permeability attribute model diagram (B) The new geological model’s permeability attribute model diagram
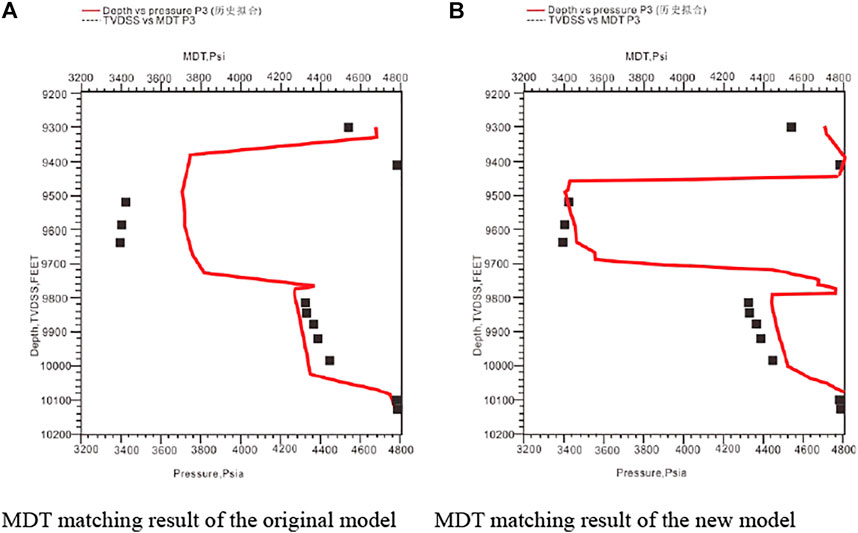
FIGURE 11. Comparison of MDT history match of P3. (A) MDT matching result of the original model (B) MDT matching result of the new model
For super-thick carbonate reservoirs, well testing, fluid production profile testing, and logging interpretation can be combined. The second iteration method can estimate the segmental dynamic permeability of a single well and conduct a classification evaluation study. The innovation of this method is mainly reflected in the following three aspects:
1) The shortcomings of lack of coring and multi-layer well testing can be overcome and more accurate formation parameters for water injection development of thick carbonate reservoirs can be provided.
2) We can make full use of the dynamic and static data and use the second iteration method to calculate the segmental dynamic permeability. The calculation process is simple, and the segmental dynamic permeability accuracy is greatly improved, which can meet the application of water injection engineering.
3) The calculation results can better characterize the heterogeneity characteristics within the reservoir. It has a good application effect in reservoir internal high-permeability layer identification and attribute model establishment and has good application prospects.
The original contributions presented in the study are included in the article/Supplementary Material; further inquiries can be directed to the corresponding author.
PC: code writing, data curation, and writing—reviewing and editing. YW: technical guidance and polishing. ZQ: project administration. GZ: supervision. HS: formal analysis and writing—original draft preparation. GS: investigation. JG: conceptualization and methodology. HD: data curation and polishing.
The authors declare that the research was conducted in the absence of any commercial or financial relationships that could be construed as a potential conflict of interest.
All claims expressed in this article are solely those of the authors and do not necessarily represent those of their affiliated organizations, or those of the publisher, the editors, and the reviewers. Any product that may be evaluated in this article, or claim that may be made by its manufacturer, is not guaranteed or endorsed by the publisher.
Aguilera, R. (2006). Sandstone versus Carbonate Petroleum Reservoirs: a Global Perspective on Porosity–Depth and Porosity–Permeability Relationships: Discussion. Am. Assoc. Petroleum Geol. Bull. 90, 807–810. doi:10.1306/09140505131
Akhilesh, K. V., Burns, A. C., Routray, A., Mohanty, W. K., and Mansinha, L. (2014). Porosity and Permeability Estimation Using Neural Network Approach from Well Log Data: Presented at GeoConvention. Calgary, AB: SPE Annual Technical Conference and Exhibition
Cao, P., Dai, C., and Hui, M. (2017). Influence of Low-Permeability Layers on Remaining Oil Distribution in Dolomite Reservoir [J]. J. Southwest Petroleum University(Science&TechnologyEdition) 39 (05), 143–154. doi:10.118S5/jissn.16745086.2016.06.12.01
Cao, P., Dai, C., and Zhang, C. (2019). Quantitative Characterization of Heterogeneity and Geological Modeling of the YingmaiXI Dolomite Oil Reservoir [J]. J. Southwest Petroleum University(Science&TechnologyEdition) 41 (01), 18–32. doi:10.11885/j.issn.l674-5086.2017.11.08.01
Charlaix, E., Kushnick, A. P., and Stokes, J. P. (1988). Experimental Study of Dynamic Permeability in Porous Media. Phys. Rev. Lett. 61 (14), 1595–1598. doi:10.1103/physrevlett.61.1595
Chen, L. (2019). The Research on Permeability Evaluation Method of Carbonate Reservoir in M Block of Middle East[D]. Jingzhou, Hubei Province: Yangtze University.
Cheng, F. (2020). Study on Evaluation of Logging Interpretation of Carbonate Reservoir[D]. Beijing: China University of Geosciences for Master of Professional Degree. doi:10.27493/d.cnki.gzdzy.2020.000769
Christiansen, L. B., and Iturrino, G. J. (2004). Core-scale Permeability of an Actively Venting, Felsic-Hosted Hydrothermal System: The PACMANUS Hydrothermal Field. Proc. Ocean Drill. Program, Sci. results 193, 19. doi:10.2973/odp.proc.sr.193.202.2004
Cui, B., Feng, P., and Yang, H. (2021). Study on the Microcosmic Characteristics of Carbonate Acid Corrosion of M Oilfield in the Middle East[J]. J. Guangdong Univ. Petrochem. Technol. 31 (01), 29–32+36. doi:10.3969/j.issn.2095-2562.2021.01.007
Ehrenberg, S. N., Aqrawi, A. A. M., and Nadeau, P. H. (2008). An Overview of Reservoir Quality in Producing Cretaceous Strata of the Middle East. Pet. Geosci. 14 (4), 307–318. doi:10.1144/1354-079308-783
El-Sebakhy, E. A., Asparouhov, O., Abdulraheem, A.-A., Al-Majed, A.-A., Wu, D., Latinski, K., et al. (2012). Functional Networks as a New Data Mining Predictive Paradigm to Predict Permeability in a Carbonate Reservoir. Expert Syst. Appl. 39, 10359–10375. doi:10.1016/j.eswa.2012.01.157
Farough, A., Kc, B., Foroutan, M., Ghazanfari, E., and Deans, J. R. (2019). First Two-Dimensional Core-Scale Permeability Measurements in a Submarine Volcano: Insights into Fluid Circulation in the Active Hydrothermal System at Brothers Volcano. AGU Fall Meet. Abstr. 2019, V32B–V04. doi:10.3969/j.issn.1671-1815.2021.01.019
Feng, Q., Wang, S., Zhang, W., Song, Y., and Song, S. (2013). Characterization of High-Permeability Streak in Mature Waterflooding Reservoirs Using Pressure Transient Analysis. J. Petroleum Sci. Eng. 110, 55–65. doi:10.1016/j.petrol.2013.08.042
George, T. (1997). Norgard; Structural Inversion of the Middle Triassic Halfway Formation, Monias Field, Northeast British Columbia. Bull. Can. Petroleum Geol. 45 (4), 614–623. doi:10.35767/gscpgbull.45.4.614
Goodner, H. M., Rankey, E. C., Zhang, C., and Watney, W. L. (2020). Rock Fabric Controls on Pore Evolution and Porosity-Permeability Trends in Oolitic Grainstone Reservoirs and Reservoir Analogs. Bulletin 104 (7), 1501–1530. doi:10.1306/12191919046
Guang-wei, L., Yang, L., and Yang, L. (2021). Longitudinal Water Flooding Seepage Law of Typical Mishrif Reservoir in the Middle East [J]. Sci. Technol. Eng. 21 (01), 138–143.
Joachim, E., Eric, W., and Hans, G. (1994). Regional-Scale Porosity and Permeability Variations in Upper Devonian Leduc Buildups: Implications for Reservoir Development and Prediction in Carbonates. Bulletin 78 (10), 1541–1558. doi:10.1306/A25FF215-171B-11D7-8645000102C1865D
Kaur, H., Zhong, Z., Sun, A., and Fomel, S. (2022). Time-lapse Seismic Data Inversion for Estimating Reservoir Parameters Using Deep Learning. Interpretation 10 (1), T167–T179. doi:10.1190/INT-2020-0205.1
Kowalski, A. C. G., Mendonça, C. A., and Ofterdinger, U. S. (2021). Fracture Flow Characterization with Low‐Noise Spontaneous Potential Logging. Groundwater 59 (1), 16–23. doi:10.1111/gwat.13009
Kowalski, A. C. G., Mendonça, C. A., Ofterdinger, U. S., and Rocha, H. R. (2021). Fracture Critical Length Estimative Using Percolation Theory and Well Logging Data. Jeeg 26 (4), 279–286. doi:10.32389/JEEG21-019
Li, C. (2011). Principles of Reservoir Engineering. Second Edition. Beijing: Petroleum Industry Press.
Liang, W., Jiang, W., and Su, H. (2019). Main Influencing Factors of Waterflooding Efficiency and Injection Technique Policy of Carbonate Reservoir in Middle East [J]. Petrochem. Ind. Technol. 26 (05), 170–171. doi:10.3969/j.issn.1006-0235.2019.05.102
Liu, Y., Liu, Y., and Zhang, Q. (2020). Large-scale Physical Simulation Experimental Study on Thick Carbonate Reservoirs [J]. Petroleum Geol. Recovery Effic. 27 (04), 117–125. doi:10.13673/j.cnki.cn37-1359/te.2020.04.014
LiuHangyu, T. Z., and Liu, B. (2019). Classification and Prediction of Giant Thick Strongly Heterogeneous Carbonate Reservoirs in the Middle East Area: a Case Study of Mid-cretaceous Mishrif Formation in the W Oilfield of Iraq [J]. J. Of Geomechanics 40 (06), 677–691. doi:10.7623/syxb20190600
Loucks, R. G., and Dutton, S. P. (2019). Insights into Deep, Onshore Gulf of Mexico Wilcox Sandstone Pore Networks and Reservoir Quality through the Integration of Petrographic, Porosity and Permeability, and Mercury Injection Capillary Pressure Analyses. Bulletin 103 (3), 745–765. doi:10.1306/09181817366
Maleki, M., DavolioSchiozer, A. D. J., and Schiozer, D. J. (2018). Using Simulation and Production Data to Resolve Ambiguity in Interpreting 4D Seismic Inverted Impedance in the Norne Field. Pet. Geosci. 24, 335–347. doi:10.1144/petgeo2017-032
Massiot, C., McIntosh, I., Deans, J., Milicich, S. D., Caratori Tontini, F., de Ronde, C. E. J., et al. (2022). Petrophysical Facies and Inferences on Permeability at Brothers Volcano, Kermadec Arc, Using Downhole Images and Petrophysical Data. Econ. Geol. doi:10.5382/econgeo.4897
Miaomiao, L., Song, B., and Tian, C. (2021). Key Controlling Factors of Permeability in Porous Carbonate Reservoirs of Mishrif Formation in the Middle East [J]. Petroleum Geol. Recovery Effic. 28 (03), 70–76. doi:10.13673/j.cnki.cn37-1359/te.2021.03.008
Mu, Y., Zhang, L., and Luo, S. (2019). Permeability Evaluation of Carbonate Reservoirs through Stoneley Wave Energy Analysis [J]. WELL LOGGING Technol. 43 (04), 386–390. doi:10.16489/j.issn.1004-1338.2019.04.011
Munawar, M. J., Lin, C., Chunmei, D., Zhang, X., Zhao, H., Xiao, S., et al. (2018). Architecture and Reservoir Quality of Low-Permeable Eocene Lacustrine Turbidite Sandstone from the Dongying Depression, East China. Open Geosci. 10 (1), 87–112. doi:10.1515/geo-2018-0008
Parra, J. O. (2022). Deep Learning for Predicting Permeability Logs in Offset Wells Using an Artificial Neural Network at a Waggoner Ranch Reservoir, Texas. Lead. Edge 41 (3), 184–191. doi:10.1190/tle41030184.1
Ramm, M. (2000). Reservoir Quality and its Relationship to Facies and Provenance in Middle to Upper Jurassic Sequences, Northeastern North Sea. Clay Min. 35 (1), 77–94. doi:10.1180/000985500546747
Rasolofosaon, P. N. J., and Zinszner, B. E. (2002). Comparison between Permeability Anisotropy and Elasticity Anisotropy of Reservoir Rocks. Geophysics 67 (1), 230–240. doi:10.1190/1.1451647
Rotevatn, A., Fossmark, H. S., Bastesen, E., Thorsheim, E., and Torabi, A. (2016). Do deformation Bands Matter for Flow? Insights from Permeability Measurements and Flow Simulations in Porous Carbonate Rocks. Pet. Geosci. 23 (1), 104–119. doi:10.1144/petgeo2016-038
Sayers, C. M., and Dasgupta, S. (2015). Elastic Anisotropy of the Middle Bakken Formation. Geophysics 80 (1), D23–D29. doi:10.1190/geo2014-0219.1
Shao, S., Feng, P., and Gao, J. (2020). Application of Water Control and Organic Blockage Removal of Horizontal Well in S Oilfield of Middle East [J]. J. Guangdong Univ. Petrochem. Technol. 30 (03), 42–45. doi:10.3969/j.issn.2095-2562.2020.03.010
Smeulders, D. M. J., Eggels, R. L. G. M., and Van Dongen, M. E. H. (1992). Dynamic Permeability: Reformulation of Theory and New Experimental and Numerical Data. J. Fluid Mech. 245, 211–227. doi:10.1017/s0022112092000429
Smith, L. B., Eberli, G. P., Masaferro, J. L., and Al-Dhahab, S. (2003). Discrimination of Effective from Ineffective Porosity in Heterogeneous Cretaceous Carbonates, Al Ghubar Field, Oman. Bulletin 87, 1509–1529. doi:10.1306/041703200180
Song, X., and Li, Y. (2018). Optimum Development Options and Strategies for Water Injection Development of Carbonate Reservoirs in the Middle East [J]. Petroleum Explor. Dev. 45 (04), 679–689. doi:10.1016/s1876-3804(18)30075-2
Sun, L., Li, B., and Li, Y. (2019). Waterflooding Model of Horizontal Wells for Porous Carbonate Reservoirs in Middle East[J]. Sci. Technol. Eng. 19 (14), 136–145.
Sun, W., Qiao, Z., and Shao, G. (2020). Sedimentary and Reservoir Architectures of MB1-2 Sub-member of Middle Cretaceous Mishrif Formation of Halfaya Oilfield in Iraq [J]. PETROLEUM Explor. Dev. 47 (04), 713–722. doi:10.1016/s1876-3804(20)60091-x
Thomas, H., Brigaud, B., and Blaise, T. (2021). Contribution of Drone Photogrammetry to 3D Outcrop Modeling of Facies, Porosity, and Permeability Heterogeneities in Carbonate Reservoirs (Paris Basin, Middle Jurassic)[J]. Mar. Petroleum Geol. 123, 104772. doi:10.1016/j.marpetgeo.2020.104772
Wang, Q., Jin, F., and Guan, Y. (2019). Permeability Logging Evaluation Method of Low-Porosity Low-Permeabilities and Stone Reservoirs Based on Dynamic Data: a Case Study of Paleogene Stra-Tain Lufeng Sag[J]. Acta Pet. Sin. 40 (S1), 206–216. doi:10.7623/syxb2019S1018
Wang, X., Wang, L., and Wang, Y. (2020). Application of C5.0 Decision-Tree Algorithm to Interpret Permeability of Carbonate Reservoir [J]. WELL LOGGING Technol. 44 (03), 300–304. doi:10.16489/j.issn.1004-1338.2020.03.016
Wang, Y., Song, X., and Wang, G. (2020). Key Technologies and Practices for Rapid and Large-Scale Production Increase in Cooperation Oil and Gas Fields of the Middle East [J]. Acta Pet. Sin. 41 (12), 1633–1642. doi:10.7623/syxb202012015
Wu, T., and Duan, X. (2021). Sedimentary Microfacies Characteristics and Ramp Model of Upper Cretaceous Khasib Formation in B Oilfield, Middle East[J]. J. Of Chengdu Univ. Of Technol. Technol. Ed. 48 (03), 283–295. doi:10.3969/j.issn.1671-9727.2021.03.02
Keywords: super-thick reservoir, well test, PLT, dynamic permeability, SPI
Citation: Cao P, Wang Y, Qiao Z, Zhu G, Su H, Shao G, Gong J and Deng H (2022) Single-Well Dynamic Permeability Splitting Algorithm and Classification Evaluation: A Case Study of a Super-Thick Carbonate Reservoir in the Middle East. Front. Energy Res. 10:921669. doi: 10.3389/fenrg.2022.921669
Received: 16 April 2022; Accepted: 02 May 2022;
Published: 17 June 2022.
Edited by:
Qi Zhang, China University of Geosciences Wuhan, ChinaReviewed by:
Shuyong Hu, Southwest Petroleum University, ChinaCopyright © 2022 Cao, Wang, Qiao, Zhu, Su, Shao, Gong and Deng. This is an open-access article distributed under the terms of the Creative Commons Attribution License (CC BY). The use, distribution or reproduction in other forums is permitted, provided the original author(s) and the copyright owner(s) are credited and that the original publication in this journal is cited, in accordance with accepted academic practice. No use, distribution or reproduction is permitted which does not comply with these terms.
*Correspondence: Jie Gong, MTY2NjI0NzM2N0BxcS5jb20=
Disclaimer: All claims expressed in this article are solely those of the authors and do not necessarily represent those of their affiliated organizations, or those of the publisher, the editors and the reviewers. Any product that may be evaluated in this article or claim that may be made by its manufacturer is not guaranteed or endorsed by the publisher.
Research integrity at Frontiers
Learn more about the work of our research integrity team to safeguard the quality of each article we publish.