 Ben Qi
 Liguo Zhang
 Jingang Liang
94% of researchers rate our articles as excellent or good
Learn more about the work of our research integrity team to safeguard the quality of each article we publish.
Find out more
METHODS article
Front. Energy Res. , 20 June 2022
Sec. Nuclear Energy
Volume 10 - 2022 | https://doi.org/10.3389/fenrg.2022.920194
This article is part of the Research Topic Rising Stars in Nuclear Energy: 2022 View all 7 articles
Knowledge-driven and data-driven methods are the two representative categories of intelligent technologies used in fault diagnosis in nuclear power plants. Knowledge-driven methods have advantages in interpretability and robustness, while data-driven methods have better performance in ease of modeling and inference efficiency. Given the complementarity of the two methods, a combination of them is a worthwhile investigation. In this work, we introduce two new techniques based on Bayesian theory (knowledge-driven) and artificial neural network (data-driven) for fault diagnosis in nuclear power plants. The first approach exploits an integrated technique, Bayesian Neural Network (BNN), which introduces Bayesian theory into the neural network to provide confidence in diagnosis. The second approach, denoted as Simplified Bayesian Network-Artificial Neural Network (SBN-ANN), adopts a hierarchical diagnosis idea, which firstly uses a simplified Bayesian network to diagnose fault types and then a neural network to diagnose the severity of faults. The two new techniques are implemented and verified with simulated faults data of a typical pressurized water reactor. Compared with single-algorithmic diagnostic approaches such as Bayesian network and neural network, the new combinatorial techniques show better performance in diagnostic precision. The results suggest the feasibility to develop the data and knowledge dual-drive technologies for fault diagnosis.
Nuclear safety is one of the most critical tasks in the construction and operation of nuclear power plants (NPPs). The main aim is to prevent nuclear accidents caused by nuclear facilities due to their defects, improper human operations, or natural disasters, as well as to protect the environment and the public from the adverse effects of radioactive substances when faults occur (Chao-jun et al., 2013). A fault is a failure of a system or equipment to perform a specified function with at least one performance or parameter clearly deviating from its normal level (Gao et al., 2015). Combining the five lines of defense in depth (Zhang et al., 2018) and the definition of faults, it can be seen that the strength of fault diagnosis capability has an important impact on nuclear safety. The current fault diagnosis in nuclear power plants mainly relies on the judgment of operators. Since there are hundreds of subsystems and a large number of monitoring parameters in nuclear power plants (Kim and Safety, 1994), although the operators have been trained, the complexity of systems, enormous information as well as tremendous psychological stress may cause them to make wrong judgments when a fault occurs, which may lead to serious radiological consequences. Nuclear accidents in history have shown the risk to rely only on operators for fault diagnosis in NPPs. On the other hand, advances in artificial intelligence (AI) technology (Dietterich 2017) have made it possible to process a huge amount of information. Applying AI to fault diagnosis in NPPs, or intelligent fault diagnosis, is a technology to help operators extract critical information and take the right actions during NPP emergencies. Research on AI-based fault diagnosis for nuclear power plants have been focusing on two types of methods, knowledge-driven and data-driven methods.
A knowledge-driven fault diagnosis method is essentially an attempt to make computers think more like humans, aiming to capture the knowledge of human experts to support decision-making. The term “knowledge-driven” in this paper refers to information and experience to distinguish between knowledge-driven and data-driven methods. A typical knowledge-driven fault diagnosis model consists of a knowledge base and a inference machine. The knowledge base stores domain knowledge-based information and experience, the essence of which is the logical relationship between faults and phenomena and between phenomena and phenomena. The types of faults that can explain the physical signs are solved by importing the actual physical signs obtained into the inference machine. Knowledge-driven fault diagnosis methods can explicitly represent the process of arriving at the results and have a natural interpretability (Lo et al., 2006). In the nuclear field, the applications of this method show different characteristics in the early and current stage. In the early stage, expert knowledge was commonly represented by deterministic IF-THEN rules (Ciftcioglu et al., 1970). Bergman et al. used expert systems for the fault diagnosis in boiling water reactors (Bergman and Åström, 1983). Buckle et al. introduced the concepts of fuzzy affiliation, fuzzy sets, evidence theory, and confidence rule base on the representation of expert knowledge, which can handle the uncertainty in expert knowledge (Buckley et al., 1986; Sutton and Parkins 1991; Yang et al., 2006; Yang et al., 2007). At present, new technologies with interpretability, uncertainty expression and information fault tolerance are introduced, which are different from early expert systems based mainly on IF-THEN rules. Wu et al. thoroughly studied the application of the SDG method for fault diagnosis in the nuclear field, and successively combined SDG with fuzzy theory and correlation analysis for online monitoring and diagnosis of nuclear power plants (Wu et al., 2017; Guohua et al., 2020; Guohua et al., 2021). Zhao et al. proposed a fault diagnosis technique for nuclear power plants based on dynamic Bayesian networks seeking for fault diagnosis capability in the case of on-demand faults and incomplete evidence information (Wu et al., 2018; Zhao et al., 2020). Zhao and Nie proposed the fault diagnosis method of nuclear power plants based on DUCG, especially testing the fault tolerance for knowledge base and signals with good results (Zhao et al., 2017; Nie and Zhang 2021). The essence of the above-mentioned expert systems based on new technologies is still the transformation of the expert knowledge base into a graph-theoretic representation, i.e., the representation of knowledge rules as a graph. The difference is that they use different inference mechanisms.
A data-driven fault diagnosis method is essentially a way to let the machine learn by itself by ingesting a large amount of data. The machine learns patterns from large amounts of data, generalizes some kind of mapping function, and then applies this function to new data to solve the target problem. They can model this by using extremely complex functions to match equally complex structures, which also makes it difficult to know how and why the models get such diagnostic results. This is a significant difference between knowledge-driven and data-driven methods (Jordan and Mitchell 2015). In the nuclear field, investigations have been carried out with various data-driven approaches, using either some individual machine learning algorithms or hybrid algorithms. Zwingelstein et al. successively used multiple algorithms such as artificial neural networks, principal component analysis, support vector machines, decision trees, and unsupervised clustering for fault diagnosis in nuclear power plants, and preliminarily demonstrated the feasibility of these single machine learning methods (Feng et al., 2003; Mu and Xia 2010; Xia and Zhang 2010; Baraldi et al., 2013; Jiang and Huang, 2020). Liu et al. combined fuzzy logic, genetic algorithm, laminar flow model, rough set, and principal component analysis with artificial neural networks to significantly improve the performance of fault diagnosis (Yong-Kuo et al., 2005; Ming et al., 2006; Shi et al., 2006; Liu et al., 2007; Peng B.-S. et al., 2018). Jamil et al. combined Fisher discriminant analysis, long short-term memory neural network with principal component analysis, providing a new idea of data dimensionality reduction before fault diagnosis (Jamil et al., 2016; Saeed et al., 2020). Peng et al. combined multi-layer flow model, improved particle swarm algorithm and support vector machine to compensate some shortcomings of knowledge-driven based methods (Peng M.-j. et al., 2018; Wang et al., 2019). Current research tends to combine multiple algorithms to construct diagnostic models.
The advantage of knowledge-driven methods is that there is no need to establish a systematic analytical model, and the diagnosis results are highly interpretable and robust. However, there are shortcomings in these methods: it is difficult to obtain expert knowledge and the diagnostic accuracy depends on the richness of the knowledge base; more inference rules can lead to matching conflicts in the inference process, which makes the inference inefficient. The advantages of the data-driven approaches are that the modeling process is relatively simple and efficient. Nevertheless, the shortcomings are also obvious. First, it is difficult to obtain the necessary data, for both historical and real-time monitoring data. Second, generalization of the model is limited by the learning data, which means once the actual data is slightly different from the sample data, it may lead to inaccurate diagnosis results. Lastly, the data-driven models are uninterpretable to users. The “black box” characteristic makes it difficult to be accepted by nuclear regulation. Table 1 compares the advantages and disadvantages of the two methods.

TABLE 1. Comparison of fault diagnosis methods.
Through the comparison, we can see that the knowledge-driven and data-driven methods have strong complementary abilities. However, most of the previous research focuses only on one of the two methods, which cannot take advantage of both methods. A combination of the two methods seems to be attractive. Based on the two representative technologies of Bayesian theory (knowledge-driven) and neural network (data-driven), this paper proposes two new fault diagnosis methods for NPPs. The first approach is an integration technique, namely Bayesian neural network method, which introduces the Bayesian formula to neural network parameters and replaces the original fixed value with a probability distribution. We apply it to nuclear power plant fault diagnosis to solve the problem in which traditional neural network fault diagnosis cannot model and express the uncertainty. The second approach adopts a hierarchical diagnosis idea which uses Bayesian network as the first level to diagnose fault types and neural network as the second level to diagnose the fault severity.
The rest of this paper is organized as follows: Section 2 introduces the relevant theory and principles, including Bayesian network, artificial neural networks, and the two new fault diagnosis methods proposed in this paper. In Section 3, the verification results are given based on typical faults data of a pressurized water reactor, and intercomparison is made on the performance of different fault diagnosis methods. In Section 4, conclusions and future research directions are given.
Bayesian theory is one of the typical representatives of knowledge-driven methods. In view of industrial systems with high safety requirements such as nuclear power plants, Bayesian theory introduces domain knowledge for modeling to get rid of the dependence on historical data.
The theoretical foundation of Bayesian methods is the Bayes theorem which describes the probability of an event under some known conditions. The formula is as follows (Hong-chun, 2010):
where A and B are random variables and
Bayesian networks (BNs) are probabilistic graphical models that present uncertain causal relationships between variables in the form of graphs using Bayes’ theorem (Friedman et al., 1997). With certain inference algorithms, BNs can predict the likelihood of possible causes given information about the events that occurred, which just fits for fault diagnosis in systems with complex and uncertain information. In addition, the diagnosis process with BNs is highly robust and interpretable. Structurally, Bayesian networks consist of nodes, directed lines and conditional probability tables. The directed lines represent the causal relationships among the nodes and the conditional probabilities represent the strength of the causal relationships. For Bayesian networks of industrial systems, the nodes represent the system parameters. A simple Bayesian network model is shown in Figure 1A. Assuming that the state information of the parameter node
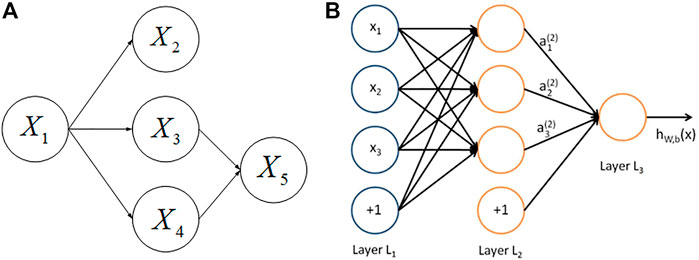
FIGURE 1. BN model (A) and BPNN model (B).
Artificial neural networks (ANNs) are mathematical models imitating the structure and function of the biological neural network for the purpose of approximating or evaluating functions (Wang 2003). ANNs can be used to learn and summarize through the experiment of known data. Through the comparison of local conditions, it can infer and produce an automatic recognition system. According to the network architecture, ANNs can be divided into feedforward neural networks (Bebis and Georgiopoulos 1994), recurrent neural networks (Medsker and Jain 1999) and reinforcement-based architectures (Baker et al., 2016). In this paper, the two proposed fault diagnosis methods introduce the most classical feedforward neural networks.
As shown in Figure 1B, this network, also known as BPNN, is a feedforward neural network with three layers, which consists of an input layer (Layer
Bayesian neural networks are an integration of Bayesian theory and neural networks. This approach differs from the traditional neural networks which use fixed weights and biases. As shown in Figure 2, The Bayesian neural network sets the weights and biases to follow a Gaussian distribution with mean μ and variance δ (MacKay et al., 1995).
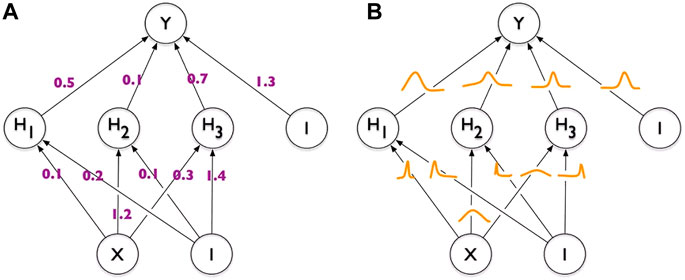
FIGURE 2. Comparison of neural network (A) and Bayesian neural network (B).
The prediction output of a traditional neural network is often a deterministic classification result, which has the issue of overconfidence. When untrained sample types are predicted, they are confidently classified into only one known type, i.e., they do not express prediction uncertainty. For nuclear power plant accidents, traditional neural networks have the potential to predict accident A as accident B without expressing the uncertainty of that outcome. This is obviously unacceptable for nuclear power plants with high safety requirements. In addition to expressing the uncertainty of the outcome, the following two types of uncertainty are described in the Bayesian neural network model (Kendall and Gal 2017):
1) Data uncertainty. In practical situations, the data are generally uncertain due to random noise, insufficient information, and other factors. For example, sensor failures, aging and other unknown random factors in nuclear power plants may cause traditional neural network models to misjudge.
2) Model uncertainty. The volume of network models is now increasing, for example, the GPT-3 model has reached nearly 100 billion parameters (Brown et al., 2020). We need to focus on whether the valid information in the training set is sufficient to support learning an optimal model. Although model uncertainty can be removed by giving sufficient data, nuclear power plants have almost no large sample of failure datasets. Therefore, there may be many conventional neural network models that perform the same on the training set, but may appear very different on the testing set.
Bayesian neural network provides an effective basis for dealing with the above two kinds of uncertainty. Its core is to transform the weight and bias into probability distribution based on the Bayesian theorem, as shown in Eq. 3
where
In the training process of BNNs, the goal is to establish the model of
The key to solving the above equation is to calculate
Substituting Eq. 4 into the above equation and assuming that the data are independently and identically distributed, we get
where,
The second term on the right side of Eq. 6 is approximated by Monte Carlo sampling, and the optimization objective
When predicting samples by BNN models, multiple predictions can be obtained by sampling the weights and biases of the network several times, and the best prediction value can be selected.
A fault diagnosis framework based on Bayesian neural network is implemented, as shown in Figure 3. Firstly, a fault diagnosis model is established based on historical data, which is processed in several steps, including historical data acquisition, selection of key parameters, data normalization, dataset construction, division of training and testing sets, training of the model, and adjustment of hyperparameters, etc. Then the real-time fault diagnosis is performed with real-time data.
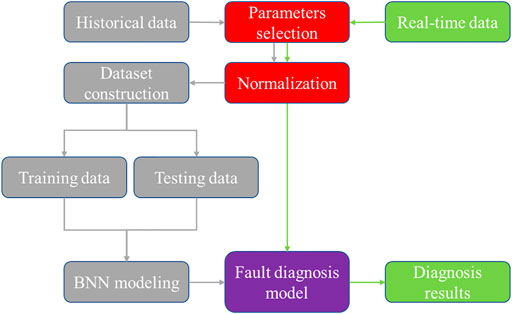
FIGURE 3. BNN fault diagnosis framework.
The SBN-ANN fault diagnosis method is a fully combined knowledge-driven and data-driven approach. The method divides the diagnosis process of faults (such as LOCA, SGTR, MSLB, etc.) into two levels in which the fault type and fault degree are diagnosed with a simplified Bayesian network and BPNN respectively.
In the first level, the knowledge-driven Bayesian network is adopted for the diagnosis of fault types. It should be noted that Bayesian networks can be also modeled by data learning. This paper chooses domain knowledge-based modeling. Especially, the normal Bayesian network are simplified for the purposes of fast modeling, avoiding rule combination explosion and obtaining higher diagnostic accuracy. The simplified method is shown in Figure 4 where all parameter nodes are directly connected to the fault nodes. The mathematical principle is as follows: the fault nodes are considered as categories and the parameter nodes are considered as attributes, assuming that the attributes are independent of each other and all attributes are only affected by the fault nodes (categories), then Eq. 1 has the following transformations.
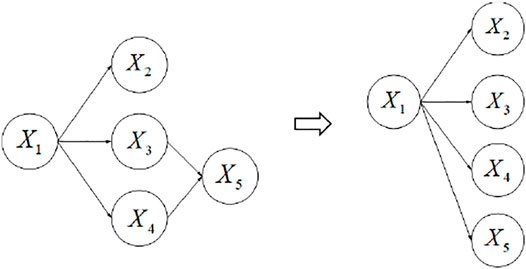
FIGURE 4. Simplified schematic diagram of a Bayesian network.
The denominator
Therefore, for highly complex systems like nuclear power plants, only the key parameters that determine the failure class need to be identified without considering the interactions between parameters, avoiding rule combination explosions and reducing the difficulty of modeling. On the other hand, the computational complexity is reduced and the inference efficiency is increased because there is no need to solve for joint probabilities
In the second level, typical data-driven method, BPNN, is used to diagnose the fault severity. Since the physical phenomena caused by the same fault are similar, it is difficult for Bayesian networks (knowledge-driven method) to diagnose the fault severity whereas this is not an issue for BPNN which has a powerful nonlinear fitting capability. The BPNN adopts a three-layer design, namely an input layer, a hidden layer, and an output layer. The input layer is the manually selected key parameters related to the fault, and the output layer is the fault severity.
A fault diagnosis framework based on Simplified Bayesian Network-Artificial Neural Network is implemented, as shown in Figure 5. Firstly, the first-level diagnosis model is established based on historical knowledge, which is processed in several steps, including the collection of domain knowledge, fault analysis, selection of key parameters, determination of node status, and construction of conditional probability table of simplified Bayesian network, etc. Secondly, the second-level diagnosis model is established based on historical data, which is processed in several steps, including data acquisition, selection of key parameters, data normalization, dataset construction, division of training and testing sets, training of the model, and adjustment of hyperparameters, etc. Then the real-time fault diagnosis is performed with real-time data.
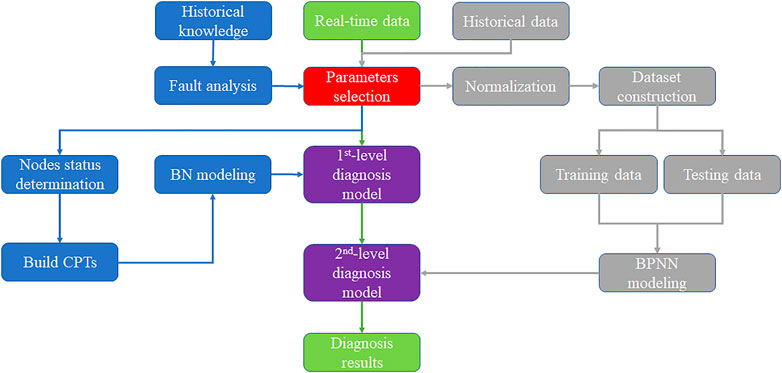
FIGURE 5. SBN-ANN fault diagnosis framework.
In this section, we take a three-loop pressurized water reactor, CPR1000, as an example to verify the performance of the two combinatorial approaches proposed in Section 2.
Three typical faults, LOCA (loss of coolant accident), MLSB (main steam line break), SGTR (steam generator tubes rupture), were selected for the study. Among them, the knowledge is derived from the description of the fault mechanisms in the CPR1000 Deterministic Safety Analysis Report (DSAR) and the Probabilistic Risk Assessment Report (PRAR). Taking the LOCA as an example, these phenomena will occur when the accident occurs according to DSAR and PRAR: pressure and water level drop in the regulator, increase in the upcharge flow, increase in the containment pressure, increase in the containment temperature, increase in the containment radioactivity, and increase in the pit water level. we extracted parameters such as RP, RWL, OF, CP, CT, CR, and PWL based on these phenomena. When the three types of accident parameters were extracted, we determined the final 12 parameters, as shown in Table 2. The data comes from the full scope simulator of the CPR1000 reactor. The simulator can simulate the basic physical processes of a nuclear power plant and perform real-time simulation of important systems of the unit, including steady-state operation of the unit, start-up and shutdown of the unit between the normal cold stop and 100% full power, power up and down at a set rate, and fault operation under equipment functional failure conditions. The full scope simulator is used to simulate the above three fault conditions and normal conditions, and the data within 1 minute of each condition is obtained. The simulator can set the severity of the fault (
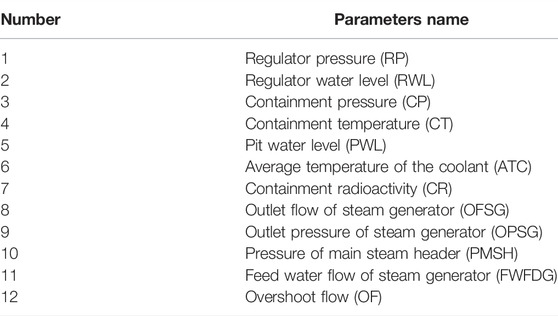
TABLE 2. Monitored physical parameters for fault diagnosis.
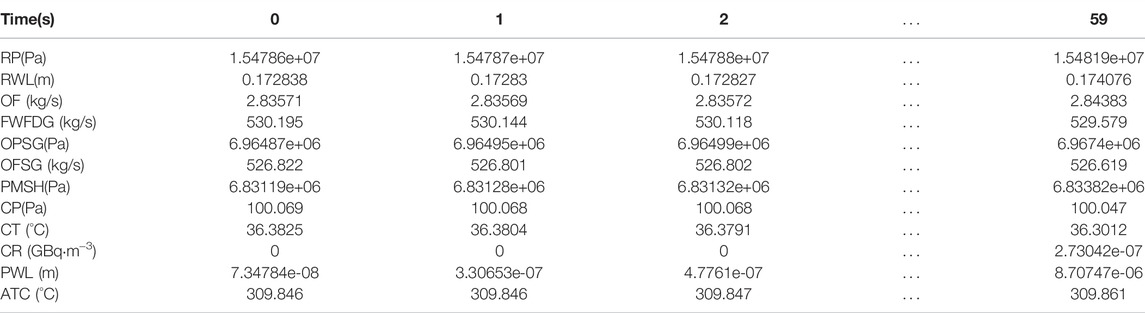
TABLE 3. A sample of data within 1 min after a LOCA.
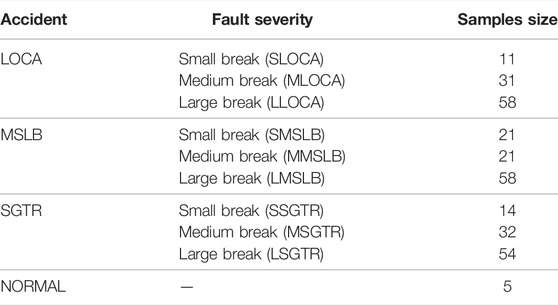
TABLE 4. Overview of the data set.
According to the diagnosis framework of BNN (Figure 3), the data obtained by the simulator needs to be normalized in the step of building the data set. The purpose is to avoid the large order of magnitude difference between parameters and reduce the diagnosis performance of the algorithm. Data normalization is to map the original data to the range of 0–1. In this paper, the min-max normalization method is adopted, and the formula is as follows (Patro and Sahu 2015):
where
BNN is based on the integration of the traditional neural network and Bayes’ theorem. It adopts a three-layer structure, in which the input layer contains 12 neurons (corresponding to the 12 parameters selected in Table 2), the hidden layer contains 14 neurons, and the output layer contains 10 neurons (corresponding to the 10 fault severity in Table 4). All parameters of the BNN model are shown in Table 5.
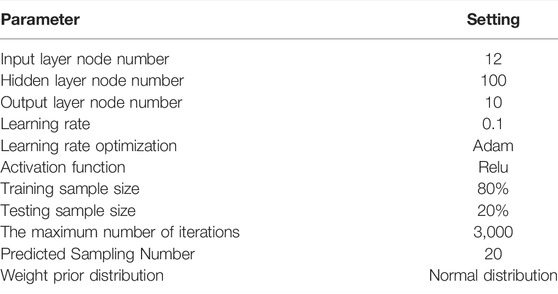
TABLE 5. BNN parameter settings.
In this method, the moments 0, 10, 30 and 50 s after the occurrence of four operating conditions were selected as diagnostic time points. BNN and BPNN models were established for each of the four moments. Considering that BNN has multiple predicted values for one test sample, the final output value of BNN is the predicted value with the largest number of percentages. The results are shown in Table 6. It is seen that although BNN has no significant advantage in diagnostic accuracy, it is advantageous in providing information about prediction uncertainty. Multiple predicted results are obtained for each test sample, which can help make more intelligent decisions in real scenarios. Specifically, partial samples of wrong predictions (50 s) are used as an example, where “proportion” indicates the proportion of output values to the total number of predictions, as shown in Table 7. BNN model samples the distribution of weight and bias 20 times during diagnosis, so each test sample has 20 predicted values. It can be seen from Table 7 that the “proportion” of these wrong predictive samples is relatively low, but the “proportion” of correct prediction results in Table 8 reaches more than 90%. Therefore, in the real scenarios, we can observe the multiple predicted results. When there are several different predicted values and the “proportion” is low, we need to combine other aspects of the diagnostic opinion for further analysis, which is the advantage of the BNN model.
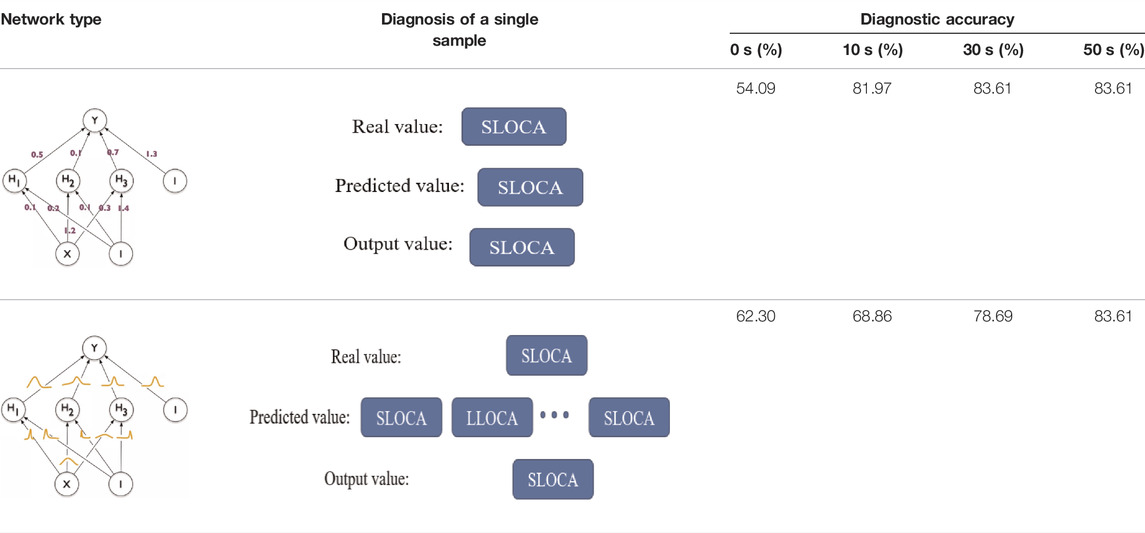
TABLE 6. Comparison of BPNN and BNN results.
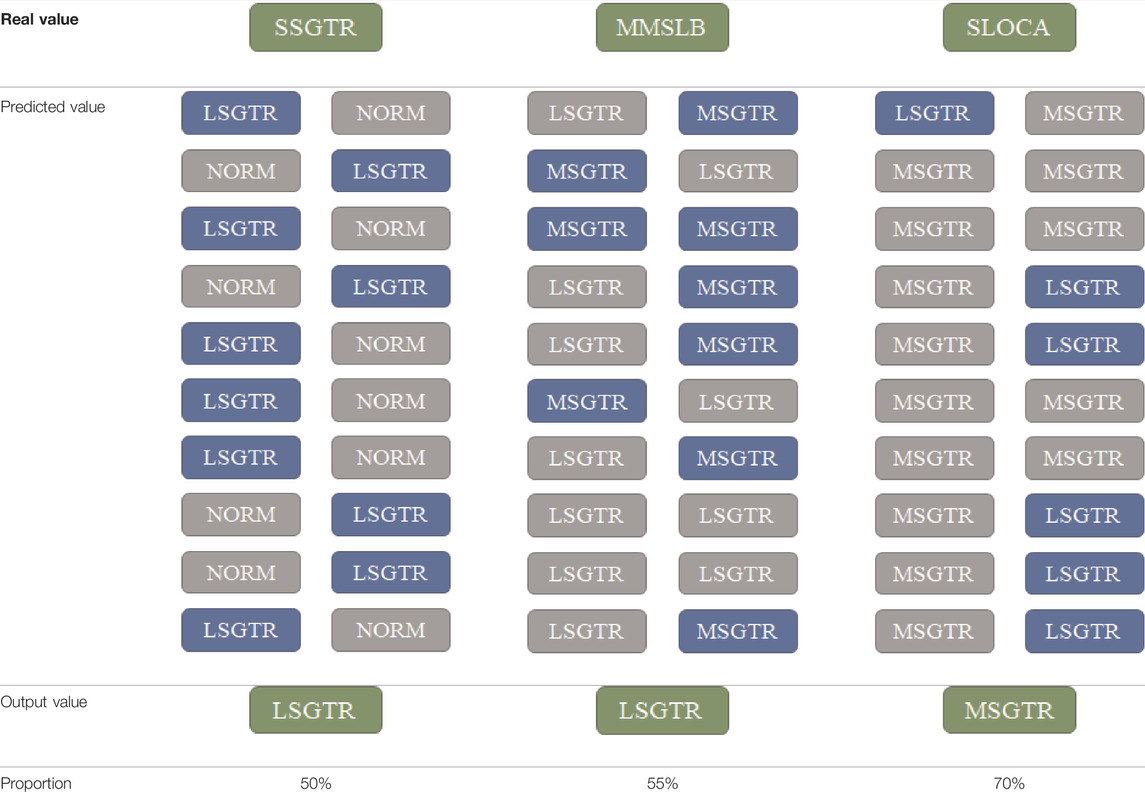
TABLE 7. Partial samples of wrong prediction.
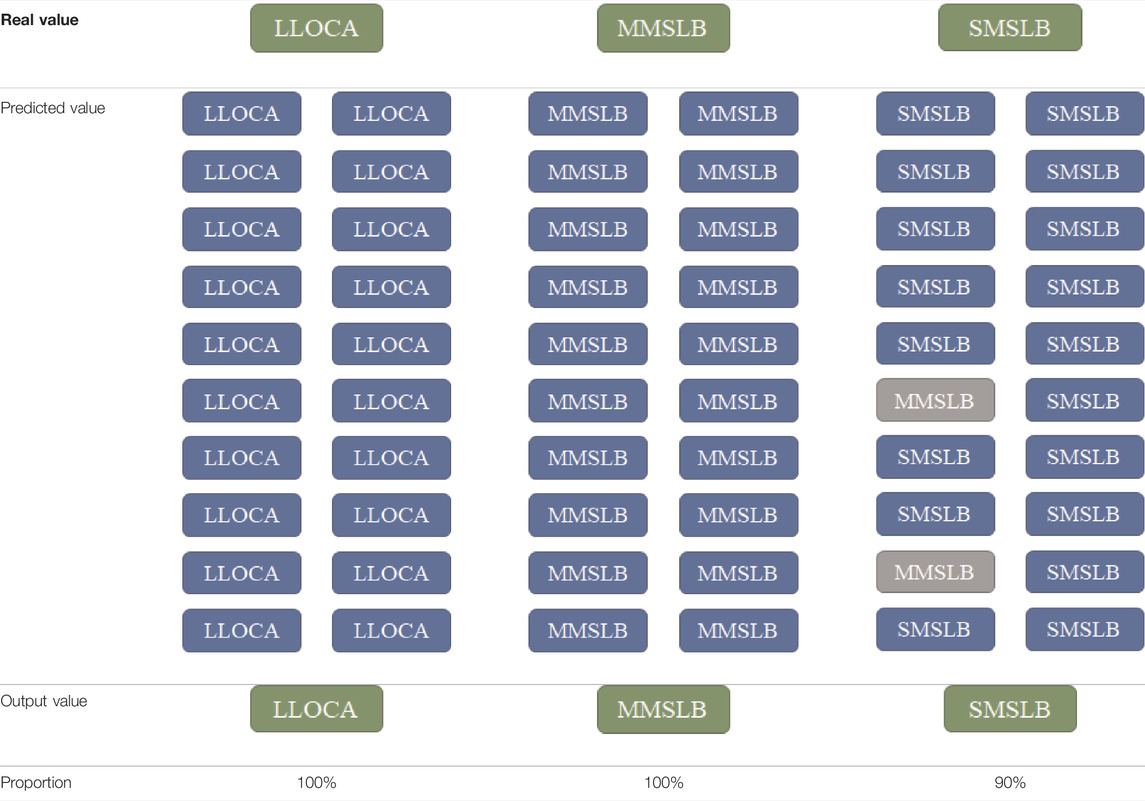
TABLE 8. Partial samples of correct prediction.
Unlike BNN, SBN-ANN adopts the hierarchical diagnosis idea. Simplified Bayesian network and BPNN are applied for the diagnosis of fault type and fault severity respectively.
A Simplified Bayesian Network for the three faults is built based on domain knowledge. Specifically, in the establishment of SBNs, key parameters of a fault in NPP are selected based on the fault mechanisms. Figure 6A gives an example to illustrate the process. After the occurrence of LOCA, a decrease in pressure (RP) and water level of the regulator (RWL), a rise in containment pressure (CP) and temperature (CT), a rise in containment radioactivity (CR), and a rise in-pit water level (PWL) will be observed.
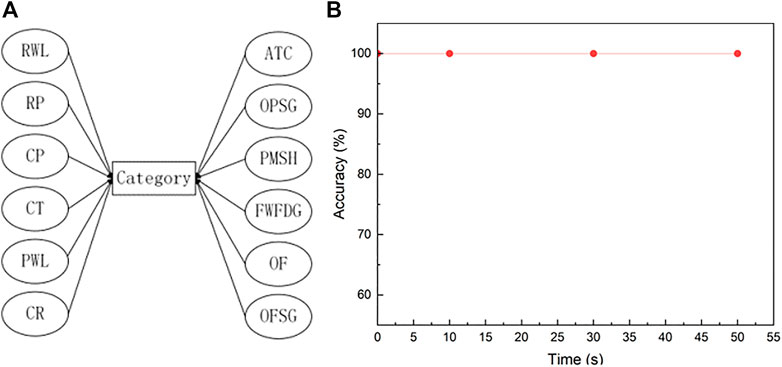
FIGURE 6. Simplified Bayesian Network (A) and diagnostic accuracy (B).
To verify the performance of Simplified Bayesian Network, the models are applied to the same test set and moments as the Bayesian neural network to diagnose the types of faults in the test set, and the diagnostic accuracy is shown in Figure 6B. The results show that the diagnostic accuracy is 100%. The simplified Bayesian network exhibits a strong diagnostic capability for fault types.
The hierarchical diagnosis method of SBN-ANN is implemented based on the verification results in Section 3.3.1. Note in SBN-ANN, simplified Bayesian network is used to diagnose the fault type and BPNN is used to diagnose the fault severity. Since three kinds of faults are selected, three neural networks are needed to diagnose their respective severity. The hierarchical diagnosis process is shown in Figure 7.
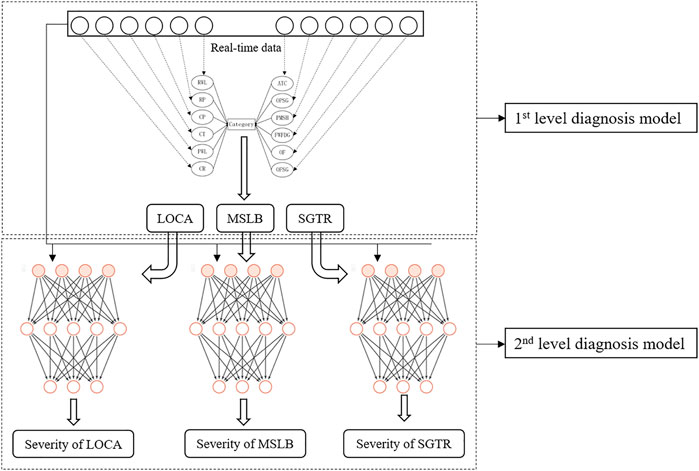
FIGURE 7. SBN-ANN graded diagnosis process.
In this method, the moments 0, 10, 30 and 50 s after the occurrence of four operating conditions are selected as diagnostic time points. The method is verified using the same testing set as the BNN. For example, in the diagnosis model with 10 s time points, the confusion matrix of the diagnosis results of SBN-ANN is shown in Figure 8. There are three neural networks in the second-level diagnostic model of SBN-ANN, and their parameter settings are shown in Table 9. The loss curves during the model training are shown in Figure 9, and the model converges relatively fast. As shown in Figure 8, for the first-level diagnosis results, all four types of samples are accurately predicted. For the second level diagnostic results, both LOCA and MSLB accident severity categories are accurately predicted. In the SGTR, two LSGTRs were incorrectly diagnosed as MSGTRs, which was due to the artificial severity range that made the model misdiagnose when the LSGTR and MSGTR break sizes were close to each other. Overall, the diagnostic accuracy of the model was significantly higher than that of BNN. Meanwhile, the first-level diagnostic model is a simplified Bayesian network rather than a black-box model like neural network, which has natural interpretability and is easily accepted by nuclear regulators. The diagnostic results at 0, 10, 30 and 50 s are shown in Figure 10. The diagnostic accuracy of the first level is 100%, the second level is close to 100%, and the overall diagnostic accuracy is close to 100%, which is much higher than the previous diagnostic performance of BNN and BPNN.
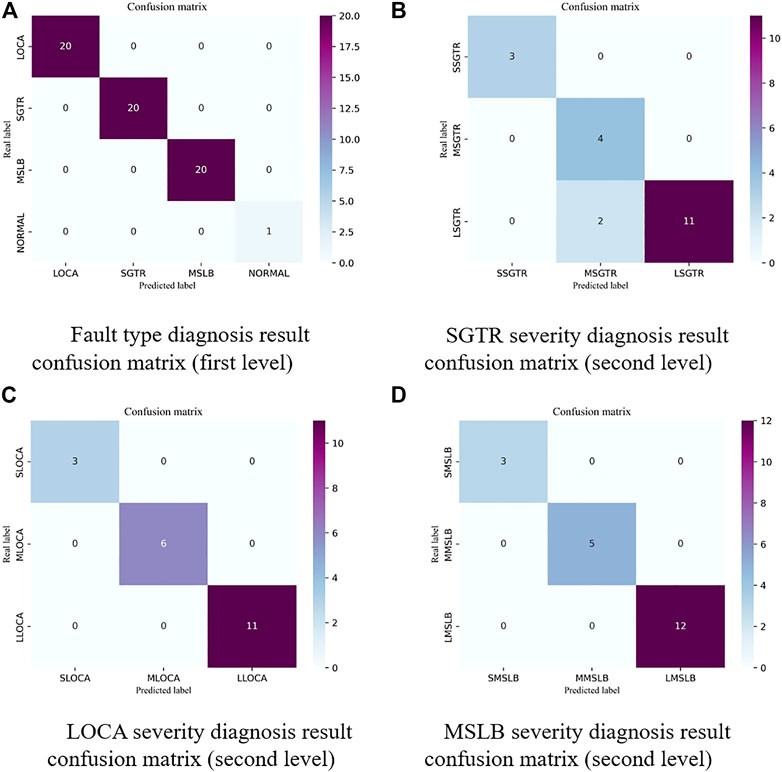
FIGURE 8. Confusion matrix of diagnostic results of SBN-ANN model at 10 s moment. (A) Fault type diagnosis result confusion matrix (first level) (B) SGTR severity diagnosis result confusion matrix (second level) (C) LOCA severity diagnosis result confusion matrix (second level) (D) MSLB severity diagnosis result confusion matrix (second level).
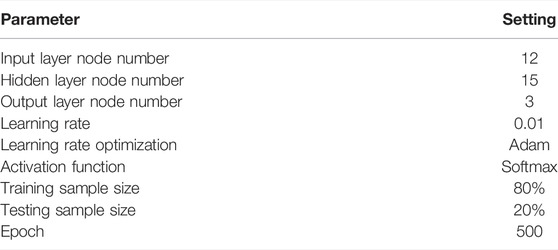
TABLE 9. Parameter settings for three types of neural networks.
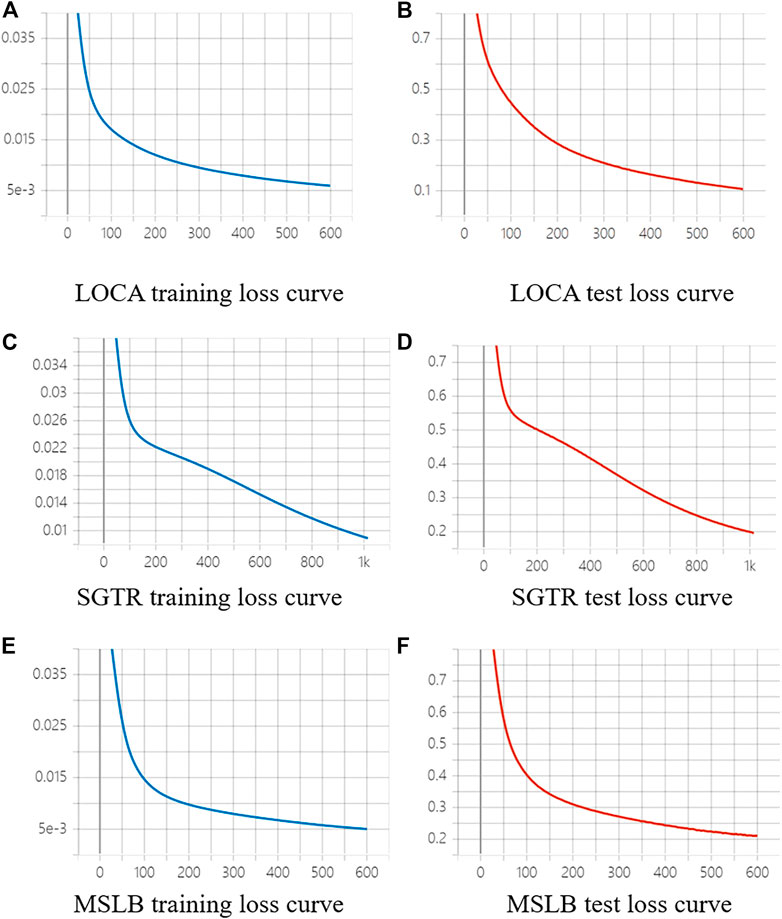
FIGURE 9. Loss curves of three neural networks for the secondary diagnosis model of SBN-ANN. (A) LOCA training loss curve (B) LOCA test loss curve (C) SGTR training loss curve (D) SGTR test loss curve (E) MSLB training loss curve (F) MSLB test loss curve.
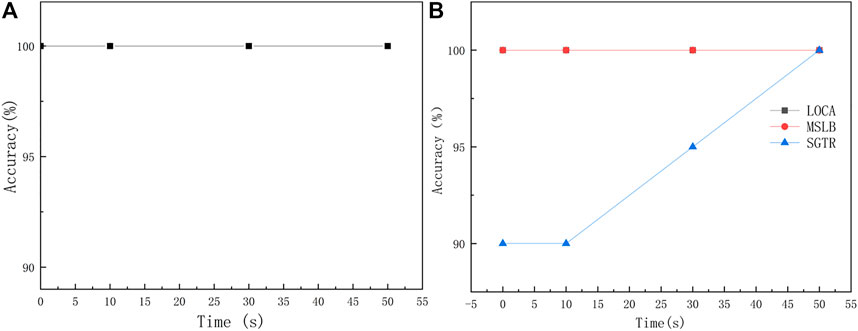
FIGURE 10. Accuracy of SBN-ANN (A) accuracy of first level diagnosis (B) accuracy of second level diagnosis.
Knowledge-driven and data-driven are two main categories of methodologies for intelligent fault diagnosis in nuclear power plants. Knowledge-driven methods have good interpretability and high robustness, but the modeling complexity is high and the inference efficiency is low. While the data-driven methods are simple in modeling and usually show high inference efficiency, the interpretability and robustness are poor. There has been a lack of research that takes full advantage of both knowledge-driven and data-driven methods. Thus, this paper makes an attempt to explore combinatorial approaches for the sake of performance improvement of fault diagnosis. Specifically, with Bayesian theory (knowledge-driven) and neural networks (data-driven) as the basic methods, two new fault diagnosis frameworks are proposed based on integration or combination techniques. Comparative analyses of BPNN and BNN, BN and SBN-ANN are given in Section 3.2 and Section 3.3, respectively. Combined with the diagnostic process, the comparative results of the four methods are given, as shown in Table 10, where DD stands for data-driven and KD stands for Knowledge-driven. In terms of robustness, Wu et al. demonstrated the robustness of Bayesian networks in the face of incomplete information (Wu, Tong et al., 2018). It is shown that the comprehensive performance of the two methods proposed in this paper is significantly better than that of a single data-driven or knowledge-driven method.
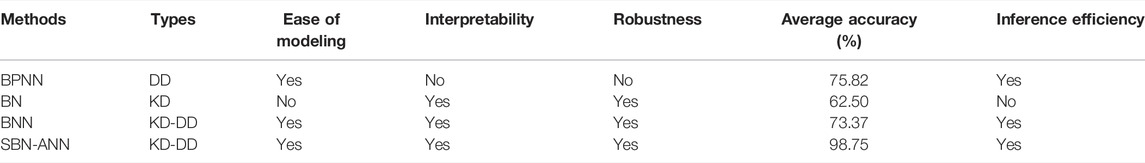
TABLE 10. The comparative results of the four methods.
The first is the Bayesian Neural Network (BNN) diagnosis framework. BNN improves the overconfidence of traditional neural network diagnosis. The uncertainty of the data and the uncertainty of the model are modeled using a Bayesian formulation, and the weights and biases of the neural network are transformed into probability distributions. The method can give multiple diagnostic results for the same fault. When multiple diagnostic results are inconsistent, other auxiliary methods can be used to make further decisions. Thus, BNN is capable to make more reasonable decisions in fault scenarios than traditional neural networks in NPPs.
The second is the Simplified Bayesian Network-Artificial Neural Network (SBN-ANN) diagnosis framework which adopts a two-step hierarchical diagnosis scheme. The fault type and fault degree are diagnosed in two steps respectively. Considering that the existing domain knowledge is sufficient and the diagnosis of fault types requires high interpretability, the first step uses Bayesian networks model. The second step, on the other hand, uses neural networks, to make the most of their strong nonlinear fitting ability. Numerical results on the PWR simulation show that the SBN-ANN framework performs quite well. It gives nearly 100% accuracy in fault type diagnosis with good interpretability of the results using SBN, while also showing high efficiency in the diagnosis of fault severity with BPNN. The framework successfully demonstrates the feasibility and effectiveness in the combination of knowledge-driven and data-driven methods.
It should be noted this work is just a start of investigation on data and knowledge dual-drive technologies for fault diagnosis. More combinatorial approaches are to be explored with this work as a reference. For example, in the Bayesian Neural Network framework, instead of using BPNN, other neural networks such as convolution neural networks can also integrated with Bayesian theorem to form new frameworks. Likewise, as an example built upon the hierarchical diagnosis idea, the Simplified Bayesian Network-Artificial Neural Network can also be extended to plenty of new forms. More innovative methods as well as further evaluation and applications of these methods will be investigated in the future work.
The raw data supporting the conclusion of this article will be made available by the authors, without undue reservation.
BQ: Methodology, numerical simulation, writing- original draft preparation. LZ: Conceptualization, simulation result evaluation. JL: Conceptualization, supervision, writing- reviewing and editing, funding acquisition. JT: Supervision, resources.
The research was supported by the Innovation Funds of CNNC-Tsinghua Joint Center for Nuclear Energy R&D, grant from National Natural Science Foundation of China, and the faculty start-up funds of Tsinghua University.
The authors declare that the research was conducted in the absence of any commercial or financial relationships that could be construed as a potential conflict of interest.
All claims expressed in this article are solely those of the authors and do not necessarily represent those of their affiliated organizations, or those of the publisher, the editors and the reviewers. Any product that may be evaluated in this article, or claim that may be made by its manufacturer, is not guaranteed or endorsed by the publisher.
Baker, B., Gupta, O., Naik, N., and Raskar, R. (2016). Designing Neural Network Architectures Using Reinforcement Learning 8 (03), 42–54.
Baraldi, P., Di Maio, F., and Zio, E. (2013). Unsupervised Clustering for Fault Diagnosis in Nuclear Power Plant Components. Ijcis 6 (4), 764–777. doi:10.1080/18756891.2013.804145
Bebis, G., and Georgiopoulos, M. (1994). Feed-forward Neural Networks. IEEE Potentials 13 (4), 27–31. doi:10.1109/45.329294
Bergman, S., and Åström, K. J. (1983). Fault Detection in Boiling Water Reactors by Noise Analysis. Tennessee: University of Tennessee.
Brown, T. B., Mann, B., Ryder, N., Subbiah, M., Kaplan, J., Dhariwal, P., et al. (2020). Language Models Are Few-Shot Learners 33, 1877–1901. doi:10.48550/arXiv.2005.14165
Buckley, J. J., Siler, W., and Tucker, D. (1986). A Fuzzy Expert System. Fuzzy Sets Syst. 20 (1), 1–16. doi:10.1016/s0165-0114(86)80027-6
Chao-jun, L., Chun-ming, Z., Yan, C., Jia-xu, Z., and Jia-yun, C. (2013). The Study on Safety Goals and Public Acceptance of Nuclear Power. Energy Procedia 39, 415–422. doi:10.1016/j.egypro.2013.07.231
Ciftcioglu, Ö., Sariyildiz, S., and van der Veer, P. (1970). “A Unified Approach for Complex Problem Solving: Method Integration,” in WIT Transactions on Information and Communication Technologies (Boston: WIT Press), 20.
Dietterich, T. G. (2017). Steps toward Robust Artificial Intelligence. AIMag 38 (3), 3–24. doi:10.1609/aimag.v38i3.2756
Feng, , Shen, , and Shifei, L. (2003). The Design of Rule-Based Neural Network System for Fault Diagnosis of Nuclear Power Plant [J] (22), 212–214. doi:10.3321/j.issn:1002-8331.2003.22.069
Friedman, N., Geiger, D., and Goldszmidt, M. (1997). Bayesian Network Classifiers. Mach. Learn. 29 (2), 131–163. doi:10.1023/a:1007465528199
Gao, Z., Cecati, C., and Ding, S. X. (2015). A Survey of Fault Diagnosis and Fault-Tolerant Techniques-Part I: Fault Diagnosis with Model-Based and Signal-Based Approaches. IEEE Trans. Ind. Electron. 62 (6), 3757–3767. doi:10.1109/tie.2015.2417501
Guliyev, N. J., and Ismailov, V. E. (2016). A Single Hidden Layer Feedforward Network with Only One Neuron in the Hidden Layer Can Approximate Any Univariate Function. Neural Comput. 28 (7), 1289–1304. doi:10.1162/neco_a_00849
Guohua, W., Diping, Y., Jiyao, Y., Yiqing, X., and Dongxu, J. (2021). A Framework for Monitoring and Fault Diagnosis in Nuclear Power Plants Based on Signed Directed Graph Methods. Front. Energy Res. 9, 59. doi:10.3389/fenrg.2021.641545
Guohua, W., Jiaxin, W., Diping, Y., and Yiqing, X. (2020). “Research on Fault Diagnosis Based on Hierarchical Signed Directed Graph for Nuclear Power Plants,” in International Conference on Nuclear Engineering (American Society of Mechanical Engineers ASME). doi:10.1115/icone2020-16192
Hong-chun, W. (2010). Research on Bayesian Formula and Bayesian Statistics [j] 6, 203–205. doi:10.3969/j.issn.1673-1980.2010.03.064
Jamil, F., Abid, M., Haq, I., Khan, A. Q., and Iqbal, M. (2016). Fault Diagnosis of Pakistan Research Reactor-2 with Data-Driven Techniques. Ann. Nucl. Energy 90, 433–440. doi:10.1016/j.anucene.2015.12.023
Jian-Bo Yang, J.-B., Jun Liu, J., Jin Wang, J., Sii, H.-S., and Wang, H.-W. (2006). Belief Rule-Base Inference Methodology Using the Evidential Reasoning Approach-RIMER. IEEE Trans. Syst. Man. Cybern. A 36 (2), 266–285. doi:10.1109/tsmca.2005.851270
Jiang, B. T., Zhou, J., and Huang, X. B. (2020). “Artificial Neural Networks in Condition Monitoring and Fault Diagnosis of Nuclear Power Plants: A Concise Review,” in International Conference on Nuclear Engineering (American Society of Mechanical Engineers ASME). doi:10.1115/icone2020-16334
Jordan, M. I., and Mitchell, T. M. (2015). Machine Learning: Trends, Perspectives, and Prospects. Science 349 (6245), 255–260. doi:10.1126/science.aaa8415
Kendall, A., and Gal, Y. (2017). “What Uncertainties Do We Need in Bayesian Deep Learning for Computer Vision?,” in Proceedings of the 31st International Conference on Neural Information Processing Systems.
Kim, I. S., and Safety, S. (1994). Computerized Systems for On-Line Management of Failures: a State-Of-The-Art Discussion of Alarm Systems and Diagnostic Systems Applied in the Nuclear Industry. Reliab. Eng. Syst. Saf. 44 (3), 279–295. doi:10.1016/0951-8320(94)90019-1
Liu, Y., Xia, H., Xie, C., Chen, Z., and Chen, H. (2007). Study on Intelligence Fault Diagnosis Method for Nuclear Power Plant Equipment Based on Rough Set and Fuzzy Neural Network. 28 (1), 110–114. doi:10.3969/j.issn.0258-0926.2007.01.025
Lo, C. H., Wong, Y. K., and Rad, A. B. (2006). Intelligent System for Process Supervision and Fault Diagnosis in Dynamic Physical Systems. IEEE Trans. Ind. Electron. 53 (2), 581–592. doi:10.1109/tie.2006.870707
MacKay, D. (1995). Methods in Physics Research Section A: Accelerators, Detectors and A. Equipment. Bayesian neural Netw. density Netw. 354 (1), 73–80. doi:10.1016/0168-9002(94)00931-7
Medsker, L., and Jain, L. C. (1999). Recurrent Neural Networks: Design and Applications. Boca Raton: CRC Press.
Ming, Y., Jianfei, L., Minjun, P., Shengyuan, Y., and Zhijian, Z. (2006). “A Hybrid Approach for Fault Diagnosis Based on Multilevel Flow Models and Artificial Neural Network,” in 2006 International Conference on Computational Inteligence for Modelling Control and Automation and International Conference on Intelligent Agents Web Technologies and International Commerce (CIMCA'06) (IEEE). doi:10.1109/cimca.2006.9
Mu, Y., and Xia, H. (2010). “A Study on Fault Diagnosis Technology of Nuclear Power Plant Based on Decision Tree,” in International Conference on Nuclear Engineering. doi:10.1115/icone18-29510
Nie, H., and Zhang, Q. (2021). A New Inference Algorithm of Dynamic Uncertain Causality Graph Based on Conditional Sampling Method for Complex Cases. IEEE Access 9, 94523–94536. doi:10.1109/access.2021.3093205
Patro, S., and Sahu, K. K. (2015). Normalization: A Preprocessing Stage (arXiv eprints,2015: arXiv: 1503.06462). doi:10.17148/iarjset.2015.2305
Peng, B.-S., Xia, H., Liu, Y.-K., Yang, B., Guo, D., and Zhu, S.-M. (2018a). Research on Intelligent Fault Diagnosis Method for Nuclear Power Plant Based on Correlation Analysis and Deep Belief Network. Prog. Nucl. Energy 108, 419–427. doi:10.1016/j.pnucene.2018.06.003
Peng, M.-J., Wang, H., Chen, S.-S., Xia, G.-L., Liu, Y.-K., Yang, X., et al. (2018b). An Intelligent Hybrid Methodology of On-Line System-Level Fault Diagnosis for Nuclear Power Plant. Nucl. Eng. Technol. 50 (3), 396–410. doi:10.1016/j.net.2017.11.014
Saeed, H. A., Peng, M.-j., Wang, H., and Zhang, B.-w. (2020). Novel Fault Diagnosis Scheme Utilizing Deep Learning Networks. Prog. Nucl. Energy 118. doi:10.1016/j.pnucene.2019.103066
Shi, X.-C., Xie, C.-L., and Wang, Y.-H. (2006). Nuclear Power Plant Fault Diagnosis Based on Genetic-RBF Neural Network. J. Mar. Sc. Appl. 5 (3), 57–62. doi:10.1007/s11804-006-0064-1
Sutton, R., and Parkins, M. (1991). “Early Detection of Steam Leaks in Nuclear Plant,” in International Conference on Control 1991 (Edinburgh, United Kingdom: IET). Control'91.
Tierney, L., and Mira, A. (1999). Some Adaptive Monte Carlo Methods for Bayesian Inference. Stat. Med. 18 (17‐18), 2507–2515. doi:10.1002/(sici)1097-0258(19990915/30)18:17/18<2507:aid-sim272>3.0.co;2-j
Wang, H., Peng, M.-j., Wesley Hines, J., Zheng, G.-y., Liu, Y.-k., and Upadhyaya, B. R. (2019). A Hybrid Fault Diagnosis Methodology with Support Vector Machine and Improved Particle Swarm Optimization for Nuclear Power Plants. ISA Trans. 95, 358–371. doi:10.1016/j.isatra.2019.05.016
Wang, S.-C. (2003). “Artificial Neural Network,” in Interdisciplinary Computing in Java Programming (Springer), 81–100. doi:10.1007/978-1-4615-0377-4_5
Wu, G., Tong, J., Zhang, L., Zhao, Y., and Duan, Z. (2018). Framework for Fault Diagnosis with Multi-Source Sensor Nodes in Nuclear Power Plants Based on a Bayesian Network. Ann. Nucl. Energy 122, 297–308. doi:10.1016/j.anucene.2018.08.050
Wu, G., Zhang, L., and Tong, J. (2017). “Online Fault Diagnosis of Nuclear Power Plants Using Signed Directed Graph and Fuzzy Theory,” in International Conference on Nuclear Engineering (American Society of Mechanical Engineers ASME). doi:10.1115/icone25-66367
Xia, H., and Zhang, N. (2010). “Study on Fault Diagnosis Technology Based on Support Vector Machine. Progress Report on Nuclear Science and Technology in China (Vol. 1),” in Proceedings of Academic Annual Meeting of China Nuclear Society in 2009. No. 3--nuclear power sub-volume (Pt. 2).
Yang, J.-B., Liu, J., Xu, D.-L., Wang, J., and Wang, H. (2007). Optimization Models for Training Belief-Rule-Based Systems. IEEE Trans. Syst. Man. Cybern. A 37 (4), 569–585. doi:10.1109/tsmca.2007.897606
Yong-Kuo, L., Hong, X., and Chun-Li, X. (2005). Application of Fuzzy Neural Network to the Nuclear Power Plant in Process Fault Diagnosis. J. Mar. Sc. Appl. 4 (1), 34–38. doi:10.1007/s11804-005-0043-y
Zhang, Y., Hongxing, L., Yang, M., and Yoshikawa, H. (2018). Integrated Defense-In Depth (DiD) Risk Analysis System for Safety Operation of Nuclear Power Plants. IFAC-PapersOnLine 51 (24), 1364–1367. doi:10.1016/j.ifacol.2018.09.557
Zhao, Y., Di Maio, F., Zio, E., Zhang, Q., Dong, C.-L., and Zhang, J.-Y. (2017). Optimization of a Dynamic Uncertain Causality Graph for Fault Diagnosis in Nuclear Power Plant. Nucl. Sci. Tech. 28 (3), 34. doi:10.1007/s41365-017-0184-0
Keywords: fault diagnosis, nuclear power plant, data-driven, knowledge-driven, bayesian neural network
Citation: Qi B, Zhang L, Liang J and Tong J (2022) Combinatorial Techniques for Fault Diagnosis in Nuclear Power Plants Based on Bayesian Neural Network and Simplified Bayesian Network-Artificial Neural Network. Front. Energy Res. 10:920194. doi: 10.3389/fenrg.2022.920194
Received: 14 April 2022; Accepted: 10 May 2022;
Published: 20 June 2022.
Edited by:
Jun Wang, University of Wisconsin-Madison, United StatesReviewed by:
Guohua Wu, Harbin Institute of Technology, ChinaCopyright © 2022 Qi, Zhang, Liang and Tong. This is an open-access article distributed under the terms of the Creative Commons Attribution License (CC BY). The use, distribution or reproduction in other forums is permitted, provided the original author(s) and the copyright owner(s) are credited and that the original publication in this journal is cited, in accordance with accepted academic practice. No use, distribution or reproduction is permitted which does not comply with these terms.
*Correspondence: Jingang Liang, amluZ2FuZ0B0c2luZ2h1YS5lZHUuY24=
Disclaimer: All claims expressed in this article are solely those of the authors and do not necessarily represent those of their affiliated organizations, or those of the publisher, the editors and the reviewers. Any product that may be evaluated in this article or claim that may be made by its manufacturer is not guaranteed or endorsed by the publisher.
Research integrity at Frontiers
Learn more about the work of our research integrity team to safeguard the quality of each article we publish.