 Wu Qirong
 Wu Mengli1
- 1State Power Investment Corporation Yuanda Environmental Protection Engineering Co., Ltd., Chongqing, China
- 2State Key Laboratory of Coal Mine Disaster Dynamics and Control, College of Resources and Environmental Science, Chongqing University, Chongqing, China
- 3Chongqing University of Technology, Chongqing, China
The wet flue gas desulfurization (WFGD) system is widely used in coal-fired power plants worldwide. Improving its efficiency is very important for economical running. In this study, SO2 removal by the spray scrubber by adding a new sieve tray was studied and compared to that by the traditional spray scrubber without a sieve tray (the WFGD system). The effects of gas flow rate, liquid flow rate, inlet SO2 concentration, and pH value on both types of scrubbers were evaluated. Pore diameter and porosity of the sieve tray in the sieve-tray spray scrubber were determined, and its enhanced efficiency under different experimental conditions was calculated. The results showed that the enhanced efficiency increased with the increasing liquid flow rate, gas flow rate under the same liquid/gas ratio (L/G), and pH value. Compared to the spray scrubber without a sieve tray, the sieve-tray spray scrubber had significantly higher efficiency. The enhanced efficiencies were mostly between 20% and 60% in the experimental range.
1 Introduction
Sulfur dioxide (SO2) is one of the major air pollutants which can cause great damage to human health and environmental sustainability (Braghiroli et al., 2019). SO2 is mostly produced by industrial activities, especially in the process of burning fossil fuels in the power plants. More and more policies have been announced on reducing SO2 emissions in many countries; furthermore, the pollutant emission standards have become increasingly strict over the past 10 years (Zhu et al., 2015; Liu et al., 2016a). For instance, a new environmental protection policy called the ultra-low emission regulation was announced in China, which sets the limit of SO2 emission from all coal-fired boilers with a generation capacity of more than 300 MW to 35 mg/m3, which is stricter than the limits set by other countries (about 200 mg/m3) (Moullec, 2011; Kermani, 2018). It is a challenge to accomplish the ultra-low emission requirement of 35 mg/m3 for SO2 while it caused more energy consumption.
Due to the high SO2 removal efficiency and reliability and low energy consumption (Liu et al., 2016b), wet flue gas desulfurization (WFGD) using lime or limestone slurry is widely employed in coal-fired power plants and other industries. For meeting the increasingly stringent environmental requirements and improving the cleanliness of coal utilization, many methods have been developed to improve the SO2 removal efficiency. Adding more spray layers to improve the liquid-gas ratio or a new WFGD tower for forward removal of SO2 is a common method, while these methods require additional energy input and expensive investment costs (Tong et al., 2019). A different method is to use a new technology or innovative materials (Pedrolo et al., 2017; Gao and He, 2018), such as a high-gravity rotating packed bed (Chen et al., 2020) or alkaline solvents in a membrane contactor (Zhao and Liang, 2014). However, the SO2 removal process or sorbents used in these methods need to be changed, which is highly costly since 90% of the existing SO2 removal systems worldwide use the WFGD system (Moullec, 2011). In order to lower the investment cost for ultra-low emission requirements, some improvement methods have been studied, such as optimizing the layout of the spray layer and sprayers’ distribution (Zhao and Liang, 2014), rectifying nozzles (Schick, 2014), adding an internal rod bank (Dai, 2017) or a sieve tray to the spray scrubber (Wu et al., 2019a). Among these strategies, using a sieve tray which requires only minor modifications of the existing WFGD system of power plants is considered the most promising strategy that can improve the removal of SO2 and other pollutants.
Sieve trays widely used in distillation are generally divided into two groups: 1) sieve tray with downcomers and 2) sieve tray without downcomers. The sieve tray with downcomers has an effective area of 60–70% of the column cross-sectional area (Ludwig, 1997). A sieve tray without a downcomer has a larger bubbling/effective area, so it can increase 20%–30% capacity and lower the pressure drop, but has lower efficiency than a sieve tray with downcomers (Gondosurohardjo et al., 2019). Sieve trays without downcomers are known to cause the countercurrent flow of liquid and vapor. Thus, they are also often called sieve trays with the dual flow or dual-flow sieve trays and are widely used in the chemical industry (Flávio et al., 2014). Although the sieve-tray column with several sieve trays (Figure 1A) has high efficiency for mass transfer, it cannot be used in power plants to enhance the SO2 removal because a mixture of CaCO3, CaSO4, and CaSO3 is generated in the WFGD system, and the flue gas contains a large number of dust particles that can easily lead to column blockage (Wu et al., 2019b). In the traditional WFGD spray scrubber (Figure 1B), the non-uniform distribution of the gas and liquid can decrease the mass transfer efficiency (Liu et al., 2016b). Thus, a new sieve-tray spray scrubber (Figure 1C), which contains both the spray layers and the sieve tray, should help improve the SO2 removal efficiency and reduce the risk of blockage. In the new spray scrubber, the original spray layers are retained, and only a sieve tray is reinstalled. Compared with the method of adding a nozzle or rectifying a spray layer, it can greatly eliminate the investment cost and enhance efficiency.
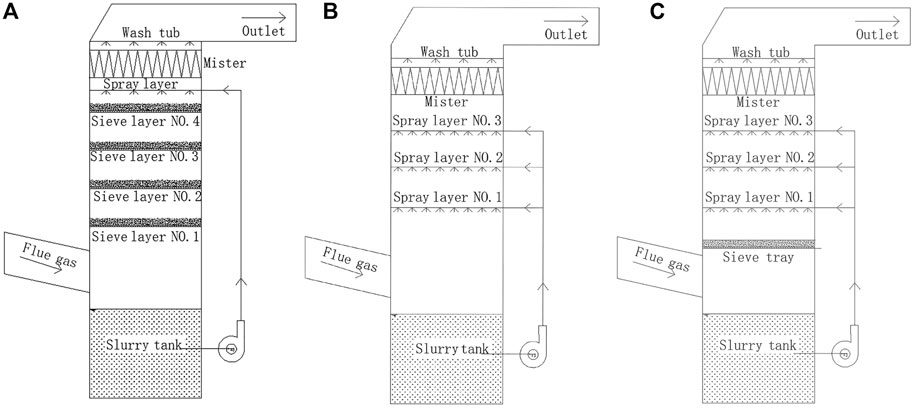
FIGURE 1. Schematic diagrams of the (A) sieve-tray column, (B) spray scrubber, and (C) sieve-tray spray scrubber.
In the sieve-tray spray scrubber, one sieve tray is installed under the spray layers to regularize the gas flow and generate a foam layer on the sieve tray. The gas and slurry on the sieve tray can interact with each other, in addition to the strong washing effect of the spray layer. As a result, the sieve tray cannot be easily blocked. Some industrial applications have indicated that the WFGD system with a sieve tray has higher SO2 removal efficiency than that without a sieve tray (Wu et al., 2019a; Gondosurohardjo et al., 2019; Junhua, 2019). However, most of these applications are based on an overall observation; the precise effect of the sieve tray on the SO2 removal has not been observed. For this reason, the effect of the sieve trays on the enhanced SO2 removal efficiency remains unclear.
Therefore, this study comprehensively analyzed the factors affecting the SO2 removal efficiency of the spray scrubber and the sieve-tray spray scrubber, including the gas flow rate, slurry flow rate, pH value, SO2 concentration, and pore diameter and porosity of sieve trays. The enhanced efficiency of the sieve tray was then evaluated based on these experimental data.
2 Experiment Apparatus and Materials
Figure 2 presents the experimental setup of the WFGD system. The spray scrubber is a vertical transparent perspex column with a length of 2.0 m and an inner diameter of 0.15 m. There are two spray layers (SN) and a mist eliminator (DM) on the top of the column. In sieve-tray spray scrubber experiments, a sieve tray was installed at the bottom of the spray nozzles.
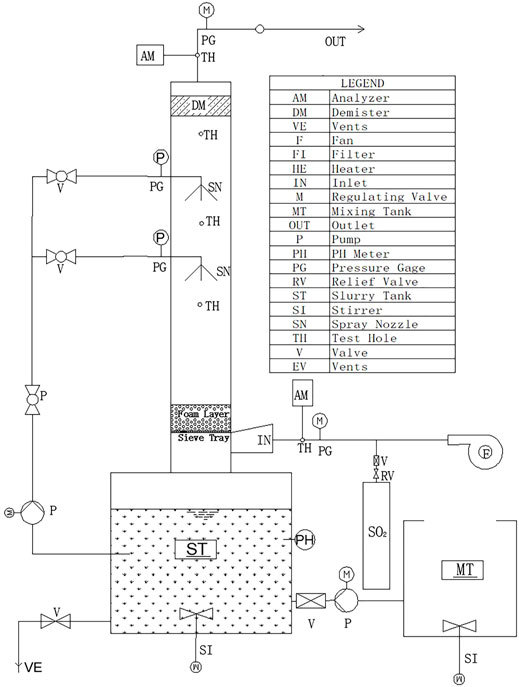
FIGURE 2. Diagram showing the experimental setup of the WFGD system.
The simulated flue gas was a mixture of air and SO2 from a gas cylinder (SO2 > 99%) and was pumped into the scrubber with a fan (V). After SO2 in the flue gas reacted with the slurry of lime or limestone, which was sprayed from the spray nozzles, the clean gas was exhausted from the scrubber outlet (OUT). The desulfurizing reactant was used with a lime solution and was dissolved in the mixing tank (MT) with CaO powder (99.9%, Wuxi Pridechem Co., Ltd.). The lime solution was pumped into the slurry tank by a peristaltic pump (Kamoer Co., Ltd.). The pumping volume of the peristaltic pump was automatically controlled by the fixed pH value of the slurry tank. A slurry tank with a capacity of 0.064 m3 was used as a slurry reservoir from which the slurry was pumped out (P). The slurry flow rate was controlled by two valves (V) and was monitored by two in-line flow meters. The concentration of the lime/gypsum slurry was kept constant at 15% by a valve (V) and vents (VE) at the bottom of the slurry tank (ST). The gas temperature of the outlet was maintained at a constant value of 40°C. SO2 was sampled from the test holes (TH) at the inlet and outlet simultaneously, where its concentration was measured by using two flue gas analyzers (Testo 350).
3 Results and Discussion
SO2 removal efficiency could be affected by many factors, such as the slurry pH value, droplet diameter, gas flow rate, slurry flow rate, slurry composition, temperature, inlet SO2 concentration, and structural parameters of the scrubber (Li, 2009; Wu et al., 2019b). Most of the operational parameters are now fixed for an applied WFGD system. Considering the real running conditions in the industrial application (Lin, 2006), the gas flow rate, slurry flow rate, pH value, and SO2 concentration were investigated herein because they are the normal adjustable parameters in the real running. In this article, the SO2 removal efficiency of the spray scrubber with and without a sieve tray was compared based on these four parameters.
The SO2 removal efficiency was calculated by the following equation (Yi et al., 2018):
where ηSO2 is the SO2 removal efficiency of the spray scrubber (%), CSO2 is the inlet SO2 concentration (mg/m3), and
3.1 Total Sulfur Dioxide Removal Efficiency of the Spray Scrubber Without a Sieve Tray
The effects of the gas flow rate (VG), slurry flow rate (VL), gas flow rate under the same L/G, SO2 concentration (CSO2), and pH value (pH) on the SO2 removal efficiency (ηSO2) of a spray scrubber without a sieve tray are shown in Figures 3A–E.
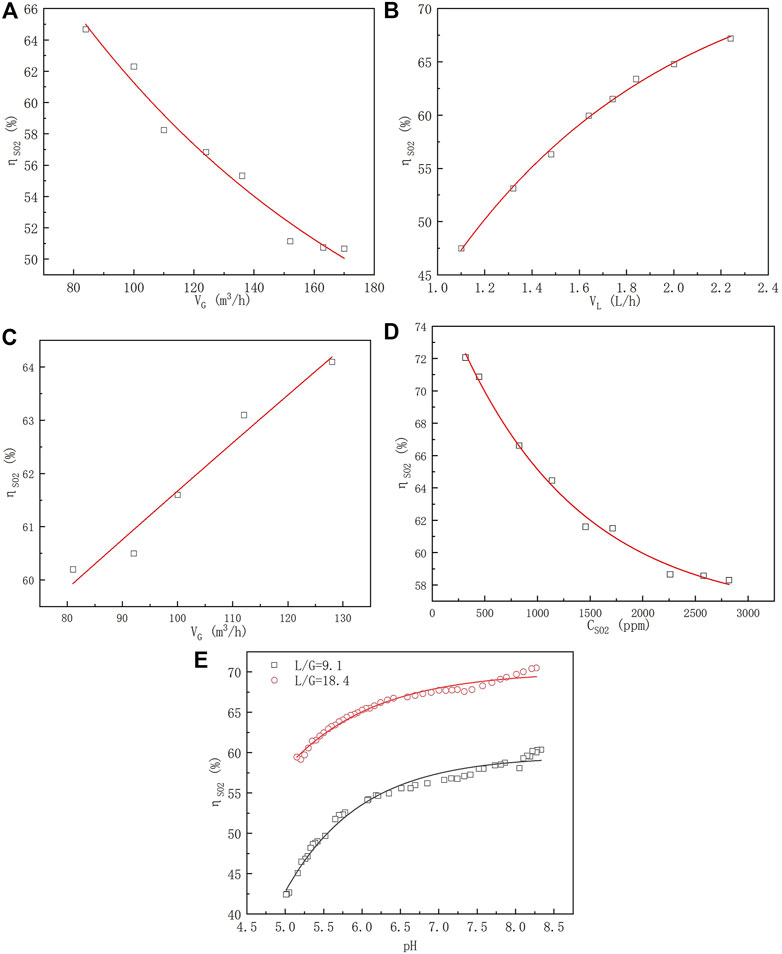
FIGURE 3. Relationship between the SO2 removal efficiency of the spray scrubber and (A) gas flow rate (VL = 1.62 m3/h, CSO2 = 900 ± 50 mg/m3, and pH = 6), (B) slurry flow rate (VG = 112 m3/h, CSO2 = 900 ± 50 mg/m3, and pH = 6), (C) gas flow rate operated under the same L/G (L/G = 16, CSO2 = 900 ± 50 mg/m3, and pH = 6), and (D) inlet SO2.
According to Figure 3A, the SO2 removal efficiency declined with the increasing gas flow rate because the residence time of the gas flow significantly decreased over the experimental VG range (Lin, 2006). As shown in Fig. Figure 3B, the SO2 removal efficiency improved with the raising slurry flow rate from 1.1 L/h to 2.3 L/h. This is likely because the number of droplets rises with the increasing slurry flow rate, and the gas-liquid contact areas become larger. Similar change trends of ηSO2 with VG and VL have also been demonstrated in other studies (Lin, 2006).
In this work, both VG and VL were simultaneously adjusted under the same L/G. The results depicted in Figure 3C showed that under the same L/G, ηSO2 improved from about 60% to 64% as the gas flow rate increased from 82 to 128 m3/h, which is in contrast to the results shown in Figure 3A (where VL was kept constant). Many studies on the SO2 removal efficiency have examined the impact of L/G by adjusting either the gas flow rate or liquid flow rate, without considering the simultaneous adjustment of both parameters. For example, Gerbec et al. (1995) fixed the liquid flow rate and varied the gas flow rate to adjust the L/G, while Zhao (2008) fixed the gas flow rate and the liquid flow rate to change the L/G. However, it is not appropriate to adjust the gas flow or liquid flow individually. In actual engineering operations, these two parameters must be adjusted at the same time to reach the emission standard. The different result is that increasing the liquid flow rate can augment the gas–liquid contact area, providing more reactants for the reaction. This finding is of great significance for the practical engineering operations ignored in previous studies (Gerbec et al., 1995).
The relationship between the inlet SO2 concentration and SO2 removal efficiency is shown in Figure 3D. The SO2 removal efficiency was sharply reduced from 72.1% to 58.3% when the CSO2 concentration was increased from 315 to 2818 ppm. This may be because the high SO2 concentration required high consumption of Ca2+ in the slurry, which caused additional absorption resistance (Lin, 2006).
Figure 3E illustrates the change in the SO2 removal efficiency with different pH values under L/G of 9.1 and 18.4. The ηSO2 values at L/G = 18.4 were higher than those at L/G = 9.1. However, the change in ηSO2 values with pH under different L/G was highly similar. When pH values changed from 5.0 to 6.0, the efficiency was rapidly promoted. Lower pH accelerating the dissolution of lime may be attributed to this result. After that, at pH values higher than 6.0, the efficiency increased more slowly because of the slow dissolution of lime at these pH values. Interestingly, when the pH values rose above 7.5, the efficiencies were further improved since the higher pH led to the increased amount of alkali in the slurry, which in turn provided more reactants for the reaction (Li, 2009). Although a high pH value can strengthen the SO2 absorption, it causes calcium sulfite to easily become crystallized on the absorbent surface, preventing it from further absorption and reaction, which also causes the lime dissolution rate to decrease (Zhu et al., 2015). As a result, pH values should be controlled between 5.0 and 6.0 in the industrial operation process.
In short, the gas flow rate, slurry flow rate, pH value, and SO2 concentration are the four parameters that are promising for SO2 removal efficiency. Although changing the aforementioned parameters can improve the removal efficiency of SO2, it is hard to adjust the SO2 concentration in real operation, for it is determined by the coal quality in the combustion. Owing to the reaction principle, the liquid flow rate is controlled by the slurry pump, and the pH value is also not easy to adjust. Furthermore, such methods as reducing the gas flow rate or increasing the slurry flow rate consume extra energy, which leads to a higher operating cost for the power plant. Therefore, in this study, the sieve-tray spray scrubber was employed to improve the SO2 removal efficiency without adding much energy consumption.
3.2 Total Sulfur Dioxide Removal Efficiency of the Sieve-Tray Spray Scrubber
In addition to the parameters discussed earlier (as in the spray scrubber without a sieve tray), one important factor that impacts the efficiency of the sieve-tray spray scrubber is the sieve tray. Also, the pore diameter and porosity are two key parameters of the sieve tray which affect the SO2 removal efficiency (Chuang, 1993; Xu et al., 1994). The effects of the aforementioned values on the total SO2 removal efficiency of the sieve-tray spray scrubber are shown in Figures 4–9(right Y-axis; blue).
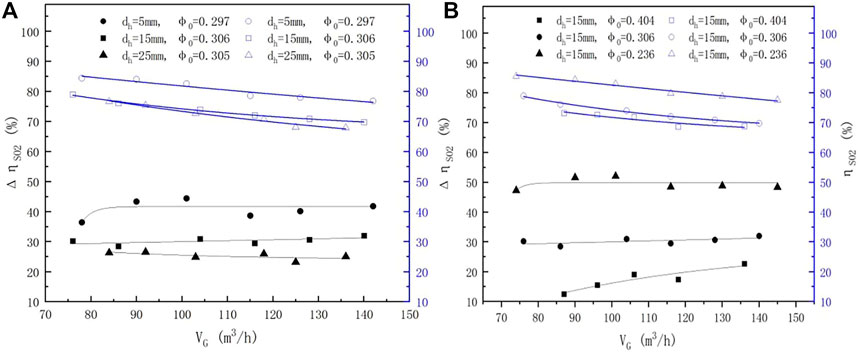
FIGURE 4.
3.2.1 Impact of Gas Flow Rates
Figure 4 depicts the total efficiency of the sieve-tray spray scrubber (
3.2.2 Impact of Slurry Flow Rates
Figure 5 shows the relationship between the liquid flow rate and
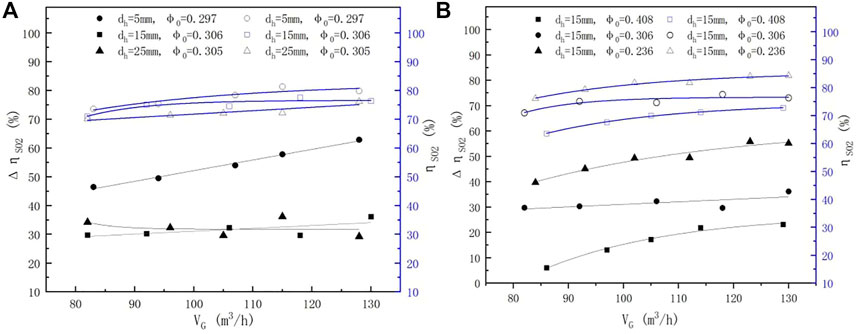
FIGURE 5.
3.2.3 Impact of Gas Flow Rates With the Same L/G
As described earlier, maintaining the L/G at a stable level while simultaneously adjusting VG and VL can impact the SO2 removal efficiency. Results under the same L/G but different pore diameters and porosity are illustrated in Figures 6A,B. It can be seen that the ηSO2 values increased when only VG was increased, which contradicts the results shown in Figure 3A, where the slurry flow rate remained constant. This is likely because the improvement of the slurry flow rate can increase the reactant supply. As shown in Figure 6B, the ηSO2 values increased about 4% and 10% when the porosity declined from 0.408 to 0.306 and 0.236, respectively. This reveals that lower porosity can strengthen the mass transfer of the sieve tray, which has been demonstrated by many studies (Chuang, 1993; Xu et al., 1994; Syeda, 2007; Li, 2009; Flávio et al., 2014).
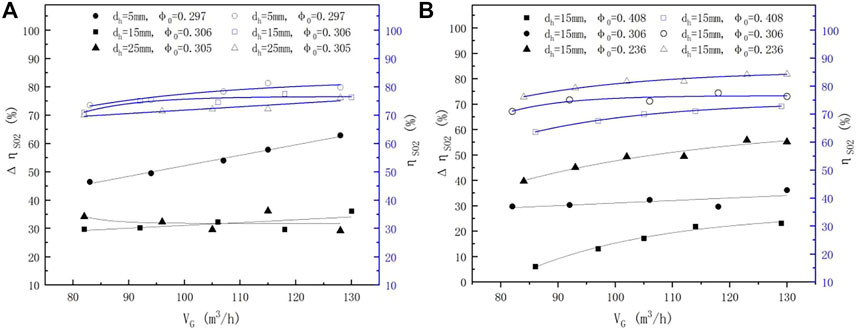
FIGURE 6.
3.2.4 Impact of the Sulfur Dioxide Concentration
The impact of the SO2 concentration on the SO2 removal efficiency at constant VL, VG, and pH but different pore diameters and porosity is shown in Figure 7. According to Figures 7A,B, the increase in CSO2 lowered ηSO2, which may be due to the fact that the SO2 concentration is proportional to the partial pressure of SO2 in the flue gas (Lin, 2006). Raising the SO2 concentration can elevate the SO2 absorption rate in the gas–liquid reaction. However, since the elevation in the absorption rate is less than that of the SO2 concentration, the total mass transfer of SO2 is reduced with the increase in the inlet SO2 concentration (Chen, 2008). Moreover, it can also be seen that the smaller pore diameter and porosity can enhance the SO2 removal efficiency, as described earlier.
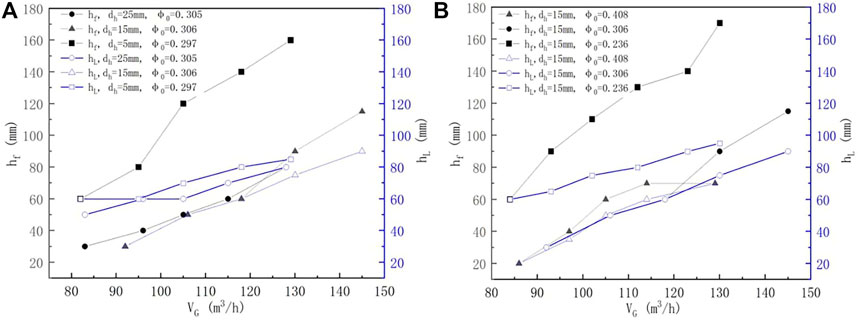
FIGURE 7. Variation of the foam height (hf) and clear liquid height (hL) with different gas flow rates (L/G = 16), (A) pore diameter, and (B) porosity.
3.2.5 Impact of pH Values
The correlation between pH values and SO2 removal efficiency at different pore diameters and porosity is shown in Figure 8. The ηSO2 values increased with increasing pH values and became stable at high pH values. In addition, the ηSO2 values at dh = 5 mm and 15 mm were slightly higher than those at dh = 25 mm, and the ηSO2 values also improved by nearly 5%, 15%, and 20% in relation to those of the spray scrubber without a sieve tray when φ0 was decreased from 0.408, 0.306, and 0.236, respectively. These results indicated that to improve the SO2 removal efficiency, it is better to adjust the porosity rather than the pore diameter at the experimental range.
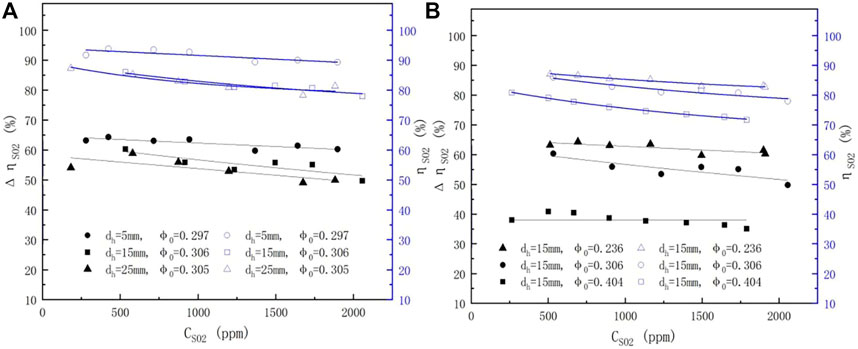
FIGURE 8.
3.3 Enhanced Efficiency the of Sieve Tray
Consequently, the sieve-tray spray scrubber had a higher SO2 removal efficiency than the traditional spray scrubber according to the aforementioned data. For further discussion, defining and calculating the “enhanced efficiency” to explore the effect of sieve trays in the sieve-tray spray scrubber is necessary.
3.3.1 Calculation of the Enhanced Efficiency of Sieve Trays
Unlike the traditional distillation tower or multistage dual-flow sieve plate column using sieve trays, the efficiency of the sieve-tray spray scrubber relies on two important parameters: the spray layer and the sieve tray (Flávio et al., 2014). In this study, the spray layer and the sieve tray were assumed to be connected in parallel (Wu et al., 2019a). In other words, the total efficiency of the sieve-tray spray scrubber is the combination of individual efficiencies of the spray layer and the foam layer. Consequently, the enhanced efficiency of the sieve tray (
Rearranging Equation 2, the equation for calculating the enhanced efficiency of the sieve tray in the sieve-tray spray scrubber can be obtained:
The results are most accurate when the experimental conditions for both the spray scrubber and the sieve-tray spray scrubber are kept consistent. However, such consistency is difficult to achieve (Chuanbo et al., 2019) because it is not easy to keep all the experimental conditions always the same, which could cause problems when calculating the exact
Before determining the enhanced efficiency of the sieve tray, the SO2 removal efficiency of the spray scrubber was calculated using the same experimental conditions used for the sieve-tray spray scrubber. Compared to the theoretical models (Li, 2009; Marocco, 2010), the enhanced efficiency of the sieve tray was calculated based on the aforementioned model to become much more precise. The method to resolve the problem of the enhanced efficiency of the sieve tray has seldom been reported (Chen, 2008; Aldo and Lau, 2014; Sadegh and Najafi, 2019).
3.3.2 Enhanced Efficiency of the Sieve Tray
The enhanced efficiency of the sieve tray (
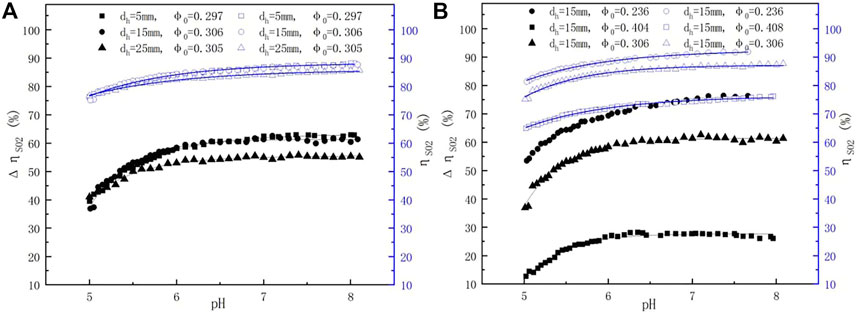
FIGURE 9.
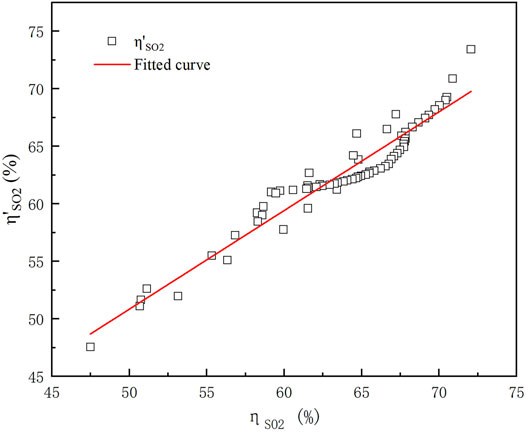
FIGURE 10. Fitting model of the spray scrubber.
3.3.2.1 Impact of Gas Flow Rates
Figure 4 shows the results of ΔηSO2 under different gas flow rates. ΔηSO2 increased with decreasing pore diameter, and the increment at smaller pore diameters was more obvious than that at larger pore diameters (Figure 4A). The average ΔηSO2 was promoted from 17.2% to 49.4% when the porosity decreased from 0.404 to 0.236 (Figure 4B), which is consistent with the observations of distillation towers reported by XU (Xu et al., 1994). Another discovery was that
3.3.2.2 Impact of Slurry Flow Rates
The influence of the slurry flow rate on the enhanced efficiency at different pore diameters is shown in Figure 5A. The enhanced efficiency increased with the decreasing pore diameter of the sieve tray at a constant φ0 of 0.3 ± 0.01, which is likely because smaller pore diameters can better disperse the gas flow into many small bubbles (Xu et al., 1994; Meng et al., 2019), and increase the contact area between the gas and liquid. The impact of porosity on the enhanced efficiency is shown in Figure 5B. Despite the fact that the sieve tray can improve the uniformity of the flow field in the scrubber (Wu et al., 2019a), the enhanced efficiency was not obvious at a large porosity of 0.404, for the foam layer was not properly formed. Nonetheless, the enhanced efficiency remained as high as 10–20% with nearly no froth height formatted, which may be due to the effect of the improvement of the flow field. Moreover, with decreasing porosity, the enhanced efficiency increased rapidly, likely due to the fact that the foam layer was improved. These results illustrated that the enhanced efficiency of the sieve tray is significant at smaller pore diameter and porosity, especially under a larger slurry flow rate.
3.3.2.3 Impact of Gas Flow Rates With the Same L/G
The enhanced efficiency of the sieve tray under the same L/G was calculated, and the results are shown in Figure 6. As illustrated in Figure 6A,
The foam porosity (which equals 1-hL/hf) (Xu et al., 1994) is often used to express the relationship between hL and hf. The results imply that both the foam height and the foam porosity (or the clear liquid height) contribute to the enhanced efficiency because the foam porosity is a physical property involving the mass transfer of a mixture of gas and liquid (Xu et al., 1994). The foam porosity increased rapidly at hf > 80 mm and dh = 5 mm, while it was nearly 0 at dh = 15 and 25 mm. This is the reason that the enhanced efficiency was not apparent at dh = 15 and 25 mm; the same observations can also be found in Figure 7B at φ0 = 0.306 and 0.408. Nonetheless, under the same L/G, the enhanced efficiency increased with the increasing gas flow rate, and the increment was more obvious than that of the spray scrubber without a sieve tray.
To summarize, the enhanced efficiency can be determined, owing to the following three aspects: 1) the sieve tray provided a dense region of the liquid phase, which in turn increased the probability of the contact between SO2 and the liquid phase in the flue gas; 2) with the decrease in the pore size and porosity, the gas holdup of the foam layer increased, forming a strong vibration of the foam layer. This in turn caused the transfer resistance to reduce and the desulfurization efficiency to increase (Ali and Rahimi, 2013); and 3) due to the effect of the sieve trays, the gas flow field and the liquid distribution field in the tower were improved, resulting in improved gas–liquid distribution and, ultimately, the improved SO2 removal efficiency (Wu et al., 2019a; Xin et al., 2020).
In addition, it was observed that the pressure drop of the scrubber increased with increasing foam height (hf) and clear liquid height (hL). In this study, the pressure drops observed in different experiments were about 50–500 Pa. Many studies have reported the model for calculating the pressure drop (Chuang, 1993; Xu et al., 1994). Accordingly, for industrial applications, it is better to evaluate the enhanced efficiency by considering the pressure drop.
3.3.2.4 Impact of the Sulfur Dioxide Concentration
Enhanced efficiency results under different SO2 concentrations, pore diameters, and porosities are shown in Figures 8A,B. The operating conditions, as well as the status of gas–liquid, were not changed.
3.3.2.5 Impact of pH Values
Changes in the enhanced efficiency at different pH values are shown in Figure 9. Similar results were obtained from the spray scrubber and the sieve-tray spray scrubber. As shown in Figure 9A, at a pH value of less than 6.0,
4 Conclusion
Due to the sieve tray’s simple structure and easy installation, using it to enhance the SO2 removal efficiency of the spray scrubber is a convenient and economical way to improve the pollutant removal capacity of the WFGD system. In this article, a new spray scrubber with sieve-tray spray was presented, which made a significant improvement in the total SO2 removal efficiency compared with the traditional spray scrubber. The total efficiency of the sieve-tray spray scrubber was assumed to be a sum of the individual efficiencies of the spray layer and the foam layer, which were connected in parallel. For further discussion, a fitting model built based on the experimental data for calculating the enhanced efficiency of the sieve-tray spray scrubber was proposed; the enhanced efficiency of the sieve tray in the sieve-tray spray scrubber was calculated and analyzed. The following conclusions were obtained:
1) The total SO2 removal efficiency improved with the increase in the liquid flow rate and gas flow rate under the same L/G, as well as the increase in the pH value, while it decreased with the increase in the gas flow rate and inlet SO2 concentration. The SO2 removal efficiency with different factors of the sieve-tray spray scrubber was similar to that of the spray scrubber without a sieve tray. The SO2 removal efficiency of different pore diameters and porosities got an absolute value about 1%–31% higher than without it, and with the increasing pore diameter and porosity, the SO2 removal efficiency decreased.
2) The enhanced efficiency increased with the increasing liquid flow rate, gas flow rate under the same L/G, and the pH value but decreased with the increasing inlet concentration. Meanwhile, under the same pore diameter or porosity, improving only the gas flow rates has little impact on the enhanced efficiency.
3) SO2 removal efficiency of the sieve-tray spray scrubber was considered to be affected by both the spray layer and the foam layer. Compared to the spray scrubber without a sieve tray, the enhanced efficiency of the sieve-tray spray scrubber was mostly between 20% and 60% in the experimental range. The higher efficiency of the sieve tray was found to be related not only to the foam height but also to the clear liquid foam height, which suggests that both the foam height and the gas holdup of the foam should be increased in order to increase the enhanced efficiency.
Data Availability Statement
The original contributions presented in the study are included in the article/supplementary material; further inquiries can be directed to the corresponding author.
Author Contributions
WQ designed the study and revised it. WQ and Min Gu supervised and directed the project. WQ, WM, and Juan Wen performed the experiments. WQ and WM wrote the manuscript. CJ, WM, and LC revised the manuscript. WM revised the figure and gave support for the manuscript writing. All authors commented on the manuscript and gave final approval for publication.
Funding
This work was supported by the Chongqing Outstanding Young Talents Project (No. CQYC2021059461).
Conflict of Interest
Author WQ is employed by State Power Investment Corporation Yuanda Environmental Protection Engineering Co., Ltd.
The remaining authors declare that the research was conducted in the absence of any commercial or financial relationships that could be construed as a potential conflict of interest.
Publisher’s Note
All claims expressed in this article are solely those of the authors and do not necessarily represent those of their affiliated organizations, or those of the publisher, the editors, and the reviewers. Any product that may be evaluated in this article, or claim that may be made by its manufacturer, is not guaranteed or endorsed by the publisher.
References
Aldo, M., and Lau, P. L. (2014). CFD Study of Distillation Sieve Tray Flow Regimes Using the Droplet Size Distribution Technique. J. Taiwan Inst. Chem. Eng. 45 (4), 1354–1368. doi:10.1016/j.jtice.2014.01.002
Ali, Z., and Rahimi, R. (2013). CFD and Experimental Studies of Liquid Weeping in the Circular Sieve Tray Columns. Chem. Eng. Res. Des. 91 (12), 2333–2345. doi:10.1016/j.cherd.2013.03.006
Braghiroli, F. L., Bouafif, H., and Koubaa, A. (2019). Enhanced SO2 Adsorption and Desorption on Chemically and Physically Activated Biochar Made from Wood Residues. Industrial Crops Prod. 138, 111456. doi:10.1016/j.indcrop.2019.06.019
Chen, X W. (2008). Experimental Study on Desulfurization and Denitrification Performance of Sieve-Plate Spray Tower. China: Zhejinag University.
Chen, T.-L., Chen, Y.-H., and Chiang, P.-C. (2020). Enhanced Performance on Simultaneous Removal of NOx-SO2-CO2 Using a High-Gravity Rotating Packed Bed and Alkaline Wastes towards Green Process Intensification. Chem. Eng. J. 393, 124678. doi:10.1016/j.cej.2020.124678
Chuanbo, M., Tang, X., Zhao, S., Song, L., and Zhang, Y. (2019). Improving Simultaneous Removal Efficiency of SO2 and NOx from Flue Gas by Surface Modification of MgO with Organic Component. J. Clean. Prod. 230, 508–517. doi:10.1016/j.jclepro.2019.05.109
Chuang, G. (1993). Prediction of Point Efficiency for Sieve Trays in Distillation. Industrial Eng. Chem. Res. 32 (4), 701–708. doi:10.1021/ie00016a017
Dai, P. (2017). Synergistic Effect of Droplet Self-Adjustment and Rod Bank Internal on Fluid Distribution in a WFGD Spray Column. Chem. Eng. Sci. 162, 227–244. doi:10.1016/j.ces.2016.12.062
Flávio, D., Mayer, L., Marcilio, N. R., Baldo, V., and Hoffmann, R. (2014). Review of Hydraulics Correlations for Sieve Trays without Downcomers. Industrial Eng. Chem. Res. 53, 8323–8331. doi:10.1021/ie5010543
Gao, Y., and He, J. (2018). Intensifying Effects of Zinc Oxide Wet Flue Gas Desulfurization Process with Citric Acid. J. Environ. Chem. Eng., 102831. doi:10.1016/j.jece.2018.102831
Gerbec, M., Stergaršek, A., and Kocjančič, R. (1995). Simulation Model of Wet Flue Gas Desulphurization Plant. Comput. Chem. Eng. 19, 283–286. doi:10.1016/0098-1354(95)87050-4
Gondosurohardjo, S., Taufany, A. F., and Nurkhamidah, S. (2019). Comparison of Performance Characteristic Prediction of Sieve Tray with and without Down Comer. IOP Conf. Ser. Mater. Sci. Eng. 543, 012083. doi:10.1088/1757-899x/543/1/012083
Im, H., Lee, S., and Lee, J. W. (2018). Enhanced Mass Transfer from the Installation of a Sieve Tray Subject to the Variation of Liquid Heights and Flow Regimes in a Bubble Column. Chem. Eng. Res. Des. 136, 654–662. doi:10.1016/j.cherd.2018.05.045
Junhua, Y. (2019). Study on Synergetic Dedusting of Desulphurization Absorption Tower in Coal-Fired Power Plants. Therm. Power Gener.. doi:10.19666/j.rlfd.201905096
Kermani, M. (2018). Clean Power Production by Simultaneous Reduction of NOx and SOx Contaminants Using Mazut Nano-Emulsion and Wet Flue Gas Desulfurization. J. Clean. Prod. 201, 229–235. doi:10.1016/j.jclepro.2018.08.017
Li, B. (2009). Prediction of SO2 Removal Efficiency for Wet Flue Gas Desulfurization. Energy Convers. Manag. 50 (10), 2547–2553. doi:10.1016/j.enconman.2009.06.012
Lin, Y. (2006). China. Study on Large Scale Limestone-gypsum Spraying Desulphurization Technology and Project Application. China: Zhejiang University.
Liu, X., Lin, B., and Zhang, Y. (2016a). Sulfur Dioxide Emission Reduction of Power Plants in China: Current Policies and Implications. J. Clean. Prod. 113, 133–143. doi:10.1016/j.jclepro.2015.12.046
Liu, X., Xu, Y., Zeng, X., Zhang, Y., Xu, M., Pan, S., et al. (2016b). Field Measurements on the Emission and Removal of PM2.5 from Coal-Fired Power Stations: 1. Case Study for a 1000 MW Ultrasupercritical Utility Boiler. Energy fuels. 30, 6547–6554. doi:10.1021/acs.energyfuels.6b00423
Ludwig, E. E. (1997). Applied Process Design for Chemical and Petrochemical Plants, 2. Houston, TX: Gulf professional publishing.
Marocco, L. (2010). Modeling of the Fluid Dynamics and SO2 Absorption in a Gas–Liquid Reactor. Chem. Eng. J. 162 (1), 217–226. doi:10.1016/j.cej.2010.05.033
Meng, T., Wang, D., Liu, Y., zhang, Y., Wang, L., and Liu, C. (2019). CFD Simulation of Gas Flow Field Distribution and Design Optimization of the Tridimensional Rotational Flow Sieve Tray with Different Structural Parameters. Chem. Eng. Sci. 201, 34–49. doi:10.1016/j.ces.2019.01.049
Moullec, T. (2011). Wet Industrial Flue Gas Desulfurization Unit: Model Development and Validation on Industrial Data. Industrial Eng. Chem. Res. 50, 7579–7592. doi:10.1021/ie102239q
Pedrolo, D. R. S., de Menezes Quines, L. K., de Souza, G., Marcilio, N. R., Marcilio, , and Romeu, N. (2017). Synthesis of Zeolites from Brazilian Coal Ash and its Application in SO2 Adsorption. J. Environ. Chem. Eng. 5, 4788–4794. doi:10.1016/j.jece.2017.09.015
Rahbar, R. (2012). Elahe Bahramifar the Effect of Tray Geometry on the Sieve Tray Efficiency. Chem. Eng. Sci. 76, 90–98. doi:10.1016/j.ces.2012.01.006
Sadegh, A., and Najafi, M. (2019). Comparison of the Mass Transfer and Efficiency of Nye Tray and Sieve Tray by Computational Fluid Dynamics. Sep. Purif. Technol. 215, 276–286. doi:10.1016/j.seppur.2019.01.010
Schick, K. (2014). Optimization of SO2 Scrubber Using CFD Modeling. Procedia Engineering. Procedia Eng. 83, 170–180.
Syeda, S. R. (2007). A Fundamental Model for Prediction of Sieve Tray Efficiency. Chem. Eng. Res. Des. 85 (2), 269–277. doi:10.1205/cherd06111
Tong, S., Yan, X., Zhang, Y., Ren, Y., Hu, J., and Edward, J. (2019). Anthony Simultaneous Removal of SO2 and NOx by a New Combined Spray-And-Scattered-Bubble Technology Based on Preozonation: From Lab Scale to Pilot Scale. Appl. Energy 242, 1528–1538. doi:10.1016/j.apenergy.2019.03.186
Wu, Q., Du, M. Y., and Zeng, H. (2019a). Synergistic Removal of Dust Using the Wet Flue Gas Desulfurization Systems. R. Soc. open Sci. 6 (7), 181696. doi:10.1098/rsos.181696
Wu, Q., Gu, M., Du, Y., and Zeng, H. (2019b). Chemical Composition and Morphology of Particles Emitted from a Wet Flue Gas Desulfurization (WFGD) System. Process Saf. Environ. Prot. 124, 196–203. doi:10.1016/j.psep.2019.02.013
Xin, W., Zhang, W., and Zhao, J. (2020). Zeyan Wang Simultaneous SO2 and NO Removal by Pellets Made of Carbide Slag and Coal Char in a Bubbling Fluidized-Bed Reactor. Process Saf. Environ. Prot. 134, 83–94. doi:10.1016/j.psep.2019.11.022
Xu, Z. P., Afacan, A., and Chuang, K. T. (1994). Efficiency of Dualflow Trays in Distillation. Can. J. Chem. Eng. 72 (4), 607–613. doi:10.1002/cjce.5450720409
Yi, H., Yang, K., Tang, X., Liu, X., Zhao, S., Gao, F., et al. (2018). Effects of Preparation Conditions on the Performance of Simultaneous Desulfurization and Denitrification over SiO2 -MnO X Composites. J. Clean. Prod. 189, 627–634. doi:10.1016/j.jclepro.2018.04.044
Zhao, G. (2008). Theoretical Study for Sulfur Dioxide Absorption on Limestone Wet Flue Gas Desulfurization. China: Northeastern university.
Zhao, Z. H., and Liang, C. Z. (2014). A Study on Improving the Efficiency of Wet Flue Gas Desulphurization and Dust Removal. Beijing: Journal of Beijing Institute of Petro-Chemical Technology.
Keywords: wet flue gas desulfurization, spray scrubber, SO2 removal, sieve tray, enhanced efficiency
Citation: Qirong W, Mengli W, Yungui D, Cunfang L and Jianhong C (2022) Enhanced Efficiency of the Sieve Tray in a Desulfurization Spray Scrubber. Front. Energy Res. 10:918233. doi: 10.3389/fenrg.2022.918233
Received: 12 April 2022; Accepted: 10 May 2022;
Published: 27 June 2022.
Edited by:
Xin Tu, University of Liverpool, United KingdomReviewed by:
Rui-tang Guo, Shanghai University of Electric Power, ChinaHonglei Ding, Shanghai University of Electric Power, China
Copyright © 2022 Qirong, Mengli, Yungui, Cunfang and Jianhong. This is an open-access article distributed under the terms of the Creative Commons Attribution License (CC BY). The use, distribution or reproduction in other forums is permitted, provided the original author(s) and the copyright owner(s) are credited and that the original publication in this journal is cited, in accordance with accepted academic practice. No use, distribution or reproduction is permitted which does not comply with these terms.
*Correspondence: Wu Qirong, NTEwNzI1NjMzQHFxLmNvbQ==