 Yanhua Wang
 Jun Dai
 Shaowei Zhou2
 Meng Wang
- 1College of Power and Energy Engineering, Harbin Engineering University, Harbin, China
- 2China Ship Research and Design Center, Wuhan, China
Fouling, corrosion, and icing are common causes of increased compressor blade roughness due to special operating conditions and natural environment. Roughness increase would influence on flow field, especially in supersonic compressor cascades where incident waves can interact with reflected shock waves. Studies have shown that the boundary layer condition of the blade varies with wall roughness, which affects both the incident shock wave and the reflected shock wave. In order to study the effect of the distribution of roughness, the flow field under different roughness settings is simulated. The results show that flow loss is reduced with increasing roughness at the incidence point of an incident wave and the trailing edge of the suction side.
Introduction
With the development of high-speed compressors, the phenomenon of the supersonic flow field inside the cascade is very common. In the cascade, the shock wave interacts with the supersonic flow field. When the shock wave interacts with the laminar boundary layer, even a very weak shock wave can cause the laminar boundary layer to separate, leading to a decrease in performance. The interaction between shock waves and the laminar boundary layer is unsteady in some cases, which leads to blade vibration and shock wave oscillation in cascade flow. The shock wave oscillation causes pressure fluctuations and blade load changes.
Fouling, erosion, corrosion, and fatigue oxidation on the blade surface are inevitable phenomena in the working process of the compressor. These cause changes in the surface roughness of the compressor blade (Aldi et al., 2014). However, surface roughness affects the resistance and flow condition of the blade surface (Boyle et al., 2001; Boyle and Stripf, 2008; Seung et al., 2010; Back et al., 2012), making the interaction between the shock wave and boundary layer more complex, which affects the separation of the boundary layer (Graham and Kost, 1979; Hou et al., 2011), the distribution of Mach number, and the wake inevitably (Irimpan and Menezes, 2018). Then, the resistance and loss of the blade surface change, which changes blade performance. Surface roughness also can control the boundary layer flow. Compared with other boundary layer flow control methods such as suction and jet flow, surface roughness can change blade surface separation and the transition process without increasing structural complexity, thus affecting compressor profile loss and integral stage performance. Therefore, it is very important to study the effect of surface roughness on the flow field in the compressor cascade. Schilichting used Nikuradse data to correlate different roughness types and put forward the concept of equivalent gravel roughness in practice (Li et al., 2016). Syverud et al. show that the increase in roughness has the most obvious effect on the discharge coefficient (Melino et al., 2011).
Yunfei Zhao et al. have studied the influence of different shapes of models and different roughness on the downstream flow field. The results show that roughness causes the formation of flow streaks and shear layers in the wake, thereby increasing the non-uniformity of the downstream flow field stability (Syverud and Bakken, 2006; Rainer et al., 2009). The results of the study by Fouflias and Kurz, et al. (Tweedt et al., 1988; Yao and Carson, 2006; Zhao et al., 2016) show that the increase in suction surface roughness has a more obvious effect on cascade performance. Aldi studied the performance curve changes of NASA stage 37 under six kinds of roughness with non-uniform linear distribution of the blade span direction, and the results show that the increase in blade tip roughness caused more serious performance degradation (Yi et al., 2016). The results of Zhao's study (Zhou et al. (2016) show that the strength of the expansion wave at the suction surface near the throat increases and the intersection point of the shock waves and the reflected shock wave at the suction side of the trailing edge moves downstream, thus reducing the interference loss of shock waves.
Through the analysis of surface roughness, this study discusses the relationship between surface roughness and compressor cascade loss and provides a theoretical basis for a subsequent compressor design.
Model and Research Object
Model
In this study, the supersonic cascade ARL-SL19 is taken as the research object. According to reference (Tweedt et al. 1988), the blade profile coordinates with chord length as dimensionless and relevant main parameters are obtained. The specific parameters are shown in Table 1 and Figure 1(Tweedt et al. 1988).
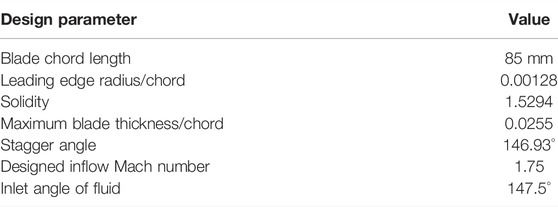
TABLE 1. Main parameters of the compressor cascade.
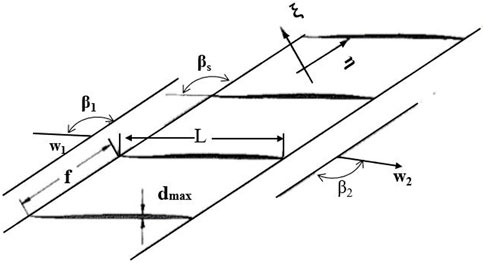
FIGURE 1. Cascade geometric parameters.
Grid of Model
To make sure y+ < 1 near the wall, the distance between the first layer of the wall grid and the wall is 0.001 mm. The grid is densified near the trailing edge and the leading edge of the cascade. The cascade grid is shown in Figure 2.

FIGURE 2. Grid of the cascade.
Numerical Calculation Method and Verification
Grid and Turbulence Independence
The simulation method used in this article is a steady method. The viscosity setting is given by Sutherland’s law, and the wall boundary condition is based on no-slip wall. The inlet Mach number is 1.586, the outlet static pressure ratio (P2/P1) is 2.3, the inlet static pressure is 101,325 Pa, and the inlet airflow angle is 57.5°. The model with grid numbers
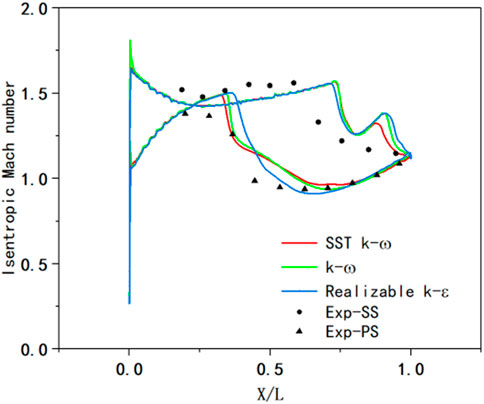
FIGURE 3. Effect of different turbulence models on isentropic Mach number on the blade surface.
Setting of Surface Roughness
In order to introduce surface roughness, the equivalent gravel roughness ks of a rough wall is studied in this article. The relationship between
Calculation and Analysis
Calculation Results of Smooth Surface
In the case of the smooth wall, the cascade is simulated and the flow field is analyzed. The distribution of the flow field in the cascade is shown in Figure 4. It can be seen that at the position of about 0.7 times the chord length (0.7L) of the suction surface, the shock wave is incident on the suction surface and the reflected wave is generated and interacts with the boundary layer. The Mach rod structure and local bubble separation can be seen from the Mach number contours. The interaction between shock waves and the boundary layer will lead to boundary layer separation, generation of separation bubble, and increase in flow loss. The interaction between the shock wave and the boundary layer, the size of the separation bubble and the size of the separation area at the end of the blade are related to the flow state of boundary layers and the strength of shock waves.
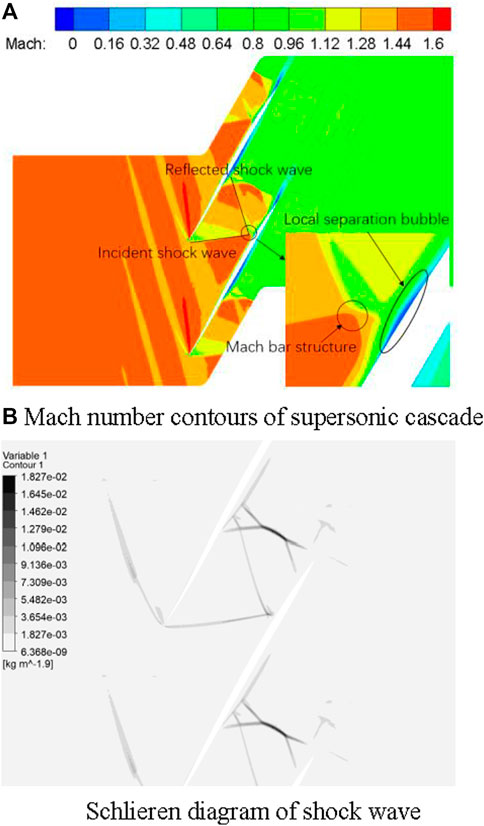
FIGURE 4. Flow field contours of the cascade. (A) Mach number contours of the supersonic cascade. (B) Schlieren diagram of the shock wave.
The shock function can better represent the interaction between the shock structure and wave system in the cascade. Its expression is as follows:
In Equation 2, V is the velocity vector,
Figure 5 shows the distribution of shock wave function. In Figure 4, Mach number distribution and the Schlieren diagram of the cascade are in good agreement with shock function distribution. It can be seen that the working fluid produces a shock wave at the inlet of the cascade. The shock waves act on 0.7L of the suction surface and then generate a reflected shock wave and a λ-type normal shock wave at the trailing edge of the suction surface. Figure 6 shows streamline distribution in the cascade. Compared with Figure 5, it can be seen that the action of the incident shock wave induces boundary layer separation at the suction surface 0.7L; the interaction between the shock wave and boundary layer at the trailing edge of the suction surface and pressure surface under the action of a λ - type normal shock wave induces backflow of the working fluid, resulting in airflow blockage in the cascade. This weakens the interaction of shock waves.

FIGURE 5. Shock function contours of the cascade.
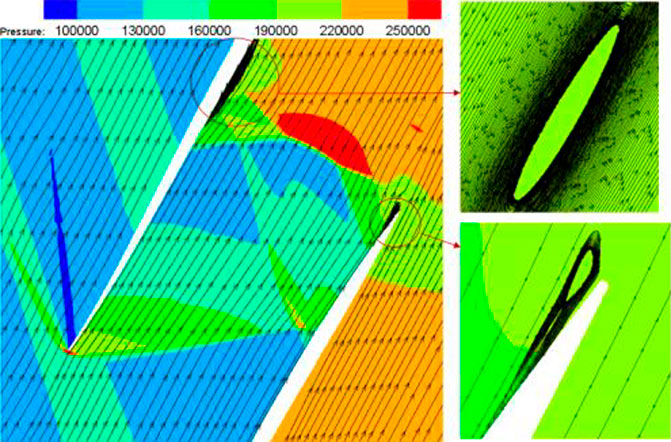
FIGURE 6. Pressure contours of the cascade.
Position of Roughness Distribution
In Figures 4, 5, it can be seen that the incident shock wave and the reflected shock wave act on the suction surface at 0.7L. In order to explore the influence of different surface roughness distribution positions on the cascade channel, rough surfaces were set at the leading edge, shock wave reflection position, and trailing edge of the cascade. The surface roughness is arranged at 0.2, 0.6, 0.7, 0.8, and 0.9L of the suction surface, as shown in Figure 7. The
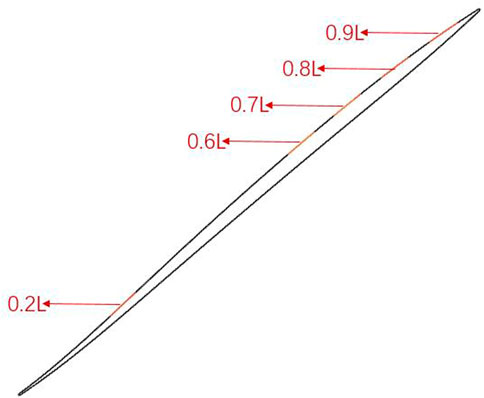
FIGURE 7. Distribution of surface roughness of the cascade.
In Equation 3,
The total pressure loss of the cascade under different working conditions is shown in Figure 8. The results show that the total pressure loss in cascades increases when uses of artificial roughness are at 0.2 L. The total pressure loss is caused by the friction between the gas and blade surface. As for 0.6L, the total pressure loss becomes high with increased surface roughness. When ks is 150 μm, the total pressure has most to lose. The total pressure loss in cascades decreases when uses of artificial roughness are at 0.7, 0.8, and 0.9 L. Adding roughness to the rear of a reflected shock wave can effectively restrain the formation of the separation bubble and reduce total pressure loss. Compared with the smooth cascade, the maximum changes in total pressure loss are 9.91 and -12.8% when the roughness distribution is 0.6 and 0.7L, respectively.
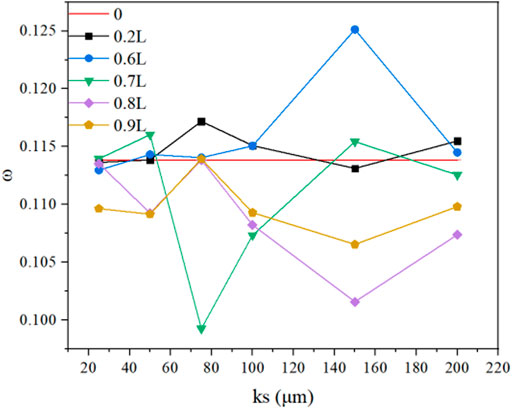
FIGURE 8. Variation of total pressure loss.
The Influence of Surface Roughness on the Flow Field
Combined with Figure 8, the flow fields of the smooth surface, 0.6L–150, 0.7L–75, 0.8L–150, and 0.9L–150 are compared and analyzed. The influence of the surface roughness of the cascade on the flow field is discussed.
Figure 9 shows the distribution of shock wave function in the cascade. The interaction points of the shock wave and boundary layer are distributed at 0.7L under five conditions. Compared with the smooth surface, the intensities of an incident shock wave and reflected shock wave under 0.6L–150 working condition are increased and the intensity of the λ-type normal shock wave near the pressure surface at the trailing edge of the cascade is enhanced. At the same time, the strength of the shock wave behind the trailing edge is enhanced, and the strength of the shock train is enhanced. Under the working conditions of 0.7L–50, 0.8L–150, and 0.9L–150, the intensities of the incident shock wave and reflected shock wave is weakened. The intensity of the λ-type normal shock wave, which is near the suction surface at the trailing edge of the cascade, is obviously weakened. At the same time, the strength of the shock wave and shock train behind the trailing edge is weakened, which is most obvious under the working condition of 0.9L–150.
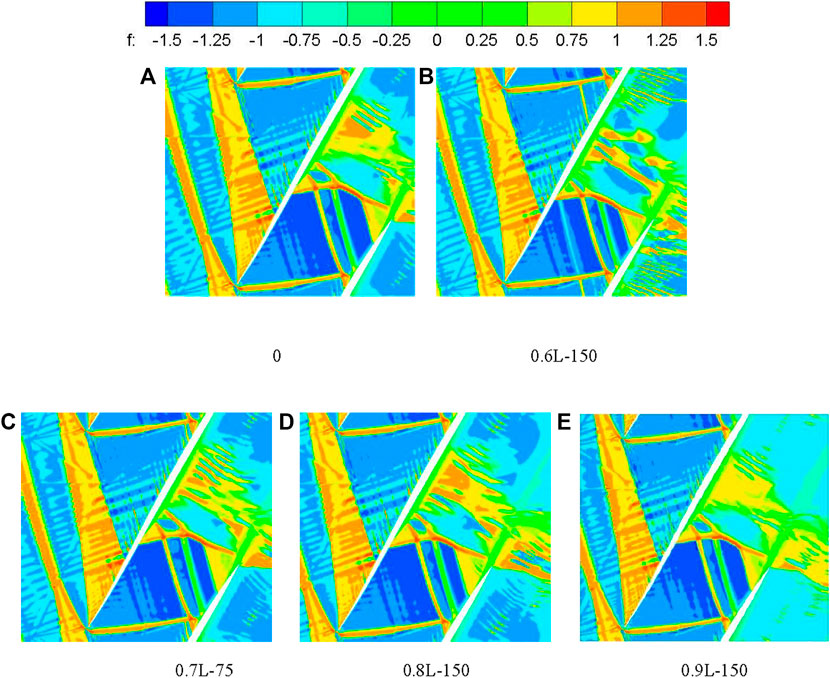
FIGURE 9. Shock function contours of the supersonic cascade and Partially enlarged.
Figures 10, 11 show the Mach number and pressure distribution in the cascade. Compared with Figures 10, 11, the shock-induced bubble separation appears at the interaction position between the suction surface shock wave and the boundary layer and at the interaction between the reflected shock wave and the boundary layer on the pressure surface. At the trailing edge of the suction surface and the incident point of the reflected shock wave on the pressure surface, the backflow is induced and the flow in the cascade is blocked. Compared with the smooth surface, the separation bubble size increases and the working fluid reflux area increases under the working condition of 0.6L–150; the separation bubble size decreases, and the working fluid reflux area decreases under 0.7L–75, 0.8L–150, and 0.9L–150 working conditions. The fluid reflux area on the suction side under the 0.9L–150 working condition is the smallest, but compared with 0.7L–75 and 0.8L–150 working conditions, it has a larger fluid reflux area on the pressure side.
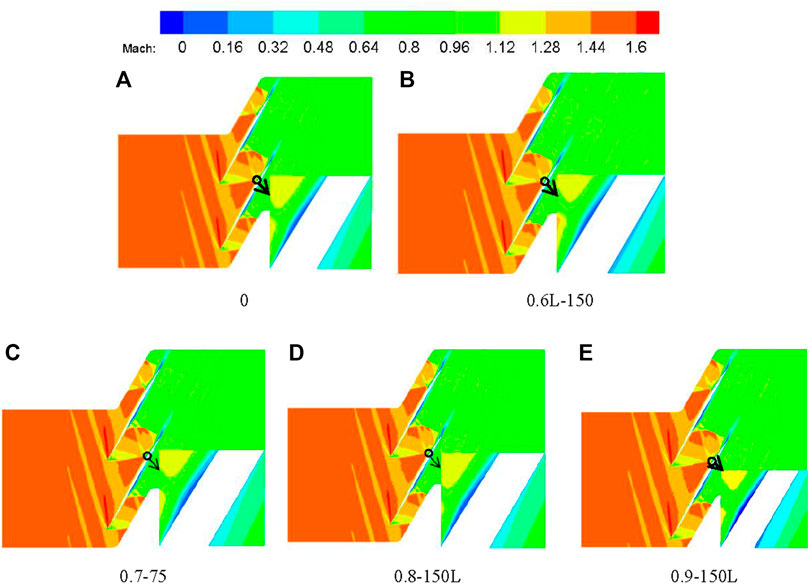
FIGURE 10. Mach number contours of the supersonic cascade and Partially enlarged.
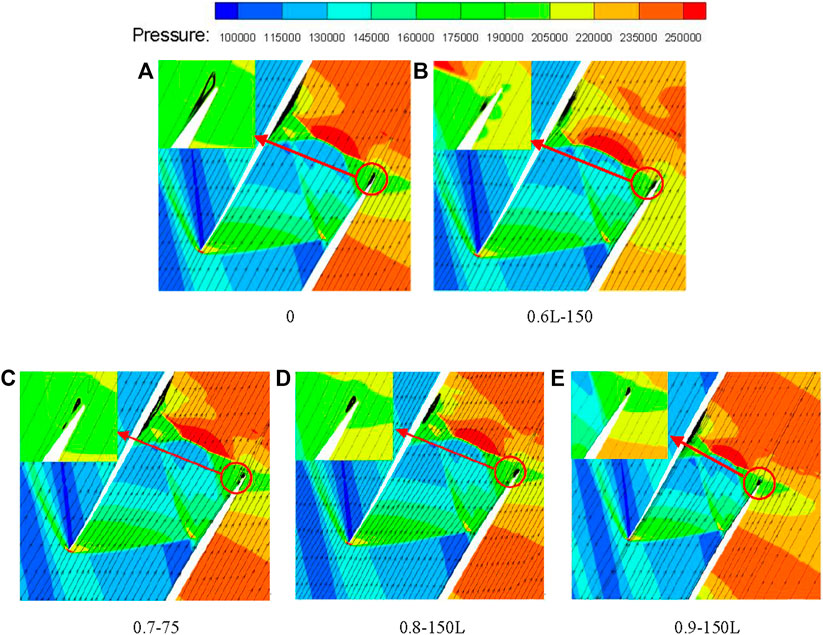
FIGURE 11. Pressure contours of the supersonic cascade and Partially enlarged.
Figure 12 shows the pressure coefficient distribution curve on the suction surface of the cascade. The pressure coefficient is defined as follows:
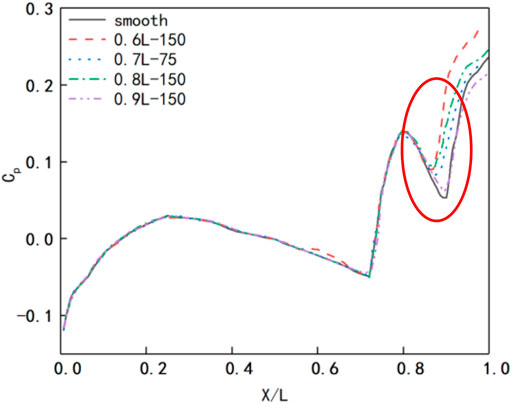
FIGURE 12. Variation of static pressure loss with roughness height.
In Equation 4, Pi is the static pressure value of the suction surface of the cascade.
The overall variation trend of the suction surface pressure coefficient is the same under different working conditions. However, with the increase of roughness, the pressure coefficient from the leading edge of suction to 0.7L is higher than that from 0.7L to the trailing edge, which is higher than that of the smooth surface. Compared with the smooth surface, the pressure coefficient at the trailing edge increases under 0.6L–150 working condition and decreases under 0.7L–75 and 0.8L–150 working conditions; 0.9–150 working condition is basically the same as 0.6–150 working condition. The results show that there is a reverse pressure gradient at 0.6L on the suction surface under 0.6L–150 working condition,, and the reverse pressure gradient at the trailing edge increases at the same time. The flow state of the working fluid becomes worse, and the backflow area at the trailing edge increases, which increases the total pressure loss. The pressure gradient at the trailing edge decreases under 0.7L–75, 0.8L–150, and 0.9–150 working conditions, which makes the total pressure loss smaller, and the total pressure loss reaches the minimum under 0.7L–75 working condition.
Figure 13 shows the turbulence intensity distribution on the suction surface. It can be seen that setting roughness on the suction surface can effectively improve the turbulence intensity at the location where roughness is set. In 0.6L–150, 0.8L–150, and 0.9L–150 working conditions and the starting and disappearing positions of the separation bubble are the same as those of the smooth condition. But, under 0.7L–75 working condition, the starting position of the separation bubble moved 1.7% of chord length downstream, which can also be clearly seen in Figures 14, 15. Figure 14 shows that the skin friction coefficient at the position where roughness setting is greater at the smooth surface under 0.6L–150, 0.7L–75, and 0.8L–150 working conditions because roughness setting on the suction surface can exert stronger disturbance to the separation shear layer. Figure 14 also shows that the skin friction coefficient at 0.7L of 0.7L–75 working condition is the largest.
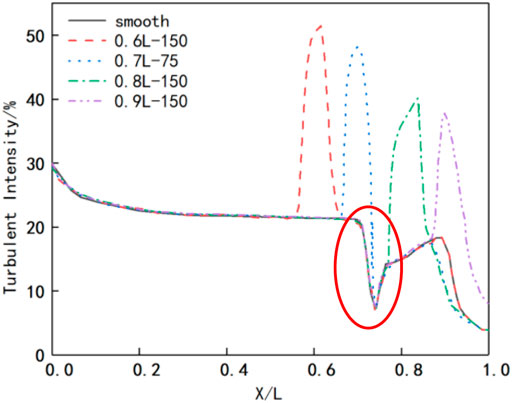
FIGURE 13. Variation of turbulent intensity on the suction side with roughness height.
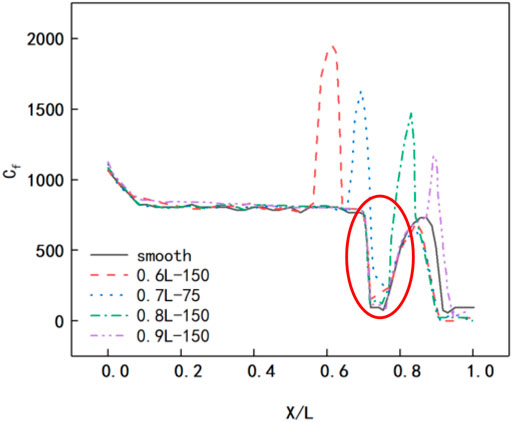
FIGURE 14. Variation of the skin friction coefficient on the suction side with roughness height.
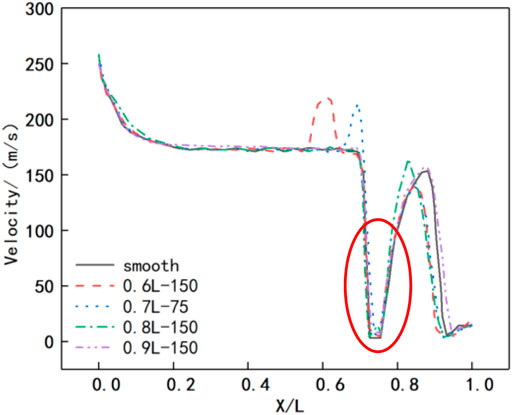
FIGURE 15. Variation of velocity on the suction side with roughness height.
Figure 15 is the velocity distribution curve. There is little difference in the velocity at the separation bubble position in the five working conditions, but it can also be seen that the velocity at the separation bubble position under 0.7L–75 working condition is slightly higher than that in the other five working conditions. The aforementioned phenomenon indicates that the roughness setting under 0.7L–75 working condition can delay the separation in laminar flow and exert stronger disturbance on the separation shear layer, which inhibits the development of separation bubbles.
The Figure 16 is Figure 12 to Figure 12 Partial enlargement of the curve
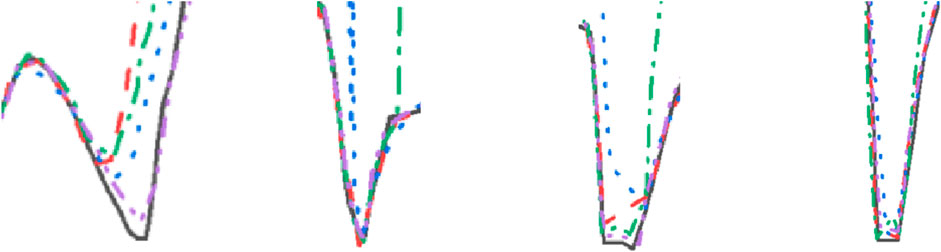
FIGURE 16. Partial enlargement of the curve.
Conclusion
In this study, the supersonic cascade ARL-SL19 is taken as the research object. In order to explore the influence of surface roughness on the flow field inside the cascade, different roughness is set at the incident point of a shock wave of the suction surface, in front of and behind the incident point, and at the leading edge and trailing edge of the suction surface. The numerical simulation result of different roughness conditions are compared with the results of the original model. The conclusions are as follows:
1) When the suction surface is smooth, an incident shock wave is generated at the leading edge of the cascade. At the 0.7L of the suction surface, Mach rod structures and separation bubbles are formed because of the interaction between the boundary layer and the incident shock wave. The combined actions of the reflected shock wave and λ-type normal shock wave at the trailing edge of the suction surface disturbs the internal flow field of the cascade, resulting in backflow between 0.5 L of the pressure surface and the trailing edge of the suction surface, which increases total pressure loss of the cascade.
2) There is no significant effect on the performance of the cascade with artificial roughness at 0.2 L. The total pressure loss changes in 1% when the roughness is set at 0.2 L. The position of shock waves is far away from the leading edge, and the working fluid at the leading edge of the cascade suction side is diffused flow. Increasing the roughness at the leading edge does not change the shock state.
3) Increasing the roughness before the shock incidence point will increase the total pressure loss. Under the condition of 0.6L–150, the strength of the shock wave at the suction surface and the trailing edge is enhanced. The 0.6L of the suction surface and reverse pressure gradient at the trailing edge increases, which is not conducive to the flow of working fluid. At the same time, the wake loss increases. The total pressure loss of the cascade is increased by 9.91%.
4) The total pressure loss can be reduced by increasing the roughness at the shock incident point and the trailing edge of the suction surface. After the roughness is set, the shock intensity and the reverse pressure gradient are weakened, and the backflow condition is improved; at the same time, the separation bubble induced at the shock incident point is reduced. Under the 0.7L–75 condition, the total pressure loss of the cascade is reduced by 12.8%.
5) The roughness setting at 0.7L–75 working condition can delay the separation in laminar flow and exert stronger disturbance on the separation shear layer, which inhibits the development of separation bubbles.
Data Availability Statement
The original contributions presented in the study are included in the article/Supplementary Material; further inquiries can be directed to the corresponding author.
Author Contributions
YW is responsible for numerical simulation calculation. JD is responsible for data collation. SZ is responsible for data collection and summary. MW is responsible for data analysis. ZW is responsible for overall thinking.
Funding
This work was supported by the National Science and Technology Major Project (J2019- Ⅲ-0017).
Conflict of Interest
The authors declare that the research was conducted in the absence of any commercial or financial relationships that could be construed as a potential conflict of interest.
Publisher’s Note
All claims expressed in this article are solely those of the authors and do not necessarily represent those of their affiliated organizations, or those of the publisher, the editors, and the reviewers. Any product that may be evaluated in this article, or claim that may be made by its manufacturer, is not guaranteed or endorsed by the publisher.
References
Aldi, N., Morini, M., Pinelli, M., Spina, P. R., Suman, A., and Venturini, M. (2014). Performance Evaluation of Nonuniformly Fouled Axial Compressor Stages by Means of Computational Fluid Dynamics Analyses. J. Turbomach. 136 (2), 021016. doi:10.1115/1.4025227
Back, S. C., Hobson, G. V., Song, S. J., and Millsaps, K. T. (2012). Effects of Reynolds Number and Surface Roughness Magnitude and Location on Compressor Cascade Performance. J. Turbomach. 134 (5), 051013–051016. doi:10.1115/1.4003821
Boyle, R. J., Spuckler, C. M., Lucci, B. L., and Camperchioli, W. P. (2001). Infrared Low-Temperature Turbine Vane Rough Surface Heat Transfer Measurements. J. Turbomachinery-transactions Asme 123 (1), 168–177. doi:10.1115/1.1333693
Boyle, R. J., and Stripf, M. (2008). Simplified Approach to Predicting Rough Surface Transition. J. Turbomach. 131 (4), 1345–1357. doi:10.1115/gt2008-51543
Graham, C. G., and Kost, F. H. (1979). Shock Boundary Layer Interaction on High Turning Transonic Turbine Cascades. San Diego, CA, United states: American Society of Mechanical Engineers (ASME). Paper presented at the ASME 1979 International Gas Turbine Conference and Exhibit and Solar Energy Conference, GT 1979, March 12, 1979 - March 15, 1979.
Hou, W. T., Qiao, W. Y., and Luo, H. L. (2011). Shock-wave/boundary-layer Interaction in a Transonic Turbine Cascade. Proc. Institution Mech. Eng. Part G J. Aerosp. Eng. 225 (1), 77–85. doi:10.1243/09544100jaero745
Irimpan, K. J., and Menezes, V. (2018). Effect of Surface Roughness on the Heating Rates of Large-Angled Hypersonic Blunt Cones. Acta Astronaut. 144, 331–338. doi:10.1016/j.actaastro.2018.01.011
Li, Y., Zhang, K., Zheng, B., and Yang, F. (2016). Effect of Local Velocity on Diffusion-Induced Stress in Large-Deformation Electrodes of Lithium-Ion Batteries. J. Power Sources 319 (4), 168–177. doi:10.1016/j.jpowsour.2016.04.056
Melino, F., Morini, M., Peretto, A., Michele, P., and Pier, R. S. (2011). Compressor Fouling Modeling: Relationship between Computational Roughness and Gas Turbine Operation Time. J. Eng. Gas Turbines Power 134 (5), 1011–1019. doi:10.1115/gt2011-46089
Rainer, K., Klaus, B., and Meron, W. (2009). Degradation Effects on Industrial Gas Turbines. J. Eng. Gas Turbines Power 131 (6), 062401. doi:10.1115/1.3097135
Seung, C. B., June, H. S., and Seung, J. S. (2010). Impact of Surface Roughness on Compressor Cascade Performance. J. Fluids Eng. 132 (6), 064502. doi:10.1115/1.4001788
Syverud, E., and Bakken, L. E. (2006). The Impact of Surface Roughness on Axial Compressor Performance Deterioration. Barcelona, Spain: ASME Turbo Expo 2006. Paper presented at the 2006 ASME 51st Turbo Expo, May 6, 2006 - May 11, 2006.
Tweedt, D. L., Schreiber, H. A., and Starken, H. (1988). Experimental Investigation of the Performance of a Supersonic Compressor Cascade. J. Turbomachinery-transactions Asme 110 (4), 456–466. doi:10.1115/1.3262219
Yao, J., and Carson, S. (2006). HPT/LPT Interaction and Flow Management in the Inter-turbine Space of a Modern Axial Flow Turbine. Barcelona, Spain: ASME Turbo Expo 2006. Paper presented at the 2006 ASME 51st Turbo Expo, May 6, 2006 - May 11, 2006.
Yi, S., Liu, W., Xu, D., Gang, D., and Yi, S. (2016). A Combined Experimental and Numerical Investigation of Roughness Induced Supersonic Boundary Layer Transition. Acta Astronaut. 118, 199–209. doi:10.1016/j.actaastro.2015.10.008
Zhao, Y., Lou, W., Zhao, D., and Xu, J. (2016). Investigation on the Reduction of Trailing Edge Shock Losses for a Highly Loaded Transonic Turbine. Seoul, Korea, Republic of. Paper presented at the ASME Turbo Expo 2016: Turbomachinery Technical Conference and Exposition, GT 2016, June 13, 2016 - June 17, 2016.
Keywords: supersonic cascade, shock wave, roughness, total pressure loss, performance
Citation: Wang Y, Dai J, Zhou S, Wang M and Wang Z (2022) Research on the Influence of Surface Roughness on the Flow Field in the Cascade. Front. Energy Res. 10:913770. doi: 10.3389/fenrg.2022.913770
Received: 06 April 2022; Accepted: 09 May 2022;
Published: 23 June 2022.
Edited by:
Lei Luo, Harbin Institute of Technology, ChinaCopyright © 2022 Wang, Dai, Zhou, Wang and Wang. This is an open-access article distributed under the terms of the Creative Commons Attribution License (CC BY). The use, distribution or reproduction in other forums is permitted, provided the original author(s) and the copyright owner(s) are credited and that the original publication in this journal is cited, in accordance with accepted academic practice. No use, distribution or reproduction is permitted which does not comply with these terms.
*Correspondence: Meng Wang, d2FuZ21lbmdfYUBocmJldS5lZHUuY24=