 Luigi Schibuola
 Chiara Tambani
- Department of Architecture, University Iuav of Venice, Venice, Italy
In coastal cities, seawater heat pumps (SWHPs) can combine heat pump technology with the availability of seawater to produce the heat and the cold necessary for heating, ventilation, and air conditioning (HVAC) systems installed in buildings. In heating mode, the seawater is used as a cold source and provides the low-temperature heat needed for the operation of the machine. In cooling mode, the seawater removes the heat dissipated by the condenser of the heat pump working for air conditioning. This seawater application seems to be very promising since the temperature trend of the seawater appears to be more favorable than the alternative use of outdoor air, both in winter and in summer. In a case study in Trieste, the performance of a district heating/cooling network supplied with seawater and based on decentralized heat pumps is investigated. For this purpose, annual dynamic simulations were performed, modeling an urban area, the heat pumps, and the network. The energy efficiency evaluation shows a clear superiority of the SWHP solution compared to boilers and airsource heat pumps and thus the possibility to provide a significant contribution to the decarbonization of buildings. Moreover, the results highlight the ability of this GWHP network to reduce the urban heat island (UHI) phenomenon since the heat dissipated by the heat pumps during summer air conditioning is removed from the urban area. Therefore, SWHPs in coastal cities can be among the mitigation measures for UHI to increase outdoor comfort and heat wave resilience in urban areas.
Introduction
Decentralized Heat Pumps in District Heating and Cooling Networks
The use of heat pumps (HPs) can give an important contribution to achieving the decarbonization target in the building sector (Abbasi et al., 2021; Zuberi et al., 2021). It reduces energy consumption and CO2 emissions and, on the other hand, increases the share of renewable energy (European Community, 2010). The best performance is possible when wasted heat or natural resources are available for HP use. The use of geothermal energy as a heat source/sink for heat pumps is of great interest due to the low seasonal temperature variations compared to the air source (Sarbu and Sebarchievici, 2014). There are several technologies based on the use of groundwater from wells, surface water (lake, river, and sea), or direct coupling with the ground through a heat exchanger (Schibuola et al., 2013b). In general, the systematic installation of geothermal heat exchangers in existing urban areas is less feasible and geothermal heat exchangers may also release or extract heat in the first soil layers directly under the urban area. This fact leads to an increase in the subsurface of the UHI effect in summer and of cooling of the soil (Luo and Asproudi, 2015) in winter. The use of water offers significant advantages, such as low installation costs and no available land area and can therefore be a real alternative for buildings located near significant surface waters such as rivers, lakes, or seas (Chen et al., 2006; Nam and Ooka, 2010; Liang et al., 2011; Schibuola and Tambani, 2012) and is particularly tempting in coastal cities. Especially in the open sea, the presence of marine currents contributes to the rapid dissipation of the released heat from the coast in front of the urban area and the mixing of water with different temperature levels, which reduces the heating of the water compared to less extensive surface waters (ponds, lagoons). In the case of air conditioning, the energy advantages of these systems have been clearly highlighted (Song et al., 2007), and based on these results, numerous studies have been conducted on the economic and energy optimization of a large-scale application of the seawater heat pump (SWHP) for district heating and cooling (Li et al., 2010; Baik et al., 2014). From the first district heating systems, characterized by centralized plants injecting steam or water at high temperatures into the networks, this technology is gradually being transferred to the new generations of district heating systems distributing water at lower temperatures (Lund et al., 2014; Reiners et al., 2021). Recent studies focus, in detail, on the so-called 5th-generation district heating and cooling (5GDHC) systems, which operate at a temperature level close to that of the ground. In this case, the network water is used as a cold source/sink for decentralized HPs. The 5GDHC designation was first introduced as part of the EU FLEXYNETS project (Author Anonymous, 2020). 5GDHC offers numerous advantages, the most important of which are the elimination of heat losses in pipelines, the reduction of initial costs of centralized power generation systems, the possible contemporary use for heating and cooling services, increasing accessibility to use wasted heat (Wheatcroft et al., 2020), heat from geothermal heat exchangers (Foster et al., 2016; Prasanna et al., 2017), from solar systems (Pauschinger, 2016), and especially from locally available renewable energy sources such as underground and surface aquifers (Verhoeven et al., 2014; Pattijn and Baumans, 2017; Schibuola and Tambani, 2022), and in particular the sea (Stene and Eggen, 1995; Daikin, 2014; Schibuola and Tambani, 2020). In addition, decentralized electric HPs can spread the local use of electricity from photovoltaic systems and help a smart grid work together with the increasing proliferation of small generators/consumers (Schibuola et al., 2015; Schibuola et al., 2016; Lund et al., 2017; Chen et al., 2021). The lower temperature drop in the water loop is associated with larger flow rates and pipe sizes than previous hot water systems. However, the use of uninsulated polyethylene (PE) pipes reduces material and installation costs. The increase in pump consumption can be limited by variable flow rates based on the effective demand control.
Mitigating the Urban Heat Island Phenomenon
An important topic to explore is the relationship between 5GDHC and the urban heat island (UHI) effect, which affects both UHI mitigation and 5GDHC performance. The UHI effect is the best-known phenomenon of urban climate. It is characterized by the fact that ambient temperatures in urban areas are higher than in rural areas (Martin-Vide et al., 2015). Many studies (Santamouris, 2007; Santamouris, 2014; Manoli et al., 2019; Jain et al., 2020; Mosteiro-Romero et al., 2020; Hong et al., 2021) have clearly shown that UHI can significantly affect the energy consumption of buildings in different cities around the world. During the heating season in cold and temperate climates, the heat island reduces energy consumption in urban centers compared to that in suburban areas. On the other hand, in warm and hot climates without heating demand, the negative effect of UHI usually extends throughout the year and is not limited to summer. In fact, the urban temperature increment has a negative impact on the air conditioning of buildings due to the increased cooling demand, which negatively affects the efficiency of air conditioning systems and consequently increases the electrical load (Li et al., 2019; Shi et al., 2019). At the same time, high temperatures in cities reduce the cooling potential of techniques such as natural ventilation (Duan et al., 2019) and affect human comfort outdoors. In fact, energy consumption releases heat to the environment, influencing the intensity and temporal variability of urban climate (Cui et al., 2017; Sun et al., 2018). Therefore, action plans to reduce the UHI effect should also consider possible methods to reduce energy consumption (Ferrando et al., 2021), starting from a better understanding of the links between environmental impacts and energy system behavior (Wen and Lian, 2009; Doan et al., 2019), including UHI effects in thermal simulations (Guattari et al., 2018). Dynamic calculation programs based on climate data recorded in rural stations or airports are often used to simulate the energy efficiency of buildings. However, these weather records are inappropriate when used for different climatic conditions in urban environments and can lead to inaccurate predictions of energy demand. Two methods are commonly used to assess the impact of UHI on building energy use. The first uses on-site meteorological observations as input to energy simulation tools (Yang et al., 2019; Yang et al., 2020b), and the second uses meteorological files generated by urban climate modeling codes for simulation (Palme et al., 2017; Lauzet et al., 2019). One of the most commonly used simulation tools is the urban weather generator (UWG) (Bueno et al., 2013), a software based on EnergyPlus (U.S. Department of Energy, 2019a) that combines urban-scale assessments with a building simulation model. The UWG tool has been validated under different weather conditions (Salvati et al., 2017; Salvati et al., 2019; Mao et al., 2018; Martinez et al., 2021) and is widely used to study different urban contexts (Boccalatte et al., 2020; Liu et al., 2020). For this reason, it is used in a wide range of use cases (Street et al., 2013; Mao et al., 2017; Santos et al., 2018; Lima et al., 2019). Measures to mitigate UHI typically focus on solutions that involve only the use of appropriate building geometries and surface materials with high albedo (Castellani et al., 2017; Morini et al., 2017) and a systematic increase in urban green space (Aram et al., 2019; Bisegna et al., 2019; Bevilacqua et al., 2020; MacLachlan et al., 2021). However, anthropogenic heat is often a driving force of the UHI phenomenon (Sailor and Fan, 2004; Smith et al., 2009; Luo et al., 2020; Mei and Yuan, 2021). As sensitivity studies have shown (Salvati et al., 2017), anthropogenic heat fluctuations can indeed significantly alter the UHI effect. This heat is mainly generated during the day and is largely due to human activities, traffic, and building air conditioning. For this reason, especially when air-cooled air conditioning systems are used systematically, the possibility of reducing the heat gain that is released to the outside by the HVAC system must always be considered. Consequently, implementing the 5GDHC technology in conjunction with the use of seawater can be an effective option.
A Performance Analysis of a Seawater-Fed 5th Generation District Heating and Cooling Networks
This study addresses the potential benefits of seawater for improving the energy performance of HVAC systems and reducing the UHI phenomenon. For this aim, a case study is investigated in the coastal city of Trieste, which is in the northeastern Italy on the Adriatic Sea. A retrofit action for an urban area based on the systematic introduction of decentralized HPs in a new 5GDHC network fed by seawater is proposed. Specifically, the analysis consists of 1) the elaboration of the specific retrofit project focusing on the 5GDHC to be installed in the area, 2) the application of the archetype procedure to model the urban area, 3) the evaluation of the UHI effect and its impact on the building heating and cooling demand, 4) the modeling of the 5GDHC network and HPs, and 5) the assessment of the benefits from the use of seawater in the 5GDHC compared to the alternative air source HPs (ASHP) or condensing boilers.
Materials and Methods
Description of the Retrofit Action
The urban area selected as a case study is located near the old seaport and preserves the architectural setting from the time of the Austro-Hungarian Empire. A regular division into large building blocks, clearly recognizable because they are separated by streets, characterizes the architectural layout. The area is highlighted by a yellow line on the aerial photograph in Figure 1A. It is a rectangle with dimensions 402 m × 143 m and a total area of 57,486 m2. Figure 1B shows a plan of the 16 blocks in the area, numbered in this study, as indicated at the bottom of the same figure. Each block consists of different buildings with diverse height and number of floors. Figure 2 shows a photograph and plan of the existing buildings for each of the three blocks selected as examples. The total built-up area as a percentage of the total area is 79%, and the building density is 7.97 m3/m2. Most of the buildings are historic buildings built in the 19th and early 20th centuries, eventually with additional portions more recent. The remaining part dates back to the period between the 50s and 60 s of the last century. The buildings have usually retained the same features of the construction period. Since the thermal insulation of buildings was required by a national law starting in 1976, the building envelopes are uninsulated and only the windows have been changed from single to double glazing over the years.
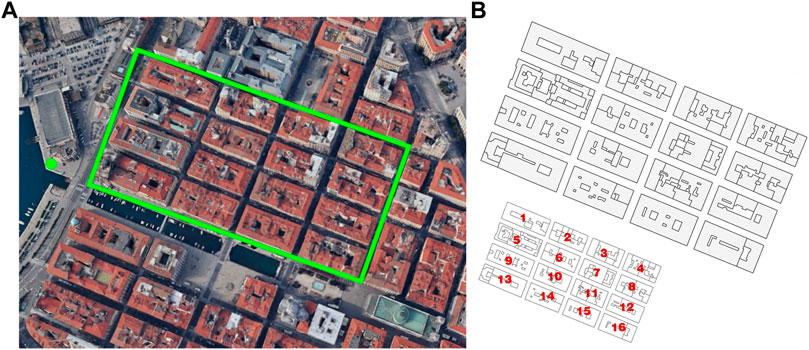
FIGURE 1. The investigated area: a photograph (A) and a map of the blocks in the area, numbered as indicated in panel (B).
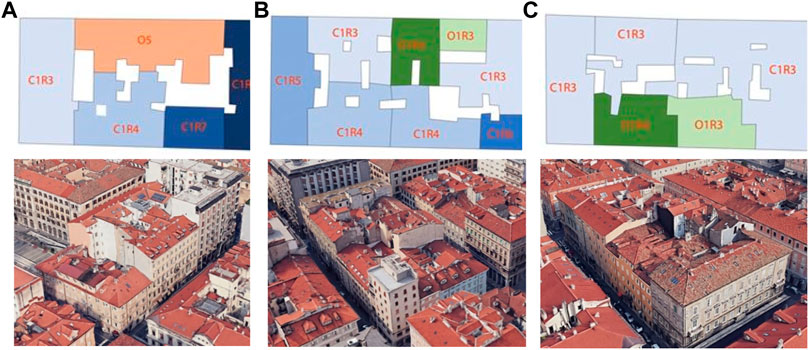
FIGURE 2. Plan of buildings and photograph of block 3 (A), block 4 (B), and block 11 (C).
Centralized heating systems of obsolete design with radiators and thermal power stations in each block are present. Air conditioning systems with air-cooled chillers are installed only for commercial and directional buildings. These refrigeration machines are located in courtyards or terraces; instead, the installation of autonomous air conditioners such as split systems, currently so widely used in residential buildings, is not possible here because the facades of these buildings do not have balconies and the presence of preservation orders affects the external perimeter walls. Therefore, air conditioning systems in residential buildings are very rare and may be present only in a few rooms.
In this context, an effective retrofit action must first provide for a substantial improvement in the thermal performance of the building envelope through the application of typical techniques. The insertion of a layer of insulation under the roof tiles, the replacement of the existing windows with higher performance products. In the presence of preservation orders, the external wall insulation must be applied on the inside instead of using it as an external thermal cladding. The goal is to achieve at least the thermal insulation level currently required by the national regulation (MISE, 2015). Therefore, this analysis considers the thermal transmittance coefficients (U-values) corresponding to the maximum value allowed by the national regulation for the climatic zone of Trieste (Zone E, 2102 HDD). The description of the multiple layers (from inside to outside) of the main building structures included in the building simulation models and their U-values is given in Table 2. Considering the increasing use of air conditioning, the adopted solution proposes the application of HP for both heating and air conditioning in all buildings. These two retrofit measures are fully aligned with the nearly zero-energy building (nZEB) goal. In fact, this level of insulation in building structures is one of the nZEB requirements in national legislation (MISE, 2015). Moreover, the nZEB definition (European Community, 2010) states that the low energy demand should be met to a very large extent by renewable energy. Heat pump technology can provide an important contribution to this purpose. The retrofit plan assumes the modern tendency to centralize the generation of heat and cold in the building blocks with individual energy accounting in order to optimize the management of the HVAC systems and, consequently, the energy consumption. Therefore, a centralized HP is considered for each block. The SWHP can be installed in a technical room and often in the existing thermal power station in the substitution of the boilers. The ASHP must be placed outdoors, possibly on flat roofs, terraces, or in courtyards. This is the solution already adopted for the existing air-cooled chillers for air conditioning of the existing tertiary activities. Among the different options, the retrofit action foresees the installation of fan coils as terminal units, used for heating with a supply water temperature of 45°C and for air conditioning with a supply temperature of 7°C for both GWHP and ASHP.
The rural weather file used for the simulations was obtained from actual weather data collected from a meteorological station in a rural area near Trieste and therefore not affected by urban influences. The rural weather data were used to create the corresponding EnergyPlus weather (EPW) file according to the U.S. Department of Energy (2019b). In the figures, the rural weather data are indicated as S_rural in summer and W_rural in winter. Since in Trieste the heating season lasts from October to April, the winter period includes the months from January to April and then from October to December. The air conditioning, and therefore the summer period, lasts from June to September. The profile of outdoor air temperature is compared in Figure 3A, with the monthly average seawater temperatures in Trieste. These seawater temperatures come from a meteorological open data (Climate-data.org, 2022.), which provide the monthly average values of minimum, average, and maximum daily temperatures. These averages are shown in Figure 3B for the 12 months. Figure 3B shows a very limited thermal excursion of seawater temperature during each month with respect to the strong oscillation of outdoor air temperatures. The monthly average seawater temperature is effectively representative of the thermal level of the sea in a month, and this fact justifies the use of a linear interpolation between these averages to build an annual trend of the seawater temperatures, also reported in Figure 3A.
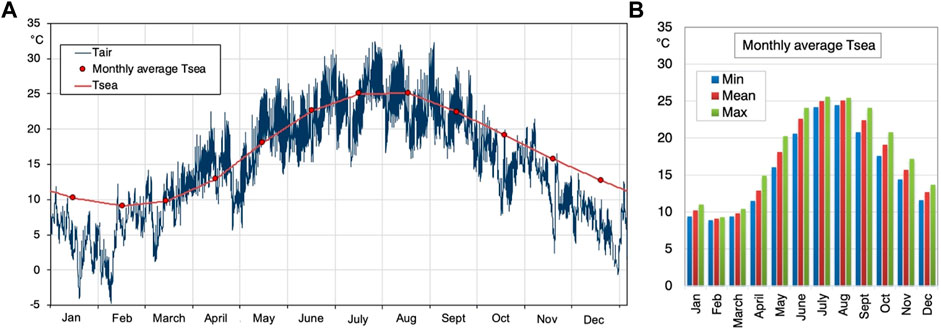
FIGURE 3. Hourly trend of the outdoor air temperature (Tair) and monthly average seawater temperatures (Tsea) (A). Monthly averages of the minimum, mean, and maximum daily seawater temperatures (B).The linear interpolating trend of Tsea is also reported in panel (A).
The Implementation of a Seawater District Heating and Cooling Networks
The intervention foresees the installation of centralized water-to-water HPs, one for each building block, connected to a two-pipe water network built in the studied area. Each HP withdraws the required amount of water from the delivery pipe of the network with a dedicated pump and gives it back to the return pipe. PE underground pipes are considered for this grid. The urban network forms a closed circuit connected to a technical station, which can be located in the immediate vicinity of the old warehouse next to the seaside and the study area. Here, two plate heat exchangers are considered, operating alternately to allow maintenance. They are interposed between the seawater circuit and the urban circuit to avoid fouling inside the evaporators and condensers of the HPs. Italian legislation (Author Anonymous, 1999) prohibits the thermal use of seawater with a temperature drop higher than 3°C and the temperature of the seawater returned must not exceed 35°C. The two heat exchangers are sized according to this worst permissible condition, i.e., in cooling mode, a temperature difference for the seawater of 32°C–35°C, which corresponds to a nominal water temperature drop of 35°C–40°C in the urban circuit. In heating mode, assuming the minimum seawater temperature of 11°C from Figure3B, the corresponding design temperature drops are 11°C–8°C for the seawater and 8°C–3°C for the urban loop. The sizing of the network is based on the simulation results regarding the building loads and the performances of HPs. The main network data can be found in Table 1.
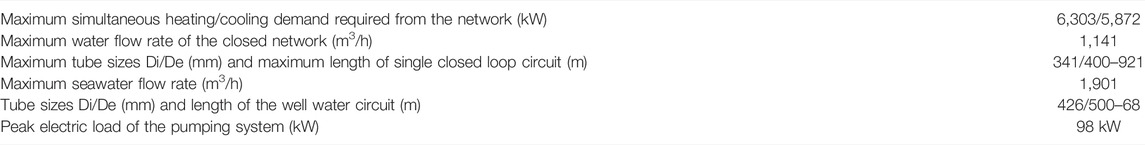
TABLE 1. Main data of the district network.
The functional diagram of a typical seawater intake plant is shown in Figure 4. In the seawater circuit, a self-cleaning filter (Figure 5A) is recommended to reduce maintenance interventions on heat exchangers and filters. The location of the seawater intake station is proposed near the quay at a point indicated by a yellow dot in Figure 1A. A sketch of a typical station is shown in Figure 5B. The use of an underground space facilitates the operation of the hydraulic pumps, and the presence of a pre-chamber for the introduction of seawater reduces turbulence in the intake and the dirt sucked in. Of course, the pre-chamber must be accessible for maintenance, as shown in Figure 5C. To avoid interference, the water return to the sea can be placed 50 m away from the suction point at the tip of the same pier.
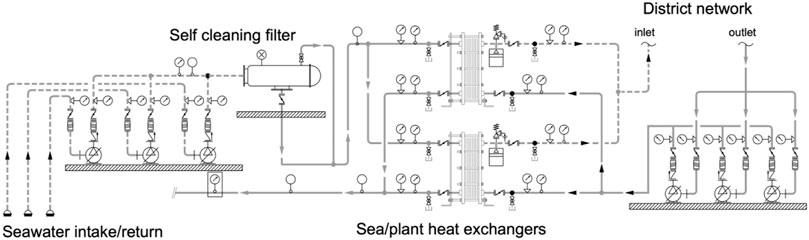
FIGURE 4. A functional diagram of the seawater intake plant.
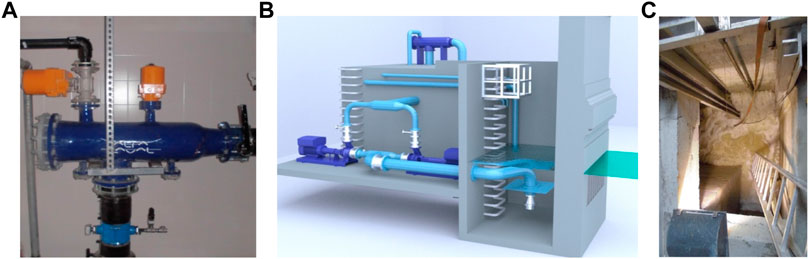
FIGURE 5. A self-cleaning filter (A), a sketch of a seawater intake station (B), and a seawater intake prechamber (C).
The pumping system is based on three pumps for both the closed loop of the district network and the open circuit of the seawater. A smart control of the pumping system is able to drastically reduce the power consumption, as the demand of the building varies greatly both in winter and in summer. Indeed, in the case of very frequent part loads, a reduced number of pumps can work alternatively. Moreover, a variable flow rate of the pumping system is achieved by controlling the speed of the electric motors of the pumps through the inverter technology. For this purpose, the control of the water flow rate is designed to keep the temperature difference between the return and supply water constant in both heating and cooling modes. This difference is 5°C for the urban network and 3°C for the seawater circuit. This control of pumping power is very performing. In the case study, the annual simulation shows a saving in the electricity consumption of the pumps of 71% compared to the case of constant flow rate. Normally, in this type of technical station, two heat exchangers are installed, working alternately to meet the maintenance requirements, as well as a filter for the seawater. The use of a self-cleaning filter through intermittent reversal cycles of the water flows can increase the life of the filter efficiency without maintenance stops. In addition, experience (Schibuola et al., 2017) with self-cleaning filters has shown that the heat exchangers hardly foul even when the water is very dirty. This result suggests in many cases the possibility of using only one heat exchanger and limiting the cleaning of the exchanger to the end of the heating or cooling season.
Urban Area Modeling
The modeling of the investigated area is based on the data from GIS, which provides information about the building area, height, and use of each building in the blocks. The archetype modeling approach (Swan and Ugursal, 2009; Yang et al., 2020a) was used to calculate the heating and cooling demand of the buildings in the area. The entire building stock is categorized according to its characteristics that affect energy demand. The first step is to distinguish some basic building typologies. In this case study, four types were highlighted. Residential buildings where the ground floor rooms are not heated and are used as garages or storage rooms (type 1). Residential buildings, but whose ground floor is used by commercial establishments (type 2). Residential buildings whose ground floor is used for office purposes (type 3). Directional buildings that contain only offices (type 4). Based on these selected typologies, the second step is to distinguish all buildings into categories based on the use and number of floors. Each category is named by the initial letter of the use (garage, commercial, residential, office) followed by the number of floors. Thus, the categories of types 1 through 3 consist of two letters and two numbers. The categories of type 4 contain only the letter O followed by the number of floors. In Figure 2, different colors are used to indicate the categories in each block reported here. Figure 6 shows the heated volume of the categories that belong to each type as a percentage of the total heated volume of the buildings of that type. In this way, it is possible to individuate the category that is to be considered representative of all buildings of that type on the basis of its volume significance in the total heated volume of that building typology. In Figure 6, the four selected categories are indicated by an arrow. A table in Figure 6 also indicates the percentage volume of these selected categories with respect to the total building volume in the area. For each of these four categories, an archetype building is selected to characterize the category and thus all the types in the stock. The archetypes selected in this case study are listed in Table 2, which includes their main characteristics and simulation parameters. The hourly heating or cooling load profile of each archetype is calculated using the EnergyPlus code, a comprehensive and robust building simulation program. The EnergyPlus calculation is based on the contemporary solution of the global energy balance of each thermal zone of the building, taking into account the contribution of the HVAC system to maintain the thermal control setpoints (Yang et al., 2019). For each archetype, the hourly load is divided by the relative building volume to estimate an hourly load intensity that is adopted for all buildings belonging to the relative type. Consequently, the total load of a building typology is calculated by multiplying this load intensity by the corresponding total building volume. Finally, the hourly demand profile of the entire building stock in the studied area is calculated by adding the four total loads for each building typology.
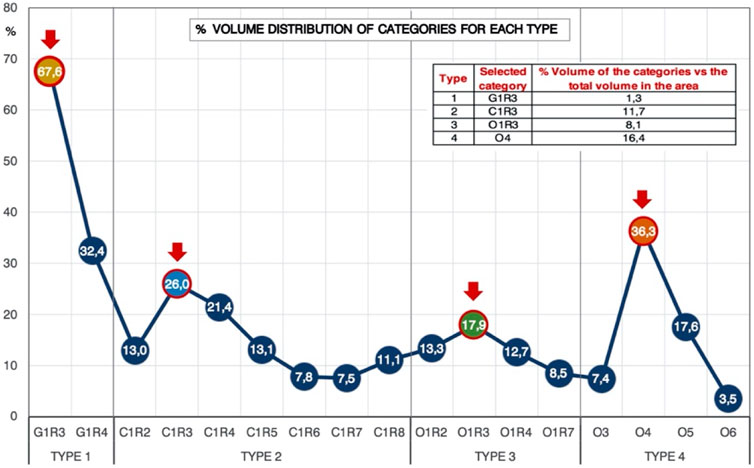
FIGURE 6. Percentage volume distribution of categories and selected category for each type. The table shows the contribution of the selected categories to the total volume of buildings in the area.
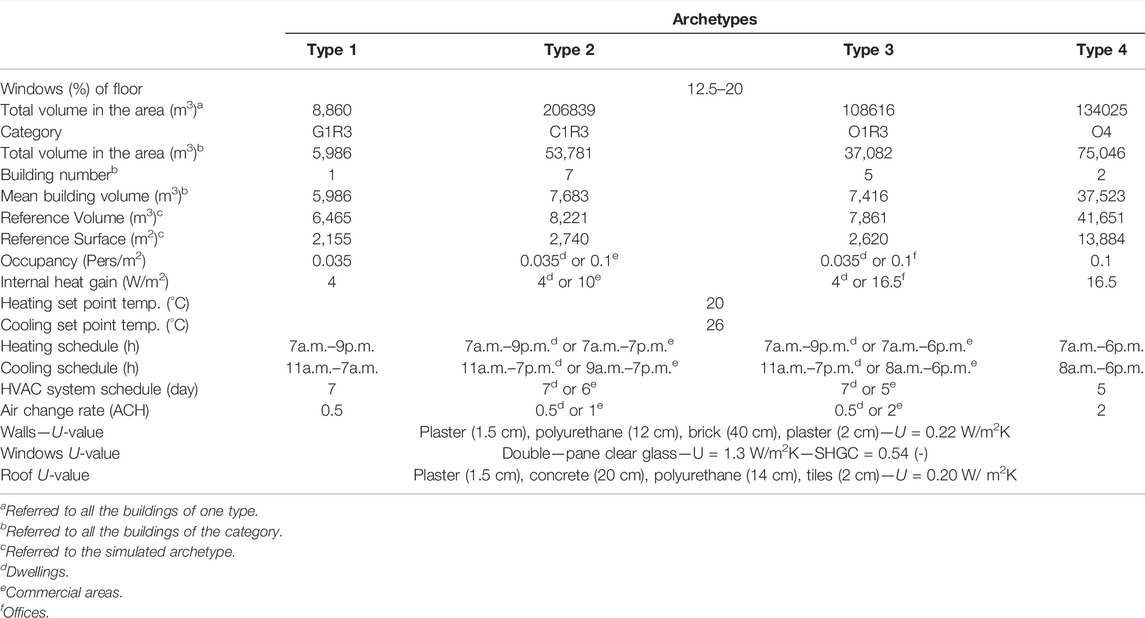
TABLE 2. Characteristics and simulation parameters of the archetypes.
Urban Weather Generator Software to Simulate Urban Heat Island Effects
The UWG code calculates average hourly air temperatures within the urban canopy starting from a rural weather file. Its output is an urban weather file taking into account the UHI phenomenon and is in EPW format, so it can be used for EnergyPlus simulations. UWG requires an auxiliary file in XML format to proceed with parametric modeling of the urban area under study (MIT, 2014; Nakano et al., 2015). This XML file contains the values of the parameters used to build the urban model. These data are organized into four groups: information about the buildings, urban morphology, vegetation characteristics, and data about the reference site. UWG assumes that the air within the urban canopy layer is well mixed. Urban air temperatures are calculated using the heat balance method, taking into account the heat capacity of the air in the urban canyon. The energy balance of the urban canyon is based on heat fluxes from the building envelopes and the street, heat fluxes due to air exfiltration, waste heat from HVAC systems and other anthropogenic heat sources, convective heat exchange between the air of the urban canyon and the atmosphere, and the radiant heat exchange between the surfaces of the urban canyon and the sky.
Regarding building behavior, UWG uses EnergyPlus to simulate heat flows in buildings. Therefore, the required information about buildings is the same as that introduced in the EnergyPlus models. This includes building geometries and their structure characteristics, internal heat gains, and occupancy schedules. Consistent with the archetype approach adopted, the building data provided by the UWG model pertain only to the four archetypes representing all buildings present in the area and are the same as that used for the load calculations. These building data are summarized in Table 2. The other urban morphology information, mostly extracted from the data of GIS and introduced into the XML file, is shown in Table 3. A general typical albedo value of 0.2 is used for the building surfaces. For evaluation during the air conditioning period, the UWG requires an average chiller efficiency (EER) for each HVAC system. In this study, the seasonal EER values confirmed by the final outcomings were adopted and, more specifically, 3.6 in the case of the ASHPs and 4.5 for the SWHPs. Another important information requested by UWG in the XML file for each chiller is the value of the parameter “heat released to canyon,” which can vary between 0 and 1. This is the fraction of waste heat from the chillers that is discharged to the urban area. A value of 1 is typical for ASHPs where all the heat from the condensers is released to the outside air in the canyon. A value of 0 means that the waste heat is not discharged into the canyon, which is the case with the SWHP technology. Consequently, by using these two different values for this parameter, two different urban EPW files were created for the summer. The first EPW, named S_UHI_A, was calculated with a value of 1 and was therefore used with the ASHPs. The second EPW, named S_UHI_B, was calculated with a value of 0 and used with the SWHPs.
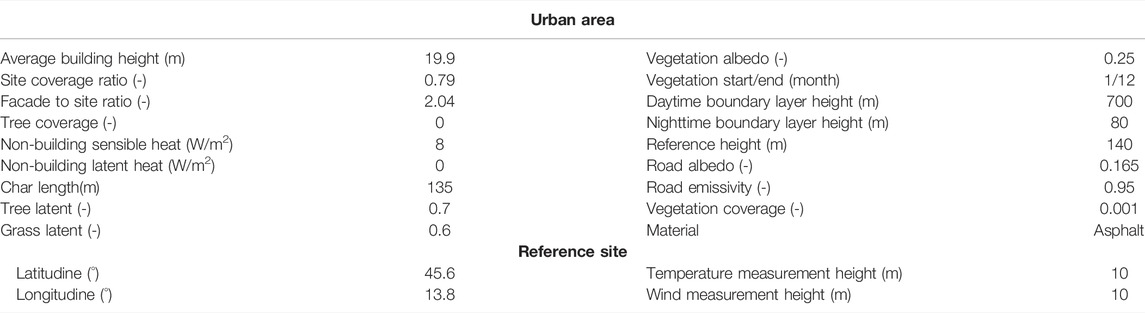
TABLE 3. Main parameters of the UWG model.
During the heating season, UWG assumes the use of traditional boilers, while the use of HP is not currently planned. It is necessary to specify a boiler efficiency between 0 and 1. If you select a boiler efficiency of 1, no heat is released into the urban canopy by the HVAC system. This hypothesis is correct if the SWHPs are present. However, in the absence of a possible alternative calculation, it was also assumed in the case of ASHPs. Therefore, only one urban weather provided by UWG was used in winter and here named W_UHI. This fact leads to neglecting that outdoor urban air is used as a cold source for ASHPs. By using W_UHI, the UHI effect in winter is overestimated in the case of ASHPs and consequently the heating load of the building is somewhat underestimated in this case. As quantified later by the simulation, the increase in urban temperature caused by the UHI phenomenon involves a useful reduction in heating demand. The UWG calculations take into account not only the outside anthropogenic heat but also the heat losses from the buildings that are transferred as heat to the urban canopy. However, in the case of ASHPs, the outdoor air is used as a cold source and a quota of the heat losses is returned to the interior of the buildings by the ASHPs. In detail, the heating capacity provided to a building by the ASHP is the sum of the contribution from the cold source and the energy consumed by the compressors. Therefore, for ASHPs, only a quota of the building’s heat losses should be considered in the UWG calculation. For example, with a typical HP efficiency (COP) of 3, only 33% of the building’s heat losses should be added to the external anthropogenic heat gains. The overestimation of heating demand reduction in the case of ASHPs is not considered a problem in this analysis. Since the purpose of this study is to evaluate the benefits of SWHPs as an alternative to ASHPs, the presence of a possible overestimation in the second case can be considered as a further motivation for an advantage in this comparison.
Decentralized Heat Pump Modeling
High performing machines are considered for both SWHPs and ASHPs. They are equipped with multiple scroll compressors, stainless steel plate heat exchangers that serve as evaporators and condensers, and R410A brine. In the larger building blocks, HPs have two refrigerant circuits, each with two compressors. The only difference between ASHPs and SWHPs is that one heat exchanger of the ASHPs is an air coil. The performance of HP is characterized by two basic parameters, full capacity and efficiency. Full capacity is the maximum thermal power that the unit can provide in heating or cooling mode. Efficiency has a different expression in heating and cooling modes. In heating mode, this efficiency, called coefficient of performance (COP), is the ratio between the heating power provided and the electrical power consumption. In cooling mode, this efficiency, called energy efficiency ratio (EER), is the ratio between the cooling power provided and the electrical power consumption. These performances are greatly affected by the temperatures of the external fluids that exchange heat at the evaporator and the condenser. For this reason, performance data are normally provided by manufacturers as a function of these operating temperatures. Standard test methods (CEN, 2019) are used to obtain these data. Specifically, this information in this analysis comes from RHOSS (2019) for SWHPs and from RHOSS (2018) for ASHPs. As a result of choosing terminal units based on air handling units and fan coils for HVAC systems. The supply water temperatures are fixed at 45°C for heating and 7°C for cooling. Therefore, the performance of HP at full capacity varies only as a function of the outdoor air temperature for ASHPs and the water inlet temperature from the urban network for SWHPs. For ASHPs, the outdoor air is moved by fans installed in the machine, so the power consumption of the fans is included in the EER/COP calculation. Instead, the SWHPs’ inlet water is pumped through the district grid and the consumption for pumping is calculated separately. For the simulated HPs, capacity control is based on a multi-stage control with two stages, 50% and 100% of total capacity, achieved by tandem compressors. A smart capacity control is fundamental for optimizing HP operation. In fact, the capacity control must modulate the actual capacity provided to balance the building load, which is highly variable and often very low relative to the full load capacity of the machine. This part-load operation can cause severe penalization in the absence of a proper control system. The use of tandem compressors installed in the same refrigerant circuit makes it possible to limit this degradation of performance thanks to the oversize of the evaporator and condenser when only one compressor is operating. In any case, for a correct evaluation of the effective HP efficiency, a correction part load factor (PLF) is used for the previously introduced COP/EER at full load. This procedure is validated by standards (CEN, 2018) and is usually used for a performance rating of HPs under real working conditions (Schibuola, 2000; Dongellini et al., 2015; In et al., 2015). PLF values are obtained by interpolating the manufacturer’s data. Typically, the manufacturer provides part load ratings at 25%, 50%, 75%, and 100% of full load capacity, as determined by standard laboratory tests (CEN, 2018). Indeed, these data are available because they are needed to calculate seasonal efficiency indices such as the European Seasonal Energy Efficiency Ratio (ESEER), which is a weighted average of these four values (Marinhas, 2013). Based on these values, it is also possible to trace the curves of the corresponding PLF correction factor as a function of the part load level, which is the ratio between the actual capacity provided and the full load capacity of the HP (Schibuola et al., 2013a). For this HP modeling, a quasi-steady-state calculation procedure based on a spreadsheet-style model was used. In this case, at each time step, the hourly building load calculated by EnergyPlus is used to evaluate HP performance. At each time step, the actual HP capacity required is equal to the building load. In heating mode, the full load COP and heating capacity are determined as a function of the inlet water temperature for SWHPs or the outdoor air temperature for ASHPs. Based on the heat exchanger design, this inlet water temperature is estimated to be 3°C below the seawater temperature. The level of part load allows us to calculate the PLF. Finally, the actual COP is obtained by multiplying the full load COP by the PLF. The electricity consumption is the ratio between the actual heating capacity on the simultaneous COP. The monthly average COP is the ratio between the heating energy supplied in that month and the corresponding monthly electricity consumption. The same calculation at the seasonal level gives the seasonal average COP. In cooling mode, the same procedure is used, except that in this case EER and the cooling load are taken into account.
Results
The Urban Heat Island Effect
The UHI effect is investigated by comparing the temperatures of the monitored rural weather and the two urban weathers calculated by the UWG code in the cases of using ASHPs or SWHPs. In summer, the weather condition is referred to as S_UHI_A in the first case and S_UHI_B in the second case. In winter, as mentioned earlier, only one urban weather condition is evaluated and is referred to as W_UHI. In general, these urban analyses highlight a UHI intensity equal to the difference between urban and rural temperatures at the same moment. Figure 7 shows the air temperature trends of the rural weather and the two urban weather conditions, S_UHI_A and S_UHI_B, on 6 days in July. The corresponding UHI intensities are also indicated. The UHI behavior is clearly evident and always confirmed. The S_UHI_A temperatures are the highest, and the S_UHI_B temperatures are in between the other two. Building air conditioning degrades urban thermal conditions, but removal of heat from condensers in SWHPs reduces this degradation. High variability in UHI intensities is observed mainly during daytime hours, with a significant increase at night. In Figure 7, a table shows the average values of temperatures and UHI intensities on the 6 days for all day, daytime, and nighttime. The three average S_UHI_A intensities are greater than 1 degree, but these values are approximately halved in the S_UHI_B case. The same outcomes, based on 6 days in December, are reported in Figure 8. In this case, only one urban temperature trend is compared to that of the rural area. The UHI effect is again evident throughout the period, but the UHI intensities are lower than in summer. The high variability of UHI intensities and their largest values during the night are also confirmed in winter.
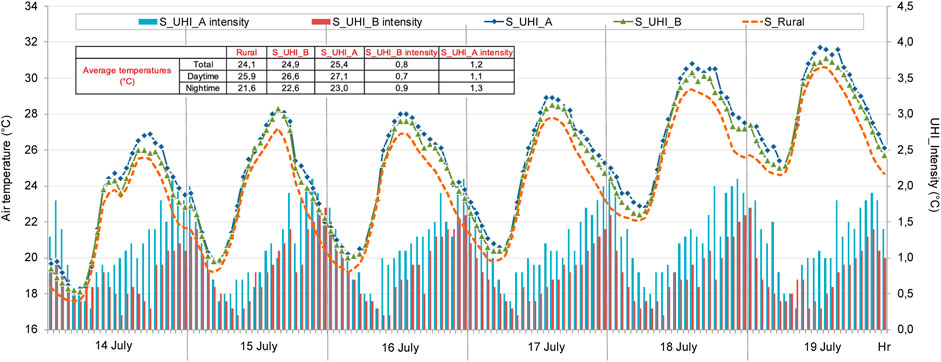
FIGURE 7. Outdoor temperatures of rural and urban weather in case UHI_1 or UHI_2 on 6 days in July and corresponding UHI intensities. Their average values in the three daily periods are also shown.
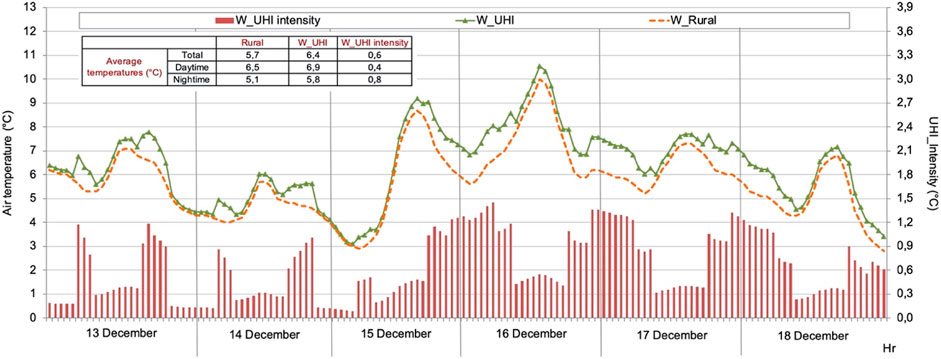
FIGURE 8. Outdoor temperatures of rural and urban weather on 6 days in December and corresponding UHI intensities. Their average values in the three daily periods are also given.
Figure 9A shows the total, daytime, and nighttime average air temperatures for the three weather conditions for each month and for the entire summer season, as well as the percent differences in these temperatures. In all summer months, the UHI effect is anyway more relevant in case A than in case B. At the seasonal level, the percent increase in urban temperature in case A reaches 6% compared to that in rural temperature. In case B, this value is 3.8%. Thus, the SWHP option allows for a 36% reduction in this increase. Figure 9B shows the corresponding UHI intensities. In all months, the UHI effect depends strongly on the time of day. At the seasonal level, the average UHI related to the whole day is 1.0°C in case A and 0.6°C in case B. The same monthly and seasonal results for the winter period are shown in Figure 10. In winter, the UHI effect leads to an 11.6% increase in urban temperature compared to rural conditions. Of course, these percentage results also depend on the lower winter temperatures. The seasonal average UHI intensity is 1.1°C. The variability in monthly UHI intensities appears to be related to that of air temperatures and is therefore more pronounced in winter. In both seasons, the average monthly UHI effect is larger at night.
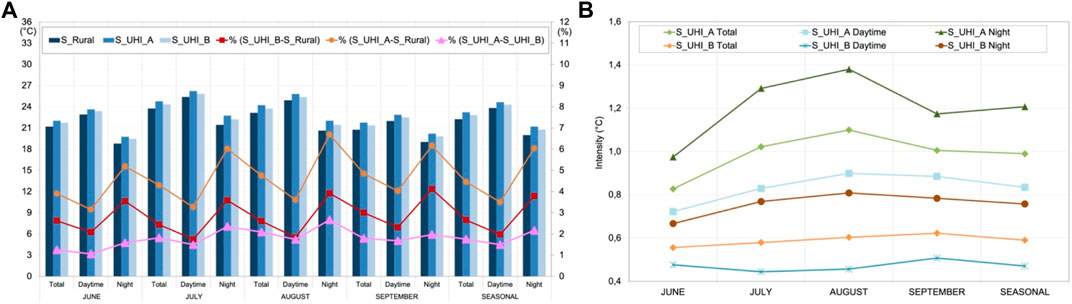
FIGURE 9. Monthly and seasonal average air temperatures of rural and urban weather in case UHI_1 or UHI_2 in the three daily periods and their percent differences (A) in winter. The corresponding UHI intensities are shown in panel (B).
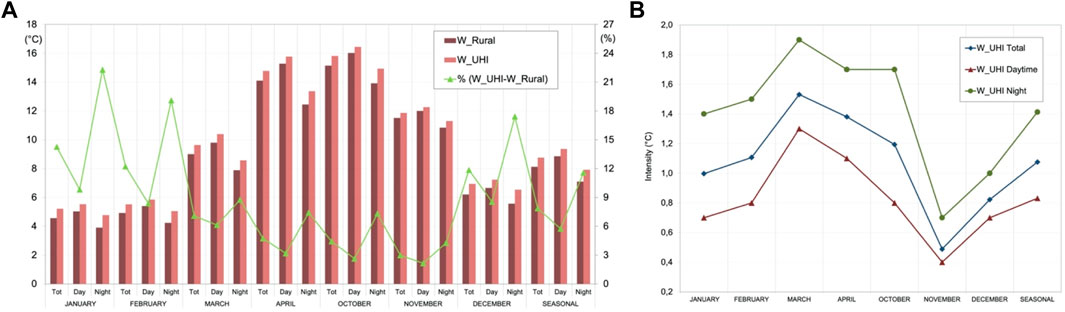
FIGURE 10. Monthly and seasonal average air temperatures of rural and urban weather in case UHI_1 or UHI_2 in the three daily periods and their percent differences (A) in summer. The corresponding UHI intensities are shown in panel (B).
There are a few studies in the literature on the UHI phenomenon that also quantify the effect of heat released from the air cooled chillers (Bueno Unzeta, 2010; Salvati et al., 2017). The results found here are consistent with these previous evaluations. Nevertheless, these works do not address the question of how to eliminate this urban heat gain. Instead, this research evaluates the UHI mitigation benefits of a precise technology proposed to remove this heat from an urban area.
Heat Pump Performance Simulation
Figure 11A shows a comparison of the seasonal cooling and heating demand calculated by EnergyPlus with weather data for rural and urban areas for each building type. The percentage differences are also presented. Due to the significant variation in relative volumes in the area, the demand rates vary greatly between types, with types 2 and 4 being the largest contributors. However, the UHI phenomenon has an evident effect on the increase in cooling demand for all building types in summer but with a significant difference in the case of weather conditions S_UHI_A or S_UHI_B. Specifically, the percentage increase in cooling demand in the case of S_UHI_A ranges from 16.3% to 18.8%. In the case of S_UHI_B, this increase range is reduced between 6.9% and 7.4%. For all the types, the differences between these two increases vary to a limited extent between 8.1% and 9.6%, which is probably also related to the different cooling requirements of each type. The response to the UHI effect appears to be virtually the same for all building types. As for the reduction in heating demand, the response to the UHI effect is also similar among the four building types, varying between 9.5% and 11.0%. Figure 11B shows the monthly cooling and heating demands of the whole analyzed area calculated with the rural weather file. In the same histograms, the increase of cooling in the summer months with the two urban weather patterns and the reduction of heating thanks to the urban weather in the winter months are numerically expressed as percentages. The high variability of rural demand, especially in winter, results in considerable variation in these percentage increases or decreases on a monthly basis. In summer, however, the monthly differences between S_UHI_A and S_UHI_B are quite regular, ranging from 3.8% to 13.0%. In Figures 11A,B, the table shows the seasonal demands in rural areas and the corresponding percentage differences from the requirements resulting from urban weather conditions. At the seasonal level, the increase in cooling demand due to S_UHI_A in relation to rural weather is 17.3%, while for S_UHI_B, it is 8.7%. Therefore, the increase in cooling demand is reduced by 49.7% thanks to the SWHP technology. As for the seasonal heating demand, the calculation with the urban file indicates a reduction of 9.4% compared to the use of the rural file.
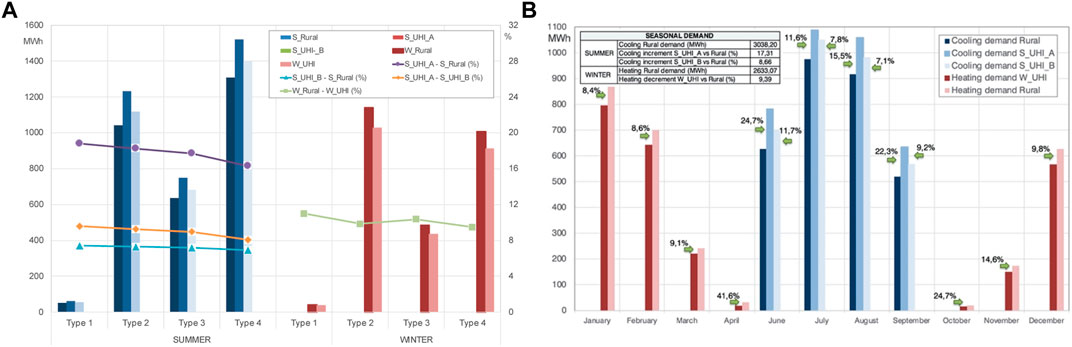
FIGURE 11. SSeasonal heating or cooling demand of all buildings of each type calculated by rural or urban weather and corresponding percent differences (A), total monthly and seasonal demand in rural weather, and corresponding changes in urban weather (B).
Figure 12A shows the monthly and seasonal averages of COPs relative to all SWHPs or ASHPs foreseen in the area. For SWHPs, these COPs, as well as the EERs that follow, also take into account the electrical absorption of pumping in the urban network and in the seawater loop. Due to careful control of the pumps, this electrical energy absorption is limited to 4.8% of the total annual electricity consumption of the SWHPs, with the same incidence on the corresponding electricity cost. On an annual basis, the electricity load of the seawater circuit including the filtration system is 32% of the total pumping consumption. The comparison highlights that the SWHPs perform best, especially in the coldest winter months, due to the more favorable thermal level of the sea compared to the outside air. However, the part load effect on COP is clearly observable. In the mid-season, the improvement in full-load performance due to the higher thermal level of the cold source of the HP is counterbalanced by the part load penalization due to the reduction in building demand and the increase in the actual HP full-load capacity. High part load levels severely degrade HP efficiency. For this reason, the impact of part load must always be considered in the HP performance evaluation. On a seasonal basis, the average COP is 3.14 for the ASHPs and 4.08 for the SWHPs with a percentage increase of 29.8%. The advantage of adopting the HP technology as an alternative to the use of condensing boilers is investigated at the seasonal level in terms of primary energy consumption. For this purpose, the official Italian factor (DM 26 giugno 2015, 2015) 2.42 is used to convert the electrical energy consumption of HP to the corresponding primary energy. For the condensing boiler with a return water temperature of 40°C, an average seasonal efficiency of 1.01 from the national standard (UNI/TS 11300:2, 2014) is assumed. Figure 12A reports the percentage primary energy savings achieved with the HPs compared to the use of condensing boilers. The monthly trends are affected by the variability of the corresponding COPs. In any case, the net benefit of the HP technology is always evident for both ASHPs and SWHPs, although it is larger and more stable for SWHPs. Another important comparison term is the CO2 emissions caused by the different heat generation systems. For the calculation of CO2 emissions, the official data of Italy were used (Ispra, 2019). Specifically, 0.308 kg of CO2 per electrical kWh consumed and 0.201 kg of CO2 per kWh of primary energy consumed by a natural gas boiler were assumed as equivalences. Figure 12A shows the monthly and seasonal reductions by ASHPs and SWHPs in terms of CO2 emissions compared to the case of a condensing boiler installation. At the seasonal level, ASHPs enable a reduction of 50.8%, while SWHPs achieve 62.4%. This remarkable result is the consequence of the different CO2 emission rates for natural gas and electric energy and the better performances of the HPs, especially in the case of the SWHPs.
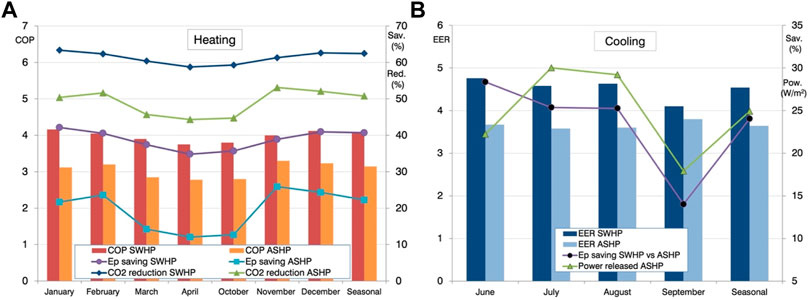
FIGURE 12. Monthly and seasonal COP/EER of HPs during heating season (A) or cooling season (B). In winter, both savings compared to using condensing boilers and CO2 reductions. In summer, the savings are with SWHPs compared to those with ASHPs. The average specific heat power released by ASHPs in the area is also given in panel (B).
Figure 12B shows the monthly and seasonal average EERs for all area HPs in cooling mode. Primary energy savings achieved by SWHPs compared to consumption with ASHPs are also reported. In all summer months, the comparison points out the best performance of SWHPs due to the more favorable thermal level of seawater than outdoor air for cooling the HP condensers. In fact, the trend of the seawater temperature is quite constant, while the outdoor air shows strong hourly variations, with the highest values during the air conditioning hours. The influence of part load is also evident in the EERs, but the fluctuations of the monthly trend are smaller in summer compared to those in winter months due to the smaller demand variations. The seasonal EERs are 3.63 and 4.54, respectively, with an increase of 24.6% for SWHPs. Lower cooling demand and better EER involve that the primary energy consumption for air conditioning is reduced thanks to SWHPs. On a seasonal level, this reduction is 24%. Since both ASHPs and SWHPs are electric-driven HPs, the percentage reduction in CO2 emissions thanks to the use of seawater is equivalent to the percentage energy savings. HP performance assessment in cooling mode also provides the thermal power dissipated by condensers and removed in different ways with the two HP technologies. Figure 12B shows the thermal power released to outdoor urban air from ASHPs in terms of the monthly specific power per unit urban area, with a seasonal average value of 24.9 W/m2. This high value underlines the importance of air conditioning systems in energy balances in terms of the UHI effect in the case of ASHPs. In the case of SWHPs, on the other hand, the relative condenser heat is removed from the urban area via the sea. As regards the thermal use of water from surface aquifers, the strict limitations of the above-mentioned national legislation were introduced to protect the outdoor environment. In particular, the maximum temperature difference of only 3°C between the water withdrawal and the return reduces the thermal stress, also considering possible problems for flora and fauna. In addition, in the case of the sea, the large thermal inertia, wave motion, and sea currents further contribute to eliminate the risks associated with the increase in water temperature. However, since the application of the SWHP technology in coastal areas is still at the beginning, there are no studies yet on its impact on the marine environment. In addition to performance monitoring, investigations on this topic are absolutely recommended. At the urban level, the possible negative impacts become negligible compared to the consequences of the total heat emission of the ASHPs in the immediate vicinity of the buildings.
The performance outcomes remedy the lack of studies on this technology. Indeed, a few 5GDHC systems are currently coupled with the use of seawater and little information is available (Buffa et al., 2019; Caputo et al., 2021). On the other hand, the current state of the literature focuses on the youth of the 5GDHC technology. Reviews on this topic emphasize the need for further development of design and simulation tools based on their application to real-case studies (Abugabbara et al., 2020; Lindhe et al., 2022).
Discussion
This article addresses the environmental benefits of implementing a 5GDHC network in a coastal city using seawater as a heat source/sink as part of a retrofit action. Starting from the assessment of the UHI effect in the investigated area, the analysis highlights the deterioration of the UHI effect caused by the heat released by the traditional air conditioning systems in the urban area in summer, as well as the change in the urban climate in winter.
A first conclusion from the results is that building load simulations in urban areas should be performed considering the UHI phenomenon, instead of simply using rural weather data. However, the proposed technical solution is able to carry away from the city the heat dissipated by the chiller condensers. In this way, the results show a significant mitigation of the UHI effect in summer. Therefore, this option to mitigate the UHI effect can help to increase the resilience of cities, and the prediction of the future climate change scenario indicates that the potential benefits will increase during extreme events such as urban heat waves. Another fundamental study concerned the consequences of the introduction of the HP technology and the more favorable thermal level of seawater compared to outdoor air. For this purpose, during the heating season, the performance comparison has concerned not only the ASHPs and SWHPs but also the installation of condensing boilers as a possible alternative in the retrofit action. The findings show that the HP technology is superior in both increasing energy performance and reducing CO2 emissions. However, the SWHP solution offers significantly better performance than the ASHP in both summer and winter. In terms of CO2 emissions, even in summer, the savings in electricity consumption due to air conditioning in urban areas show a non-negligible overall reduction in CO2 emissions. Indeed, the greenhouse gas footprint includes not only direct emissions in urban areas but also upstream emissions to produce goods and services for urban consumers. The main obstacle to the implementation of SWHP compared to other retrofit measures, and in particular to traditional urban heating/cooling networks, is the presence of a seawater access at an acceptable distance from the intervention area. This condition may limit the possibility of the expanded use of SWHP even in coastal areas. On the other hand, the availability of seawater provides the possibility to foster the benefits of including 5GDHC networks into retrofit actions to support current efforts to increase decarbonization and environmental resilience in urban areas.
Data Availability Statement
The raw data supporting the conclusion of this article will be made available by the authors without undue reservation.
Author Contributions
LS: conceptualization, methodology, writing—original draft preparation, and supervision. CT: data curation, methodology, software, investigation, writing—original draft preparation, and writing—review and editing. AB: investigation and writing.
Conflict of Interest
The authors declare that the research was conducted in the absence of any commercial or financial relationships that could be construed as a potential conflict of interest.
Publisher’s Note
All claims expressed in this article are solely those of the authors and do not necessarily represent those of their affiliated organizations, or those of the publisher, the editors, and the reviewers. Any product that may be evaluated in this article, or claim that may be made by its manufacturer, is not guaranteed or endorsed by the publisher.
References
Abbasi, M. H., Abdullah, B., Ahmad, M. W., Rostami, A., and Cullen, J. (2021). Heat Transition in the European Building Sector: Overview of the Heat Decarbonisation Practices through Heat Pump Technology. Sustain. Energy Technol. Assessments 48, 101630. doi:10.1016/j.seta.2021.101630
Abugabbara, M., Javed, S., Bagge, H., and Johansson, D. (2020). Bibliographic Analysis of the Recent Advancements in Modeling and Co-simulating the Fifth-Generation District Heating and Cooling Systems. Energy Build. 224, 110260. doi:10.1016/j.enbuild.2020.110260
Aram, F., Higueras García, E., Solgi, E., and Mansournia, S. (2019). Urban Green Space Cooling Effect in Cities. Heliyon 5, e01339. doi:10.1016/j.heliyon.2019.e01339
Author Anonymous (2020). EU H2020 FLEXYNETS Project. Available online ⟨ https://www.flexynets.eu.⟩
Author Anonymous (1999). National Law Provisions on the Protection of the Waters from Pollution ‘Disposizioni Sulla Tutela Delle Acque Dall’inquinamento. Dlgs. N. 152, 11. Italy.
Baik, Y.-J., Kim, M., Chang, K.-C., Lee, Y.-S., and Ra, H.-S. (2014). Potential to Enhance Performance of Seawater-Source Heat Pump by Series Operation. Renew. Energy 65, 236–244. doi:10.1016/j.renene.2013.09.021
Bevilacqua, P., Bruno, R., and Arcuri, N. (2020). Green Roofs in a Mediterranean Climate: Energy Performances Based on In-Situ Experimental Data. Renew. Energy 152, 1414–1430. doi:10.1016/j.renene.2020.01.085
Bisegna, F., Buggin, A., Peri, G., Rizzo, G., Scaccianoce, G., Scarpa, M., et al. (20192019). “Computing Methods for Resilience: Evaluating New Building Components in the Frame of SECAPs,” in Proceedings - 2019 IEEE International Conference on Environment and Electrical Engineering and 2019 IEEE Industrial and Commercial Power Systems Europe. EEEIC/I and CPS Europe. doi:10.1109/EEEIC.2019.8783458
Boccalatte, A., Fossa, M., Gaillard, L., and Menezo, C. (2020). Microclimate and Urban Morphology Effects on Building Energy Demand in Different European Cities. Energy Build. 224, 110129. doi:10.1016/j.enbuild.2020.110129
Bueno, B., Norford, L., Hidalgo, J., and Pigeon, G. (2013). The Urban Weather Generator. J. Build. Perform. Simul. 6, 269–281. doi:10.1080/19401493.2012.718797
Bueno Unzeta, B. (2010). An Urban Weather Generator Coupling a Building, Simulation Program with an Urban Canopy Model. Thesis-Massachusetts Institute of Technology.
Buffa, S., Cozzini, M., D’Antoni, M., Baratieri, M., and Fedrizzi, R. (2019). 5th Generation District Heating and Cooling Systems: A Review of Existing Cases in Europe. Renew. Sustain. Energy Rev. 104, 504–522. doi:10.1016/j.rser.2018.12.059
Caputo, P., Ferla, G., Belliardi, M., and Cereghetti, N. (2021). District Thermal Systems: State of the Art and Promising Evolutive Scenarios. A Focus on Italy and Switzerland. Sustain. Cities Soc. 65, 102579. doi:10.1016/j.scs.2020.102579
Castellani, B., Morini, E., Anderini, E., Filipponi, M., and Rossi, F. (2017). Development and Characterization of Retro-Reflective Colored Tiles for Advanced Building Skins. Energy Build. 154, 513–522. doi:10.1016/j.enbuild.2017.08.078
CEN (2018). EN 14825:2018 Air Conditioners, Liquid Chilling Packages and Heat Pumps, with Electrically Driven, Compressors, for Space Heating and Cooling - Testing and Rating at Part Load Conditions and Calculation of Seasonal Performance.
Chen, S., Friedrich, D., and Yu, Z. (2021). Optimal Sizing of a Grid Independent Renewable Heating System for Building Decarbonisation. Front. Energy Res. 9. doi:10.3389/fenrg.2021.746268
Chen, X., Zhang, G., Peng, J., Lin, X., and Liu, T. (2006). The Performance of an Open-Loop Lake Water Heat Pump System in South China. Appl. Therm. Eng. 26, 2255–2261. doi:10.1016/j.applthermaleng.2006.03.009
Cui, Y., Yan, D., Hong, T., and Ma, J. (2017). Temporal and Spatial Characteristics of the Urban Heat Island in Beijing and the Impact on Building Design and Energy Performance. Energy 130, 286–297. doi:10.1016/j.energy.2017.04.053
DM 26 giugno 2015 (2015). Applicazione delle metodologie di calcolo delle prestazioni energetiche e definizione delle prescrizioni e dei requisiti minimi degli edifici.
Doan, V. Q., Kusaka, H., and Nguyen, T. M. (2019). Roles of Past, Present, and Future Land Use and Anthropogenic Heat Release Changes on Urban Heat Island Effects in Hanoi, Vietnam: Numerical Experiments with a Regional Climate Model. Sustain. Cities Soc. 47, 101479. doi:10.1016/j.scs.2019.101479
Dongellini, M., Naldi, C., and Morini, G. L. (2015). Seasonal Performance Evaluation of Electric Air-To-Water Heat Pump Systems. Appl. Therm. Eng. 90, 1072–1081. doi:10.1016/j.applthermaleng.2015.03.026
Duan, S., Luo, Z., Yang, X., and Li, Y. (2019). The Impact of Building Operations on Urban Heat/cool Islands under Urban Densification: A Comparison between Naturally-Ventilated and Air-Conditioned Buildings. Appl. Energy 235, 129–138. doi:10.1016/j.apenergy.2018.10.108
CEN (2019). Air Conditioners, Liquid Chilling Packages and Heat Pumps for Space Heating and Cooling and Process Chillers, with Electrically Driven Compressors Part 3. Tests Methods.
Ferrando, M., Hong, T., and Causone, F. (2021). A Simulation-Based Assessment of Technologies to Reduce Heat Emissions from Buildings. Build. Environ. 195, 107772. doi:10.1016/j.buildenv.2021.107772
Foster, S., Love, J., Walker, I., and Crane, M. (2016). Heat Pumps in District Heating: Case Studies. LondonUK Government: Department of Energy & Climate Change.
Guattari, C., Evangelisti, L., and Balaras, C. A. (2018). On the Assessment of Urban Heat Island Phenomenon and its Effects on Building Energy Performance: A Case Study of Rome (Italy). Energy Build. 158, 605–615. doi:10.1016/j.enbuild.2017.10.050
Hong, T., Xu, Y., Sun, K., Zhang, W., Luo, X., and Hooper, B. (2021). Urban Microclimate and its Impact on Building Performance: A Case Study of San Francisco. Urban Clim. 38, 100871. doi:10.1016/j.uclim.2021.100871
In, S., Cho, K., Lim, B., and Lee, C. (2015). Partial Load Performance Test of Residential Heat Pump System with Low-GWP Refrigerants. Appl. Therm. Eng. doi:10.1016/j.applthermaleng.2015.04.013
Ispra (2019). Greenhouse Gas Emission Factors in the National Electricity Sector and in the Main European Countries. report 303.
Jain, R., Luo, X., Sever, G., Hong, T., and Catlett, C. (2020). Representation and Evolution of Urban Weather Boundary Conditions in Downtown Chicago. J. Build. Perform. Simul. 13, 182–194. doi:10.1080/19401493.2018.1534275
Lauzet, N., Rodler, A., Musy, M., Azam, M.-H., Guernouti, S., Mauree, D., et al. (2019). How Building Energy Models Take the Local Climate into Account in an Urban Context - A Review. Renew. Sustain. Energy Rev. 116, 109390. doi:10.1016/j.rser.2019.109390
Li, X.-l., Duanmu, L., and Shu, H.-w. (2010). Optimal Design of District Heating and Cooling Pipe Network of Seawater-Source Heat Pump. Energy Build. 42, 100–104. doi:10.1016/j.enbuild.2009.07.016
Li, X., Zhou, Y., Yu, S., Jia, G., Li, H., and Li, W. (2019). Urban Heat Island Impacts on Building Energy Consumption: A Review of Approaches and Findings. Energy 174, 407–419. doi:10.1016/j.energy.2019.02.183
Liang, J., Yang, Q., Liu, L., and Li, X. (2011). Modeling and Performance Evaluation of Shallow Ground Water Heat Pumps in Beijing Plain, China. Energy Build. 43, 3131–3138. doi:10.1016/j.enbuild.2011.08.007
Lima, I., Scalco, V., and Lamberts, R. (2019). Estimating the Impact of Urban Densification on High-Rise Office Building Cooling Loads in a Hot and Humid Climate. Energy Build. 182, 30–44. doi:10.1016/j.enbuild.2018.10.019
Lindhe, J., Javed, S., Johansson, D., and Bagge, H. (2022). A Review of the Current Status and Development of 5GDHC and Characterization of a Novel Shared Energy System. Sci. Technol. Built Environ. 0, 1–15. doi:10.1080/23744731.2022.2057111
Liu, Y., Li, Q., Yang, L., Mu, K., Zhang, M., and Liu, J. (2020). Urban Heat Island Effects of Various Urban Morphologies under Regional Climate Conditions. Sci. Total Environ. 743, 140589. doi:10.1016/j.scitotenv.2020.140589
Lund, H., Østergaard, P. A., Connolly, D., and Mathiesen, B. V. (2017). Smart Energy and Smart Energy Systems. Energy 137, 556–565. doi:10.1016/j.energy.2017.05.123
Lund, H., Werner, S., Wiltshire, R., Svendsen, S., Thorsen, J. E., Hvelplund, F., et al. (2014). 4th Generation District Heating (4GDH). Energy 68, 1–11. doi:10.1016/j.energy.2014.02.089
Luo, X., Vahmani, P., Hong, T., and Jones, A. (2020). City-scale Building Anthropogenic Heating during Heat Waves. Atmosphere 11, 1206. doi:10.3390/atmos11111206
Luo, Z., and Asproudi, C. (2015). Subsurface Urban Heat Island and its Effects on Horizontal Ground-Source Heat Pump Potential under Climate Change. Appl. Therm. Eng. 90, 530–537. doi:10.1016/j.applthermaleng.2015.07.025
MacLachlan, A., Biggs, E., Roberts, G., and Boruff, B. (2021). Sustainable City Planning: A Data-Driven Approach for Mitigating Urban Heat. Front. Built Environ. 6. doi:10.3389/fbuil.2020.519599
Manoli, G., Fatichi, S., Schläpfer, M., Yu, K., Crowther, T. W., Meili, N., et al. (2019). Magnitude of Urban Heat Islands Largely Explained by Climate and Population. Nature 573, 55–60. doi:10.1038/s41586-019-1512-9
Mao, J., Fu, Y., Afshari, A., Armstrong, P. R., and Norford, L. K. (2018). Optimization-aided Calibration of an Urban Microclimate Model under Uncertainty. Build. Environ. 143, 390–403. doi:10.1016/j.buildenv.2018.07.034
Mao, J., Yang, J. H., Afshari, A., and Norford, L. K. (2017). Global Sensitivity Analysis of an Urban Microclimate System under Uncertainty: Design and Case Study. Build. Environ. 124, 153–170. doi:10.1016/j.buildenv.2017.08.011
Marinhas, S. (2013). Eurovent Chiller Certification Key Stones and Future Challenges. REHVA J., 31–33.
Martin-Vide, J., Sarricolea, P., and Moreno-GarcÃa, M. C. (2015). On the Definition of Urban Heat Island Intensity: the €œrural†Reference. Front. Earth Sci. 3. doi:10.3389/feart.2015.00024
Martinez, S., Machard, A., Pellegrino, A., Touili, K., Servant, L., and Bozonnet, E. (2021). A Practical Approach to the Evaluation of Local Urban Overheating- A Coastal City Case-Study. Energy Build. 253, 111522. doi:10.1016/j.enbuild.2021.111522
Mei, S.-J., and Yuan, C. (2021). Analytical and Numerical Study on Transient Urban Street Air Warming Induced by Anthropogenic Heat Emission. Energy Build. 231, 110613. doi:10.1016/j.enbuild.2020.110613
MISE (2015). national decree, Requisiti tecnici per l’accesso alle detrazioni fiscali per la riqualificazione energetica degli edifici, annex E. Ministry of Economic Development. 6 August 2020.
MIT (2014). Urban Weather Generator. Available at: http://urbanmicroclimate.scripts.mit.edu/uwg.php.
Morini, E., Castellani, B., Presciutti, A., Anderini, E., Filipponi, M., Nicolini, A., et al. (2017). Experimental Analysis of the Effect of Geometry and Façade Materials on Urban District's Equivalent Albedo. Sustainability 9, 1245. doi:10.3390/su9071245
Mosteiro-Romero, M., Maiullari, D., Pijpers-van Esch, M., and Schlueter, A. (2020). An Integrated Microclimate-Energy Demand Simulation Method for the Assessment of Urban Districts. Front. Built Environ. 6. doi:10.3389/fbuil.2020.553946
Nakano, A., Bueno, B., Norford, L., and Reinhart, C. F. (2015). “Urban Weather Generator - A Novel Workflow for Integrating Urban Heat Island Effect within Urban Design Process,” in 14th International Conference of IBPSA - Building Simulation 2015, BS 2015, Conference Proceedings.
Nam, Y., and Ooka, R. (2010). Numerical Simulation of Ground Heat and Water Transfer for Groundwater Heat Pump System Based on Real-Scale Experiment. Energy Build. 42, 69–75. doi:10.1016/j.enbuild.2009.07.012
Palme, M., Inostroza, L., Villacreses, G., Lobato-Cordero, A., and Carrasco, C. (2017). From Urban Climate to Energy Consumption. Enhancing Building Performance Simulation by Including the Urban Heat Island Effect. Energy Build. 145, 107–120. doi:10.1016/j.enbuild.2017.03.069
Pattijn, I. P., and Baumans, A. (2017). Fifth-generation Thermal Grids and Heat Pumps: A Pilot Project in Leuven, Belgium. HPT Mag.
Prasanna, A., Dorer, V., and Vetterli, N. (2017). Optimisation of a District Energy System with a Low Temperature Network. Energy 137, 632–648. doi:10.1016/j.energy.2017.03.137
Reiners, T., Gross, M., Altieri, L., Wagner, H.-J., and Bertsch, V. (2021). Heat Pump Efficiency in Fifth Generation Ultra-low Temperature District Heating Networks Using a Wastewater Heat Source. Energy 236, 121318. doi:10.1016/j.energy.2021.121318
Sailor, D. J., and Fan, H. (2004). The Importance of Including Anthropogenic Heating in Mesoscale Modeling of the Urban Heat Island. Bulletin of the American Meteorological Society.
Salvati, A., Monti, P., Coch Roura, H., and Cecere, C. (2019). Climatic Performance of Urban Textures: Analysis Tools for a Mediterranean Urban Context. Energy Build. 185, 162–179. doi:10.1016/j.enbuild.2018.12.024
Salvati, A., Palme, M., and Inostroza, L. (2017). Key Parameters for Urban Heat Island Assessment in A Mediterranean Context: A Sensitivity Analysis Using the Urban Weather Generator Model. IOP Conf. Ser. Mat. Sci. Eng. 245, 082055. doi:10.1088/1757-899X/245/8/082055
Santamouris, M. (2007). Heat Island Research in Europe: The State of the Art. Adv. Build. Energy Res. 1, 123–150. doi:10.1080/17512549.2007.9687272
Santamouris, M. (2014). On the Energy Impact of Urban Heat Island and Global Warming on Buildings. Energy Build. 82, 100–113. doi:10.1016/j.enbuild.2014.07.022
Santos, L. G. R., Afshari, A., Norford, L. K., and Mao, J. (2018). Evaluating Approaches for District-wide Energy Model Calibration Considering the Urban Heat Island Effect. Appl. Energy 215, 31–40. doi:10.1016/j.apenergy.2018.01.089
Sarbu, I., and Sebarchievici, C. (2014). General Review of Ground-Source Heat Pump Systems for Heating and Cooling of Buildings. Energy Build. 70, 441–454. doi:10.1016/j.enbuild.2013.11.068
Schibuola, L. (2000). Heat Pump Seasonal Performance Evaluation: A Proposal for a European Standard. Appl. Therm. Eng. doi:10.1016/S1359-4311(99)00041-1
Schibuola, L., Scarpa, M., and Tambani, C. (2015). Demand Response Management by Means of Heat Pumps Controlled via Real Time Pricing. Energy Build. 90, 15–28. doi:10.1016/j.enbuild.2014.12.047
Schibuola, L., Scarpa, M., and Tambani, C. (2018). Innovative Technologies for Energy Retrofit of Historic Buildings: An Experimental Validation. J. Cult. Herit. 30, 147–154. doi:10.1016/J.CULHER.2017.09.011
Schibuola, L., Scarpa, M., and Tambani, C. (2013a). “Modelling of HVAC System Components for Building Dynamic Simulation,” in Proceedings of BS 2013: 13th Conference of the International Building Performance Simulation Association.
Schibuola, L., Scarpa, M., and Tambani, C. (2016). Parametric Study on the Financial Performance of Battery-Supported Photovoltaic Systems Connected to Smart Grids in Current and Future Market Scenarios. Sci. Technol. Built Environ. 22, 751–765. doi:10.1080/23744731.2016.1197717
Schibuola, L., and Tambani, C. (2022). Environmental Impact and Energy Performance of Groundwater Heat Pumps in Urban Retrofit. Energy Build. 261, 111964. doi:10.1016/j.enbuild.2022.111964
Schibuola, L., and Tambani, C. (2020). Performance Assessment of Seawater Cooled Chillers to Mitigate Urban Heat Island. Appl. Therm. Eng. 175, 115390. doi:10.1016/j.applthermaleng.2020.115390
Schibuola, L., and Tambani, C. (2012). Renewable Energy Sources for Historic Buildings: The Crucifers Convent in Venice. WIT Trans. Ecol. Environ. 165. doi:10.2495/ARC120301
Schibuola, L., Tambani, C., Zarrella, A., and Scarpa, M. (2013b). Ground Source Heat Pump Performance in Case of High Humidity Soil and Yearly Balanced Heat Transfer. Energy Convers. Manag. 76, 956–970. doi:10.1016/j.enconman.2013.09.002
Shi, L., Luo, Z., Matthews, W., Wang, Z., Li, Y., and Liu, J. (2019). Impacts of Urban Microclimate on Summertime Sensible and Latent Energy Demand for Cooling in Residential Buildings of Hong Kong. Energy 189, 116208. doi:10.1016/j.energy.2019.116208
Smith, C., Lindley, S., and Levermore, G. (2009). Estimating Spatial and Temporal Patterns of Urban Anthropogenic Heat Fluxes for UK Cities: The Case of Manchester. Theor. Appl. Climatol. 98, 19–35. doi:10.1007/s00704-008-0086-5
Song, Y.-h., Akashi, Y., and Yee, J.-J. (2007). Effects of Utilizing Seawater as a Cooling Source System in a Commercial Complex. Energy Build. 39, 1080–1087. doi:10.1016/j.enbuild.2006.11.011
Stene, J., and Eggen, G. (1995). Heat Pump System with Distribution at Intermediate Temperature at the University of Bergen. Norway.
Street, M., Reinhart, C., Norford, L., and Ochsendorf, J. (2013). “Urban Heat Island in Boston - an Evaluation of Urban Airtemperature Models for Predicting Building Energy Use,” in n.Proceedings of BS 2013: 13th Conference of the International Building Performance Simulation Associatio
Sun, R., Wang, Y., and Chen, L. (2018). A Distributed Model for Quantifying Temporal-Spatial Patterns of Anthropogenic Heat Based on Energy Consumption. J. Clean. Prod. 170, 601–609. doi:10.1016/j.jclepro.2017.09.153
Swan, L. G., and Ugursal, V. I. (2009). Modeling of End-Use Energy Consumption in the Residential Sector: A Review of Modeling Techniques. Renew. Sustain. Energy Rev. 13, 1819–1835. doi:10.1016/j.rser.2008.09.033
U.S. Department of Energy (2019b). EnergyPlus. Available at: https://energyplus.net/.
U.S. Department of Energy (2019a). EnergyPlus Version 9.2.0, Documentation- Auxiliary Programs. https://energyplus.net/sites/all/modules/custom/ nrel_custom/pdfs/pdfs_v9.2.0/AuxiliaryPrograms.pdf.
Verhoeven, R., Willems, E., Harcouët-Menou, V., De Boever, E., Hiddes, L., Veld, P. O. t., et al. (2014). Minewater 2.0 Project in Heerlen the Netherlands: Transformation of a Geothermal Mine Water Pilot Project into a Full Scale Hybrid Sustainable Energy Infrastructure for Heating and Cooling. Energy Procedia 46, 58–67. Energy Procedia. doi:10.1016/j.egypro.2014.01.158
Wen, Y., and Lian, Z. (2009). Influence of Air Conditioners Utilization on Urban Thermal Environment. Appl. Therm. Eng. 29, 670–675. doi:10.1016/j.applthermaleng.2008.03.039
Wheatcroft, E., Wynn, H., Lygnerud, K., Bonvicini, G., and Leonte, D. (2020). The Role of Low Temperature Waste Heat Recovery in Achieving 2050 Goals: A Policy Positioning Paper. Energies 13, 2107. doi:10.3390/en13082107
Yang, X., Hu, M., Heeren, N., Zhang, C., Verhagen, T., Tukker, A., et al. (2020a). A Combined GIS-Archetype Approach to Model Residential Space Heating Energy: A Case Study for the Netherlands Including Validation. Appl. Energy 280, 115953. doi:10.1016/j.apenergy.2020.115953
Yang, X., Peng, L. L. H., Jiang, Z., Chen, Y., Yao, L., He, Y., et al. (2020b). Impact of Urban Heat Island on Energy Demand in Buildings: Local Climate Zones in Nanjing. Appl. Energy 260, 114279. doi:10.1016/j.apenergy.2019.114279
Yang, X., Yao, L., Peng, L. L. H., Jiang, Z., Jin, T., and Zhao, L. (2019). Evaluation of a Diagnostic Equation for the Daily Maximum Urban Heat Island Intensity and its Application to Building Energy Simulations. Energy Build. 193, 160–173. doi:10.1016/j.enbuild.2019.04.001
Keywords: seawater heat pump, 5GDHC network, urban heat island mitigation, anthropogenic heat, decarbonization actions, city resilience, urban model
Citation: Schibuola L, Tambani C and Buggin A (2022) Seawater Opportunities to Increase Heating, Ventilation, and Air Conditioning System Efficiency in Buildings and Urban Resilience. Front. Energy Res. 10:913411. doi: 10.3389/fenrg.2022.913411
Received: 05 April 2022; Accepted: 24 May 2022;
Published: 01 July 2022.
Edited by:
Riccardo Maria Pulselli, University of Florence, ItalyReviewed by:
Carla Balocco, University of Florence, ItalyHanan Al-Khatri, Sultan Qaboos University, Oman
Copyright © 2022 Schibuola, Tambani and Buggin. This is an open-access article distributed under the terms of the Creative Commons Attribution License (CC BY). The use, distribution or reproduction in other forums is permitted, provided the original author(s) and the copyright owner(s) are credited and that the original publication in this journal is cited, in accordance with accepted academic practice. No use, distribution or reproduction is permitted which does not comply with these terms.
*Correspondence: Chiara Tambani, dGFtYmFuaUBpdWF2Lml0