 Zhang Haohao
 Jia Zhenzhen
 Ye Qing
- School of Resource, Environment and Safety Engineering, Hunan University of Science and Technology, Xiangtan, China
In order to investigate the influence of initial pressures on the propagation characteristics of gas explosion in roadway, the physical model of gas explosion under different initial pressures in roadway is established by the fluid-structure interaction algorithm of ANSYS/LS-DYNA. The pressure of shock wave, the rise rate of pressure and the flame propagation velocity are analyzed when the initial pressure is 0.08, 0.09, 0.10, 0.11, and 0.12 MPa, respectively. The results reveal that the maximum pressure of shock wave at the same position in the roadway increases significantly with the increase of initial pressure, which presents a quadratic function relationship. The time to reach the maximum pressure of shock wave is extended comparatively. In addition, the maximum rise rate of shock wave pressure increases with the increase of the initial pressure, which means that the explosion hazard increases. The flame propagation velocity in the roadway decreases linearly with the increase of initial pressure. When the initial pressure increases by 0.01 MPa, the flame propagation speed will decrease by 2.6%.
1 Introduction
Coal is widely used as a raw material for various industries. The exploitation and utilization of coal resources promotes economic development, but methane associated with coal also brings serious hidden dangers to the safe production of coal mines. The main component of mine gas is methane, which is usually regarded as the mine gas. The major dynamic disasters caused by gas explosions in coal mine not only cause huge economic loss but also affect the social contribution of coal industry production (Yu et al., 2020). Gas explosion in coal mines is a series of rapid oxidation reactions caused by an explosive mixture of methane and air under the excitation of an ignition source. The research on the propagation characteristics of gas explosion by scholars mainly focused on propagation laws, failure characteristics and influence factors, such as the explosion limits (Pio and Salzano, 2019; Huang et al., 2019a), explosion overpressure (Ye et al., 2012; Wang et al., 2020), pressure rise rate (Zhu et al., 2020), and explosion flame (Zheng K. et al., 2018; Razus et al., 2010). The explosion limits of combustible gases mixed with air are constants under certain conditions. But with the change of environmental conditions, the parameters of mixed gases and ignition types, the explosion limits are different (Li et al., 2011). The effect of pressure rise on the explosion limits of methane-air mixtures was experimentally investigated, which found that the lower explosion limit of methane decreased slightly at elevated pressures (Huang et al., 2019b). The maximum explosion pressure and the maximum rise rate of pressure are the essential safety parameters to describe the effect of the explosion (Mitu and Brandes, 2015). It was found that in explosions of quiescent mixtures, the maximum rise rate of pressure was linear functions of total initial pressure, at constant initial temperature and fuel/oxygen ratio (Razus et al., 2007). According to the finite element analysis on the combustion flame of premixed fuel and air, the increase of premixed degree would significantly improve the combustion reactivity of the mixture and make the flame move to the boundary layer (Al-Malki, 2013).
The mechanism of the gas explosion is the result of the combined action of the thermal explosion mechanism and the chain reaction mechanism (Ye et al., 2013). Because many transient and intermediate products are produced in the development process of the explosion, the explosion process is easily affected by external factors. At present, the influencing factors of gas explosion were studied by the experimental methods (Ye and Jia, 2014; Ye et al., 2017a), numerical simulation (Yang et al., 2020; Liu et al., 2022), and theoretical calculation (Cheng et al., 2017; Cheng et al., 2021). In general, the influencing factors of gas explosions are divided into two types: internal influencing factors and external influencing factors. Internal factors include gas concentration, initial pressure, initial temperature, and ignition source, while external factors include the obstacles and coal dust in the roadway, the construction form of the roadway, and the size of the roadway, etc. The increase of methane concentration causes a linear increase of the maximum overpressure ratio, and the methane volume and concentration both have a sensitive effect on the maximum overpressure ratio and average overpressure rising rate (Gao et al., 2021). When a gas explosion occurs in a confined space, the peak overpressure caused by methane gas at stoichiometric concentration is maximum (Li et al., 2021). The peak overpressure, the maximum rise rate of pressure and the deflagration index of combustible gas mixture increases with the increase of initial pressure (Wang et al., 2019). The overpressure evolution laws of methane explosion in transversal pipe networks were experimentally studied, which indicated that an overpressure rising region would be formed in the transversal branch (Niu et al., 2019). Before the attenuation of the shock wave, the increase of the initial temperature raises the maximum explosion temperature, but decreases the peak overpressure, the maximum combustion rate, and the maximum gas velocity. However, the increase of the initial pressure raises the peak overpressure and the maximum combustion rate (Jiang et al., 2012; Liu et al., 2021). Both the combustion duration and the flame development duration increase with the increase of the initial pressure and decrease with the increase of the initial temperature (Cui et al., 2022). The influence of ignition position on the overpressure characteristics of premixed methane-air deflagration flame propagating in the pipe is significant (Cheng and Wei 2014; Cheng et al., 2019). The mode of pressure development depends on the ignition position, which significantly affects the evolution of the flame structure (Yang et al., 2021). When a gas explosion occurs in the roadway of the coal mine, transportation equipment and ventilation equipment are regarded as the most common obstacles, which can accelerate the growth of flame and overpressure and result in a more severe explosion disaster (Wang et al., 2022). In addition, the shape, number, position, and blocking ratio of the obstacles have different influences on the gas explosion characteristics (Zheng L. et al., 2018; Luo et al., 2021). The development velocity and turbulence intensity of gas explosion shock wave in a closed pipe with different sizes and different cross sectional shapes decreases with the increase of pipeline diameter (Gao et al., 2015). It is crucial to predict and measure the risk of coal mine production scientifically for preventing gas explosion accidents and implementing mine rescue strategies (Ye et al., 2017b).
In summary, the initial pressure, initial concentration, initial temperature, the shape and location of the obstacle, and the position and energy of the ignition source are the important factors affecting the explosion characteristics. However, the current research on the propagation characteristics of gas explosions is basically based on the standard atmosphere pressure. There are few studies on gas explosion and its propagation characteristics when the initial pressure fluctuates around standard atmospheric pressure. With the intensification of the supply and demand relationship of coal resources, the coal mining extended from ordinary depth coal mines to the plateau coal mines and deep coal mines. However, the different mining depths of the coal mine will cause the atmospheric pressure in the mine roadway to increase (deep mining) or decrease (plateau mining), which result that the atmospheric pressure in the mine being higher or lower than the standard atmospheric pressure. Different ventilation methods in the coal mine (forced ventilation or extraction ventilation) also cause the atmospheric pressure in the coal roadway to fluctuate around the standard pressure. Therefore, it is necessary to study the influence of different initial pressures on gas explosion and its propagation characteristics, the results can enrich explosion theory and guide the safety production of plateau mining and deep mining.
2 Establishmtne of gas explosion calculation model
2.1 Mathematical model
2.1.1 Basic assumptions
The gas explosion is an extremely rapid chemical reaction process that produces many instantaneous and intermediate products during the explosion. In order to carry out a reasonable and effective numerical calculation, it is assumed that:
1) The gas explosion is a single-step reaction process, and the intermediate products in the explosion process are ignored.
2) The gas in the roadway is evenly mixed with methane and air.
3) There is only a gas explosion heat source in the roadway.
4) The wall is smooth and adiabatic. The heat exchange between the wall and the surrounding environment is not considered, and the explosion energy absorbed by the plastic deformation of the wall is ignored.
2.1.2 Basic governing equations
The shock wave of gas explosion in the roadway propagates in the confined space, which satisfies the mass conservation equation, energy conservation equation, momentum conservation equation, and state equation in the Cartesian coordinate system.
Mass conservation equation:
Energy conservation equation:
Momentum conservation equation:
State equation:
where
2.2 Physical model
2.2.1 Establishment of finite element model
According to the symmetry of the model, a 1/4 roadway gas explosion model is established. The size of the model is 8 m in length, 1 m in width, 2 m in height, and 1 m in the height of the arch. The concentration of premixed gas filled in the roadway is 9.5%, and the ignition position is located at 0.8 m in the left center. The physical model of the roadway is shown in Figure 1.
FIGURE 1. The physical model of roadway.
The model is established by 3D SOILD 164 solid element. The boundary conditions are set as follows: the XY plane and YZ plane are symmetrically constrained, and the other four planes are set as non-reflecting boundaries. The mesh division affects the accuracy of the numerical calculation, the finer the mesh division, the more accurate the calculation result. In this paper, the mesh is continuously refined during modeling to pursue higher accuracy. It is found that when the mesh size is below 0.04 m, the simulation results don’t change with the mesh refinement. Therefore, the mesh size is set as 0.04 m under the condition of weighing the calculation time and calculation accuracy. In the whole process of numerical simulation, the Euler mesh can keep the calculation accuracy unchanged in each iteration process, and the Lagrange mesh can accurately describe the motion of structural boundaries. ALE (Arbitrary Lagrange Euler) algorithm combines the advantages of Lagrange mesh and Euler mesh, and can realize dynamic analysis of fluid-structure interaction. Therefore, the Lagrange mesh is used for surrounding rock and the Euler mesh is used for gas to better simulate shock wave propagation and fluid flow process. The model made fluid mesh coincide with solid mesh via keyword *CONSTRAINED_LAGRANGE_IN_SOLID. The finite element model of the roadway after division is shown in Figure 2.

FIGURE 2. The finite element model of roadway.
2.2.2 Material model
The air material model is described by the *MAT_NULL material model and the *EOS_LINEAR_POLYNOMIAL linear polynomial equation of state. The linear polynomial equation of state is:
where P0 is initial pressure, Pa; μ is viscosity coefficient; C0∼C6 is the equation of state parameters; ρ0
The explosion material model adopts *MAT_HIGH_EXPLOSIVE_BURN. The equation of state is *EOS_JWL (Jones-Wilkins-Lee), which is related to the explosion pressure as:
where P is explosion pressure, Pa; V is relative volume, m3; E1 is initial internal energy density, kJ/m3; parameters A, B, R1, R2 and ω are the material parameters determined for the explosion test. The specific parameters of explosive materials are shown in Table 1.

TABLE 1. Explosive material parameters.
The surrounding rock material model adopts the nonlinear plastic material model *MAT_PLASTIC_KINEMATIC. The relationship between the yield strength of the surrounding rock and the loading strain rate is:
where σy is the yield strength, MPa;

TABLE 2. Surrounding rock material parameters.
2.3 Validation of the model
Hou et al. (2009) used horizontal pipes of different lengths to simulate gas explosion in coal mine roadways and analyzed the change of gas explosion pressure in the pipeline. A full-scale three-dimensional model of the experiment was established to verify the validity of the digital model. The schematic diagram of the verification model is shown in Figure 3. The pipe used in the verification model is 159 mm in diameter, 10 mm in wall thickness, 3.1 m in length, and filled with a 9.5% methane-air mixture. The four pressure measuring points are located at 0.28, 0.74, 1.24, and 1.75 m from the ignition point. The pressure and correlation error of each measuring point in the experiment and simulation are shown in Table 3. The comparison results show that the maximum error between the simulated value and experimental value of peak overpressure at each measuring point is 10.1%, and the minimum error is 8.06%. The reasons (such as, why the simulated value was higher than the experimental value) may be that the pipe is considered as smooth and adiabatic during numerical simulation, so the heat loss caused by the wall surface is ignored. The correlation errors between the simulation and experimental results are less than 11%. Therefore, the numerical model used in this study is reasonable and the simulation results are reliable.
FIGURE 3. Schematic diagram of verification model.
TABLE 3. Comparison between simulation and experiment at different measuring points.
2.4 Simulation scheme
The different ventilation methods (forced ventilation or extraction ventilation) and different mining depths (plateau coal mining or deep coal mining) in the coal mine cause the atmospheric pressure in the mine roadway to fluctuate around the standard atmospheric pressure. Therefore, the initial pressure of gas explosion is set as 0.08, 0.09, 0.10, 0.11, and 0.12 MPa in this paper to investigate the propagation characteristics of gas explosion. Dynamic monitoring of gas explosion parameters is required in numerical calculation. Eight monitoring points from A to H are arranged at the axis of the roadway. The distance between each adjacent monitoring point is 1 m. The data measurement points are shown in Figure 1. Combined with the numerical simulation results of the propagation characteristics of gas explosion in the roadway, the shock wave pressure, the rise rate of pressure, and flame propagation velocity are analyzed when the initial pressure is 0.08, 0.09, 0.10, 0.11, and 0.12 MPa, respectively, so as to obtain the influence of initial pressure on gas explosion and its propagation characteristics in roadway.
3 Results and Discussion
3.1 Influence of initial pressure on shock wave pressure
The generation and propagation of shock waves in the process of underground gas explosion bring a huge threat to the coal production. Figure 4 shows the cloud diagram of shock wave pressure propagation at 1.6 ms after gas explosion under different initial pressures. After the gas explosion occurs in the roadway, the shock wave spreads from the explosion source to the periphery in a spherical shape. When the shock wave propagating in the confined space contacts the roadway wall, the reflected wave with strong energy is superimposed with the shock wave, which rapidly increases the pressure and changes the shape of the shock wave. According to the propagation distance of the shock wave and the contact degree with the wall in Figure 4, the propagation process of the shock wave slows down with the increase of initial pressure, while the shock wave pressure increases relatively. In order to quantitatively study the relationship between initial pressure and shock wave pressure, the pressure-time relationship curves of shock wave at monitoring point C under different initial pressures are shown in Figure 5. It can be found from Figure 5 that the explosive product expands rapidly after ignition, and a strong wave front is rapidly formed in the roadway and propagates outward, causing the pressure at this point to rise rapidly and reach a peak value. The pressure then drops rapidly and fluctuates to form a second peak that eventually fluctuates around normal pressure levels.
FIGURE 4. Cloud diagram of shock wave pressure propagation under different initial pressures. (A) P = 0.08 MPa. (B) P = 0.09 MPa. (C) P = 0.10 MPa.(D) P = 0.11 MPa. (E) P = 0.12 MPa.
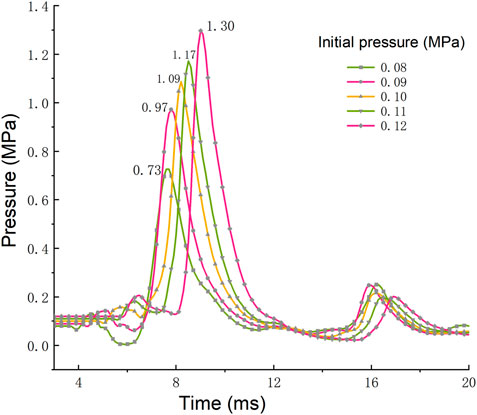
FIGURE 5. The pressure-time curves of shock wave.
According to the above data and curves, the variation trend of shock wave pressure under five different initial pressures is generally similar, but with the increase of initial pressure, the peak pressure of shock wave increases significantly. When the initial pressure is 0.08 MPa, the peak pressure of shock wave is 0.73 MPa. When the initial pressure is 0.12 MPa, the peak pressure of shock wave is 1.3 MPa, so the value in initial pressure of 0.12 MPa is 78% higher than that in the initial pressure of 0.08 MPa. As the initial pressure increases, the number of reactant molecules per unit volume increases, the molecular spacing decreases, the effective collision probability increases, and the reaction intensity increases.
The peak pressure and its arrival time at different initial pressures are shown in Figure 6. When the initial pressure is 0.08, 0.09, 0.10, 0.11, and 0.12 MPa, the time to reach the peak pressure is 7.6, 7.9, 8.3, 8.6, and 9.1 ms, respectively. The results show that the increase of the initial pressure can prolong the time of the shock wave pressure to reach the peak value. According to the collision theory, the destruction rate of free radicals in the collision is accelerated when the system pressure increases, but effective collisions can only be generated when the molecular bonds that collide are broken and then recombined between atoms. Therefore, the increase of free radical destruction rate caused by the increase of pressure has a great influence on the reaction time due to the low reaction rate in the early stage of the explosion. An overall decrease in the concentration of free radicals capable of effective collisions in the reaction zone leads to an increase in the initial reaction time of the explosion, which is finally reflected in a slight increase in the time to reach the peak pressure.
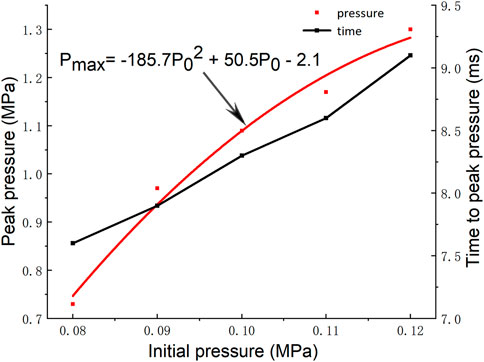
FIGURE 6. Peak pressure and its arrival time.
The peak pressure of the shock wave is an important index to evaluate the intensity of gas explosion. Quantitative analysis of the relationship between the peak pressure of the shock wave and the initial pressure can obtain the fitting relationship:
where
3.2 Influence of initial pressure on pressure rise rate of shock wave
The rise rate of explosion pressure is an index to measure the speed of the gas explosion, which can be used to describe the explosion intensity and evaluate the explosion danger. The pressure rise rate of gas explosion can be obtained by derivation of the pressure-time curve. The time-history curves of the pressure rise rate of shock wave under different initial pressures at monitoring point C are shown in Figure 7. It can be obtained from Figure 7 that in the propagation process of gas explosion, the pressure rise rate at point C increases rapidly to the maximum value, then rapidly decreases to a negative value, and finally tends to be stable in the fluctuation. From the curve of pressure rise rate, the change process of the pressure rise rate and the influence of the initial pressure on the pressure rise rate can be obtained. With the increase of the initial pressure, the pressure rise rate of the gas explosion increases gradually, and the time to reach the maximum pressure rise rate also be prolonged. According to monitoring point C, when the initial pressure is 0.08 MPa, the maximum pressure rise rate is 0.65 MPa/ms. When the initial pressure is 0.12 MPa, the maximum pressure rise rate is 1.17 MPa/ms, so the value in initial pressure of 0.12 MPa is 80% higher than that in the initial pressure of 0.08 MPa. Finally, it can be obtained that the intensity of gas explosion increases with the increase of initial pressure, which also means that the danger and destructiveness of gas explosion become higher.
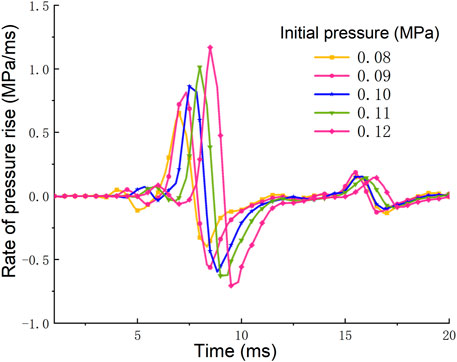
FIGURE 7. Rise rate of pressure.
Through in-depth analysis of the data, the maximum pressure rise rates of the eight monitoring points under different initial pressures are obtained, which are shown in Figure 8. It can be found from Figure 8 that the overall change trend of the maximum pressure rise rate at each measuring point under different initial pressures is same. It first increases rapidly, then decreases slowly, and reaches a peak at point C. Through the longitudinal comparison of the maximum pressure rise rate of each monitoring point under different initial pressures, the maximum rise rate of pressure at the same position accelerates with the increase of initial pressure. The comparison shows that the increment of the maximum pressure rise rate at the same monitoring point increases with every initial pressure increase of 0.01MPa, which means that the maximum rise rate of pressure does not change linearly with the initial pressure, and the risk of the gas explosion increases rapidly with the increase of the initial pressure.
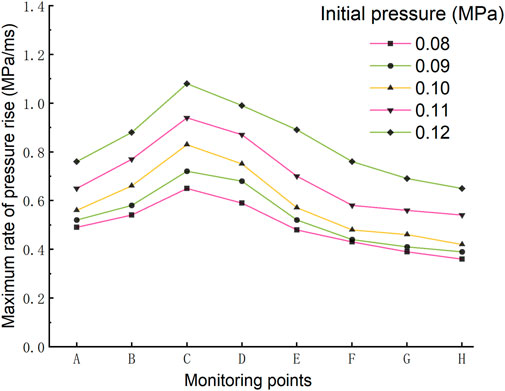
FIGURE 8. Maximum rise rate of pressure.
3.3 Influence of initial pressure on flame propagation velocity
Gas explosion is a macroscopic nonlinear turbulent combustion process with strong interaction between flame structure and pressure wave. There is a very complex relationship between flame wave and pressure wave. The gas volume fraction after gas explosion can intuitively reflect the propagation characteristics of the explosion flame. Figure 9 shows the cloud diagram of the flame propagation position under different initial pressures after 2 ms of the explosion. In Figure 9, the flame wave front moves forward in a “finger-like” manner. The interior of the roadway can be divided into the burned area, the burning area and the premixed area according to the flame front. The comparison finds that with the increase of the initial pressure, the flame propagation distance gradually decreases simultaneously. It is ultimately reflected in the fact that the propagation velocity of the flame decreases with the increase of the initial pressure.
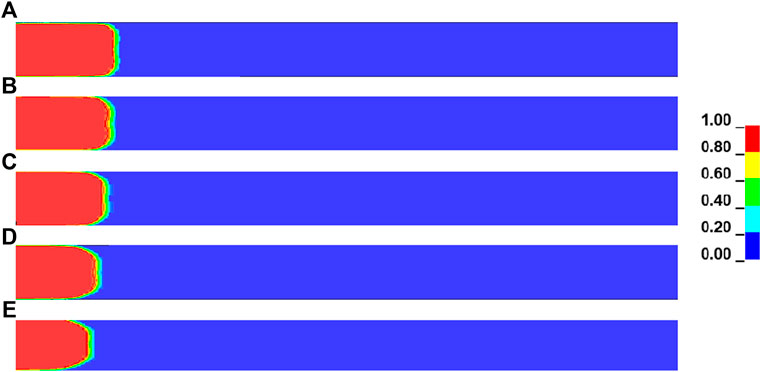
FIGURE 9. Location of flame spread under different initial pressures. (A) P = 0.08 MPa. (B) P = 0.09 MPa. (C) P = 0.10 MPa. (D) P = 0.11 MPa.(E) P = 0.12 MPa.
The average velocity of flame propagation between point A and point H is taken as the approximate flame propagation velocity. The average velocity of flame propagation at different initial pressures is shown in Figure 10. When the initial pressure is 0.08, 0.09, 0.10, 0.11, and 0.12 MPa, the flame propagation velocity is 251, 244, 240, 234, and 225 m/s, respectively. When the initial pressure increases by 0.01 MPa, the flame propagation velocity will decrease by 2.6%. According to Dalton’s law of partial pressure, the partial pressure of gas increases with the increase of initial pressure, which increases the gas mass per unit volume. The increase in the number of gas molecules involved in the reaction prolongs the time required for the reaction. Although the increase of initial pressure decreases the molecular spacing and increases the effective collision, the simulation results show that the former factor plays a leading role in the influence of flame propagation velocity. It can be found comprehensively that the reaction time of gas becomes longer with the increase of initial pressure, which is finally reflected in the fact that the flame propagation velocity decreases with the increase of initial pressure.
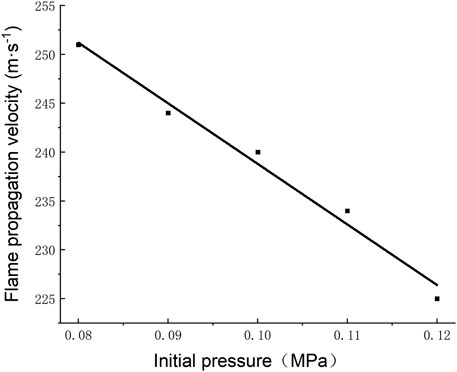
FIGURE 10. Flame propagation velocity.
4 Conclusion
In order to explore the influence of initial pressures on the propagation characteristics of gas explosions in roadway, the shock wave pressure, the rise rate of pressure and the flame propagation velocity of gas explosion under different initial pressures are analyzed, and the conclusions are obtained as follows.
1) The maximum pressure of shock wave at the same position in the roadway increases significantly with the increase of initial pressure, which presents a quadratic function relationship. The time to reach the maximum pressure of shock wave is extended comparatively.
2) The maximum rise rate of shock wave pressure increases with the increase of initial pressure, which means that the explosion hazard increases.
3) The flame propagation velocity in roadway decreases linearly with the increase of initial pressure. When the initial pressure increases by 0.01 MPa, the flame propagation speed will decrease by 2.6%.
Data availability statement
The original contributions presented in the study are included in the article/Supplementary Material, further inquiries can be directed to the corresponding author.
Author contributions
ZH is mainly responsible for numerical simulation and article writing; JZ is responsible for the establishment and validity verification of the model; YQ is responsible for providing research ideas and supervision; CY and LS provide technical consulting services.
Funding
This work is financially supported by the National Natural Science Foundation Project of China (52174177, 52174178) and project supported by Scientific Research Fund of Hunan Provincial Education Department (20B240). Those supports are greatly acknowledged.
Conflict of interest
The authors declare that the research was conducted in the absence of any commercial or financial relationships that could be construed as a potential conflict of interest.
Publisher’s note
All claims expressed in this article are solely those of the authors and do not necessarily represent those of their affiliated organizations, or those of the publisher, the editors and the reviewers. Any product that may be evaluated in this article, or claim that may be made by its manufacturer, is not guaranteed or endorsed by the publisher.
References
Al-Malki, F. (2013). Numerical simulation of the influence of partial premixing on the propagation of partially premixed flames. Comput. Math. Appl. 66 (3), 279–288. doi:10.1016/j.camwa.2013.05.007
Cheng, J., Luo, W., Zhao, Z., Jiang, D., Zhao, J., and Shi, L. (2021). Controlling coal spontaneous combustion fire in longwall gob using comprehensive methods - a case study. Min. Metall. Explor. 38 (4), 1801–1816. doi:10.1007/s42461-021-00427-6
Cheng, J., Mei, J., Peng, S., Qi, C., and Shi, Y. (2019). Comprehensive consultation model for explosion risk in mine atmosphere-CCMER. Saf. Sci. 120, 798–812. doi:10.1016/j.ssci.2019.07.035
Cheng, J., and Wei, L. (2014). Failure modes and manifestations in a mine gas explosion disaster. J. Fail. Anal. Preven. 14 (5), 601–609. doi:10.1007/s11668-014-9852-0
Cheng, J., Zhang, X., and Ghosh, A. (2017). Explosion risk assessment model for underground mine atmosphere. J. Fire Sci. 35 (1), 21–35. doi:10.1177/0734904116676495
Cui, G., Wang, S., Liu, J., Bi, Z., and Li, Z. (2022). Explosion characteristics of a methane/air mixture at low initial temperatures. Fuel 161, 886–893. doi:10.1016/j.fuel.2018.07.139
Gao, K., Liu, J., Jia, J., Liu, Y., and Liu, Y. (2015). Numerical simulation on influence of pipeline attribute on gas explosion wave propagation. Int. J. Earth. Sci. Eng. 8 (3), 1353–1357.
Gao, K., Liu, Z., Wu, C., Li, J., Liu, K., Liu, Y., et al. (2021). Effect of low gas concentration in underground return tunnels on characteristics of gas explosions. Process Saf. Environ. Prot. 152, 679–691. doi:10.1016/j.psep.2021.06.045
Hou, W., Tan, Y., and Zhang, Y. (2009). Experiment and study on gas explosion features in simulated mine roadway. Coal Sci. Technol. 37 (5), 58–61. doi:10.4028/www.scientific.net/AMR.962-965.919
Huang, L., Pei, S., Wang, Y., Zhang, L., Ren, S., Zhang, Z., et al. (2019a). Assessment of flammability and explosion risks of natural gas-air mixtures at high pressure and high temperature. Fuel 247 (1), 47–56. doi:10.1016/j.fuel.2019.03.023
Huang, L., Wang, Y., Pei, S., Cui, G., Zhang, L., Ren, S., et al. (2019b). Effect of elevated pressure on the explosion and flammability limits of methane-air mixtures. Energy 186, 115840. doi:10.1016/j.energy.2019.07.170
Jiang, B., Lin, B., Shi, S., Zhu, C., and Ning, J. (2012). Numerical simulation on the influences of initial temperature and initial pressure on attenuation characteristics and safety distance of gas explosion. Combust. Sci. Technol. 184 (2), 135–150. doi:10.1080/00102202.2011.622321
Li, J., Liang, D., and Chen, Z. (2011). The research on combustible gas lower limit of explosion expanding in high temperature. Procedia Eng. 11, 216–225. doi:10.1016/j.proeng.2011.04.650
Li, Z., Chen, L., Yan, H., Fang, Q., Zhang, Y., Xiang, H., et al. (2021). Gas explosions of methane-air mixtures in a large-scale tube. Fuel 285, 119239. doi:10.1016/j.fuel.2020.119239
Liu, J., Zhang, Y., Chen, S., Nie, Z., and Yang, D. (2022). Simulation study of gas explosion propagation law in coal mining face with different ventilation modes. Front. Energy Res. 10, 846500. doi:10.3389/fenrg.2022.846500
Liu, L., Luo, Z., Wang, T., Cheng, F., Gao, S., Liang, H., et al. (2021). Effects of initial temperature on the deflagration characteristics and flame propagation behaviors of CH4 and its blends with C2H6, C2H4, CO, and H2. Energy fuels. 35, 785–795. doi:10.1021/acs.energyfuels.0c03506
Luo, Z., Kang, X., Wang, T., Su, B., Cheng, F., Deng, J., et al. (2021). Effects of an obstacle on the deflagration behavior of premixed liquefied petroleum gas-air mixtures in a closed duct. Energy 234, 121291. doi:10.1016/j.energy.2021.121291
Mitu, M., and Brandes, E. (2015). Explosion parameters of methanol–air mixtures. Fuel 158, 217–223. doi:10.1016/j.fuel.2015.05.024
Niu, Y., Shi, B., and Jiang, B. (2019). Experimental study of overpressure evolution laws and flame propagation characteristics after methane explosion in transversal pipe networks. Appl. Therm. Eng. 154, 18–23. doi:10.1016/j.applthermaleng.2019.03.059
Pio, G., and Salzano, E. (2019). The effect of ultra-low temperature on the flammability limits of a methane/air/diluent mixtures. J. Hazard. Mat. 362 (15), 224–229. doi:10.1016/j.jhazmat.2018.09.018
Razus, D., Movileanua, C., and Oancea, D. (2007). The rate of pressure rise of gaseous propylene–air explosions in spherical and cylindrical enclosures. J. Hazard. Mat. 139 (1), 1–8. doi:10.1016/j.jhazmat.2006.05.103
Razus, D., Oancea, D., Brinzea, V., Mitu, M., and Movileanu, C. (2010). Experimental and computed burning velocities of propane–air mixtures. Energy Convers. Manag. 51 (12), 2979–2984. doi:10.1016/j.enconman.2010.06.041
Wang, K., Han, T., Deng, J., and Zhang, Y. (2022).comparison of combustion characteristics and kinetics of jurassic and carboniferous-permian coals in China, Energy 254, 124315. doi:10.1016/j.energy.2022.124315
Wang, L., Ma, H., and Shen, Z. (2019). Explosion characteristics of hydrogen-air mixtures diluted with inert gases at sub-atmospheric pressures. Int. J. Hydrogen Energy 44 (40), 22527–22536. doi:10.1016/j.ijhydene.2019.01.059
Wang, S., Yan, Z., Li, X., Li, G., Guo, H., Wu, D., et al. (2020). The venting explosion process of premixed fuel vapour and air in a half-open vessel: An analysis of the overpressure dynamic process and flame evolution behaviour. Fuel 268 (15), 117385. doi:10.1016/j.fuel.2020.117385
Yang, W., Zheng, L., Wang, C., Wang, X., Jin, H., Fu, Y., et al. (2021). Effect of ignition position and inert gas on hydrogen/air explosions. Int. J. Hydrogen Energy 46 (12), 8820–8833. doi:10.1016/j.ijhydene.2020.12.078
Yang, Z., Ye, Q., Jia, Z., and Li, H. (2020). Numerical simulation of pipeline-pavement damage caused by explosion of leakage gas in buried PE pipelines. Adv. Civ. Eng. 2020, 1–18. doi:10.1155/2020/4913984
Ye, Q., and Jia, Z. (2014). Effect of the bifurcating duct on the gas explosion propagation characteristics. Combust. Explos. Shock Waves 50 (4), 424–428. doi:10.1134/s0010508214040108
Ye, Q., Jia, Z., Wang, H., and Pi, Y. (2013). Characteristics and control Technology of gas explosion in gob of coal mines. Disaster Adv. 6 (S3), 112–118.
Ye, Q., Jia, Z., and Zheng, C. (2017b). Study on hydraulic-controlled blasting Technology for pressure relief and permeability improvement in a deep hole. J. Pet. Sci. Eng. 159, 433–442. doi:10.1016/j.petrol.2017.09.045
Ye, Q., Lin, B., Jian, C., and Jia, Z. (2012). Propagation characteristics of gas explosion in duct with sharp change of cross sections. Disaster Adv. 15 (4), 999–1003.
Ye, Q., Wang, G. G., Jia, Z., and Zheng, C. (2017a). Experimental study on the influence of wall heat effect on gas explosion and its propagation. Appl. Therm. Eng. 118 (25), 392–397. doi:10.1016/j.applthermaleng.2017.02.084
Yu, M., Yang, X., Zheng, K., and Luan, P. (2020). Progress and development of coal mine gas explosion suppression and disaster reduction Technology in China. J. China Coal Soc. 45 (1), 168–188. doi:10.13225/j.cnki.jccs.YG19.1422
Zheng, K., Yu, M., Zheng, L., and Wen, X. (2018). Comparative study of the propagation of methane/air and hydrogen/air flames in a duct using large eddy simulation. Process Saf. Environ. Prot. 120, 45–56. doi:10.1016/j.psep.2018.08.025
Zheng, L., Li, G., Wang, Y., Zhu, X., Pan, R., Wang, Y., et al. (2018). Effect of blockage ratios on the characteristics of methane/air explosion suppressed by BC powder. J. Hazard. Mat. 355, 25–33. doi:10.1016/j.jhazmat.2018.04.070
Keywords: initial pressure, gas explosion, propagation characteristic, numerical simulation, roadway space
Citation: Haohao Z, Zhenzhen J, Qing Y, Yu C and Shujuan L (2022) Numerical simulation on influence of initial pressures on gas explosion propagation characteristics in roadway. Front. Energy Res. 10:913045. doi: 10.3389/fenrg.2022.913045
Received: 05 April 2022; Accepted: 11 July 2022;
Published: 08 August 2022.
Edited by:
Lipo Wang, Shanghai Jiao Tong University, ChinaReviewed by:
Yang Xiao, Xi’an University of Science and Technology, ChinaJianwei Cheng, China University of Mining and Technology, China
Kai Wang, Xi’an University of Science and Technology, China
Copyright © 2022 Haohao, Zhenzhen, Qing, Yu and Shujuan. This is an open-access article distributed under the terms of the Creative Commons Attribution License (CC BY). The use, distribution or reproduction in other forums is permitted, provided the original author(s) and the copyright owner(s) are credited and that the original publication in this journal is cited, in accordance with accepted academic practice. No use, distribution or reproduction is permitted which does not comply with these terms.
*Correspondence: Ye Qing, Y3VtdHllcWluZ0AxMjYuY29t