 Kun Wang1
 Jiajia Yang
 Fushuan Wen
- 1College of Electrical Engineering, Zhejiang University, Hangzhou, China
- 2State Grid Zhejiang Electric Power Co., Ltd. Research Institute, Hangzhou, China
- 3Hainan Institute, Zhejiang University, Sanya, China
Under the China’s ‘dual carbon’ national goal–reaching peak carbon emissions by 2030 and achieving carbon neutrality by 2060, one of the key issues in China is how to smoothly transit from a fixed-price mode to a competitive market pricing mode for renewable energy generation companies. Aiming at minimizing governmental subsidies and maximizing the fairness among renewable energy generation companies, a multi-agent three-layer transition mechanism with the transactions of green certificates considered is proposed in this paper. Through adjusting subsidy policies, the developed transition mechanism can stimulate the renewable energy generation companies to gradually participate in the competitive electricity spot market. Specifically, a multi-market multi-agent transaction framework in the transition mechanism is first established. Then, in order to derive the important parameters of the transition mechanism, a method that decouples the electricity market and the green certificate market is designed. Finally, the feasibility and efficiency of the proposed transition mechanism are demonstrated through numerical examples.
1 Introduction
The Renewable Energy Sources (RESs) in China have been developing rapidly with the goal of reaching peak carbon emissions by 2030 and achieving carbon neutrality by 2060 (The State Council Information Office of the People’s Republic of China, 2020). By the end of 2020, the total installed capacity of RES-based generation in China reached 530 million kW, accounting for 25.5% of the total generation installed capacity. The rapid development of RESs also results in the large amount of subsidies to RES investors. In order to mitigate financial burdens on the government due to RES subsidies, the energy administrative authorities have been continuously lowering the benchmark electricity prices for photovoltaic and wind power generation. In June 2021, the National Development and Reform Commission issued a relevant document (National Development and Reform Commission of China, 2020), stipulating that the central government would no longer subsidize the newly registered centralized photovoltaic power plants, industrial and commercial distributed photovoltaic projects, and newly approved onshore wind power projects in 2021. This will help to alleviate the financial burden, but it may lead to a sharp decline in the growth rate of RES installations.
In order to alleviate the financial burden of subsidy while promoting the development of renewable energy generation, mature electricity markets have taken a number of measures. The German Ministry of Energy adopted the policy of feed-in premium in 2014, which guide RESs to participate in the competition in the electricity spot market (Schallenberg-Rodriguez and Haas, 2012). It is a transitional way for RESs to gradually shift from full acquisition to full competition (Gawel and Purkus, 2013). In contrast, the United States uses the renewable energy quota system to promote the development of RESs (Barbose et al., 2016; Luo, 2016). At present, more than 30 states in the United States have established a renewable energy quota system, which is conducive to encouraging RESs to adjust its own output according to market supply and demand, and reduce the pressure on system operation. The United Kingdom has implemented a policy of renewable obligation (RO) since 2002, which is similar to a quota system (García-Alvarez et al., 2017). Since the implementation of the RO policy, the RESs has developed rapidly in United Kingdom, and the average annual growth rate of power generation has reached 12%. In addition, both the United States and the United Kingdom allow RES units to participate in the electricity spot market (Kilinc-Ata, 2016).
Overall, the combination of “financial contract + spot market” and quota system is often adopted in practical electricity markets around the world (Ren et al., 2022), in which RES units participate in the electricity spot market equally with other types of generation units, and the risks of spot market prices are hedged by signing Contracts For Difference (CFD) between power supply companies and RES generation companies. Meanwhile, the establishment of a marketplace for Tradable Green Certificates (TGCs) is also deployed as an important measure to encourage the development of RES generation. The fixed-price procurement of RES generation as a subsidy for RES generation can be gradually replaced by governmental compensations to TGC transactions. This will not only help mitigate the governmental financial burdens but also promote the participation of RES generation units in competitive electricity spot markets, which is align with the requirements of sustainable development.
Currently, there is still no effective market mechanism to support the participation of RES generation units in electricity spot markets in China. On the one hand, the income of RES-based generation companies cannot be guaranteed after the participation, which will damage the confidence of RES-based generation investors, and is not conducive to the long-term RES generation development. On the other hand, the participation of RES generation units in the electricity spot market may increase the market volatility and lead to severe fluctuations in spot market prices (Xu et al., 2020; Yang et al., 2020). Therefore, the participation of RES generation units in electricity spot markets requires an effective transition mechanism.
Some publications are availabe on the participation mechanism/mode of RES generation units in electricity spot markets. Specifically, the impacts of RESs on electricity spot market due to the uncertainty are examined from both theoretical and empirical perspectives in (Li and Xu, 2021; Zhao et al., 2021). An electricity market transition model considering is proposed in (Shinde et al., 2021) to represent a possible requirement to undertake system balancing with increasing amounts of Intermittent RESs. A bilateral transaction model based on the Bayesian game is proposed in (Kong et al., 2021) to calculate the Bayes-Nash equilibrium point of the electricity spot market with high penetration RESs, thereby evaluating the smoothness of the participation of RESs in the electricity spot market. It is pointed out in (Gu, 2020) that the government-authorized contract system needs to be adopted collaboratively to ensure the accommodation of RES generation and external electricity, and the percentage of electricity covered by government-authorized contracts should be adjusted reasonably to achieve a smooth transition to the competitive market is proposed. A transition mechanism for the market participation of RESs based generation units, which can gradually guide the transition of RES generation units to the electricity spot market by adjusting the percentage of electricity covered by medium- and long-term contracts is proposed in (Dai and Chen, 2020). However, the specific method for determining the percentage of electricity is not given.
In addition, none of the above publications considers the impacts of TGC transactions on the spot electricity market participation of RES generation units. Since 2017, a green certificate voluntary subscription market has been in operation in China, laying the foundation for the implementation of the mandatory quota system. As an important measure to support the quota system, TGC trading has a positive effect on reducing the burdens on government financial subsidies and restructuring the revenue of renewable energy generation. A system dynamic model is established, and case studies are conducted in (Zhang et al., 2021; Zhu et al., 2022), pointing out that compared with fixed price purchases, the development efficiency and economic benefits of RES generation units under the quota system are higher. A study that analyzes the overall framework, core elements and supporting measures of the quota system in recent years together with China’s current national conditions, and puts forward a dual-track system of “fixed electricity price + quota system” is established in (Jiang et al., 2020). Another study that shows the role of the penalty mechanism of the quota system and points out that setting a reasonable penalty can support the market mechanism to improve the income of RES generation units, thereby reducing the financial burden of subsidies on the government is proposed in (Zhang et al., 2017).
In order for the sustainable development of renewable energy generation and the relief of the government financial burdens, it is of great significance to explore and study the transition mechanism for RES units to participate in the electricity spot market. To fill this knowledge gap, the main contributions of this paper are summarized as follows:
1) A new transition mechanism is proposed to reduce the financial burden of governmental subsidies and guide the participation of RES units in the electricity spot market.
2) A multi-agent three-layer optimal decision-making model is established to calculate the contract coverage ratio (CCR). CCR denotes the percentage of electricity traded via CFDs over the total on-grid electricity and is an important parameter in the transition mechanism. The method for determining the CCR of RES units is proposed to maximize the income of generators while taking into account the clearing results of the electricity spot market and the green certificate market.
3) Extensive numerical experiments using practical electricity market data are conducted to demonstrate the feasibility and efficiency of the proposed transition mechanism and solving methods. Both short-term and medium-long-term simulations are carried out in the experiments.
The rest of paper is organized as follows: Section 2 introduces the established transition mechanism for RES units to participate in the electricity spot market. Section 3 presents the method for determining the CCR. Extensive numerical experiments are employed to illustrate the proposed model in Section 4, and the simulation results are also analyzed. Finally, the paper is concluded in Section 5.
2 Transition Mechanism for the Participation of Renewable Energy Generators in the Electricity Spot Market
How to balance the financial burdens of government subsidies and the incentives for renewable energy development is an important issue in the electricity market reform. In the early stage of market development, RES generators face difficulties due to their weak market competitiveness, immature technologies, and recovery of investment costs, thus government financial subsidies are needed (Upton and Snyder, 2017). During this period, the government can sign CFDs with the RES generators to ensure their income and encourage their continued development. With the continuous progress of the electricity market reform, the number of RES generation companies is increasing, and the total amount of government subsidies will be increasing accordingly. In order to avoid such a situation, it is necessary to gradually reduce the CFDs for RES units, and guide RES units to participate in the electricity spot market. Meanwhile, through cooperation with the TGC market, the subsidies for RES units can be gradually shifted from government financial subsidies to TGC transaction subsidies (Ma et al., 2017), so as to encourage RES companies to carry out technological innovation while ensuring the consumption of green electricity. The market transaction framework of the proposed transition mechanism is shown in Figure 1.
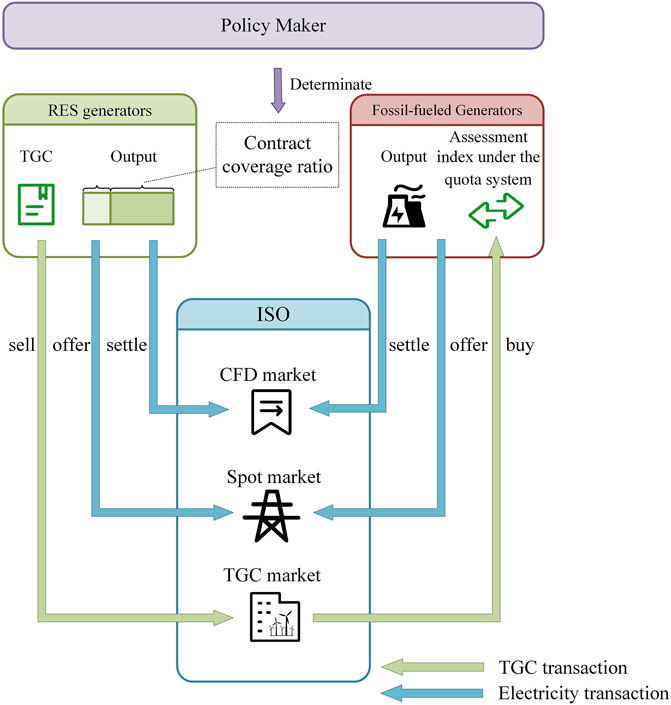
FIGURE 1. Framework of market transactions considering RES unit participation.
In the above framework, the income of RES units is divided into three parts, namely the income from CFDs, the income of selling electricity in the spot market, and the income of selling TGCs. According to existing policy (National Development and Reform Commission of China, 2020), depending on the number of issued TGCs and the price of CFDs, the calculation rules for RES units with different registered times are different, as shown in Table 1. Therefore, this paper categorizes RES units into two types.
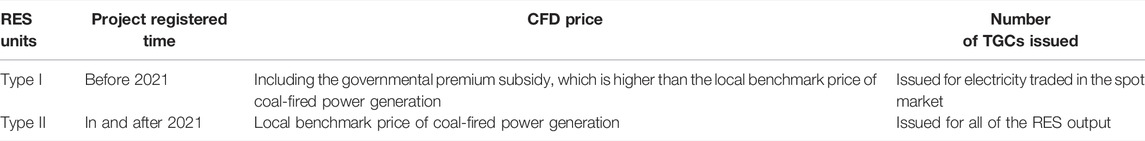
TABLE 1. Comparison of the two types of RES units.
The RES units in type I are those which was put into operation before 2021, and their CFD price is higher than the local benchmark price of coal-fired power generation. For these RES units, the government will subsidize for the generation output covered in the CFDs, and TGCs will be issued only for the electricity traded in the spot market. It means that only the RES generations traded in the spot market are compensated through the TGC market.
The RES units in type II are those to be put into operation after 2021, whose contract purchase price is specified as the benchmark price of local coal-fired power generation, and the CFDs of such RES units do not receive governmental subsidies. For these RES units, TGCs are issued for the electricity in both the CFDs and the spot market, thus the RES generations traded in both the CFDs and the spot market are compensated.
The CCR of RES units in the proposed transition mechanism is defined as the percentage of electricity traded via CFDs over the total on-grid electricity, as shown in Eq. 1.
where
The CCR stipulates the share of RES generations entering the spot market, and also determines the amount of government financial subsidies. The CCR is a key parameter and should be determined carefully considering the system reliability requirements, the reform process of the power market and other factors. The determination of CFD coverage is also related to the revenue of RES units and the number of TGCs issued, and may affect the market strategies of fossil-fueled generation units in the spot market and TGC market. Therefore, designing an innovative method for determining the contract coverage is the key to a smooth transition of the reform.
It should be noted that the continuous development of renewable energy generation will greatly increase the uncertainty of the power system. Correspondingly, the demand for ancillary market will also increase. This will inevitably have an impact on the clearing results of the electricity spot market and the market strategies of fossil-fueled generation units. But the situation discussed in this paper is in the early stage of RES development. In other words, the impact of participation of RESs in the electricity spot market on ancillary market is not fatal. Notably, the focus of this paper is on the participation of RES in electricity energy markets, and the extension of the proposed mechanism to the ancillary market will be systematically studied in our future work.
3 Mathematical Formulations of Proposed Transition Mechanism
The ratio of RES electricity generations covered by CFD contracts directly affects the amount of government financial subsidies and the income of RES units, and it is closely related to the clearing results of the spot market and the TGC market. In the transition mechanism, a three-layer optimization model is established, where the objective is to maximize the revenues for both RES units and fossil-fueled units while taking into account the outcomes of the spot market and the TGC market. The method for solving the optimal CCR is also presented.
Figure 2 illustrates the structure of decision-making model in the proposed transition mechanism. Specifically, the input parameters of the three-layer model include the predicted generation output, typical load curve, elasticity of load demand, generation constraints, network constraints, fuel costs of fossil-fueled units, and assessment weights of the quota system. In the upper-level model, the research object is the policymaker, the decision variable is the contract coverage of RES units, and the objective function is to minimize government financial subsidies and to maximize the fairness of subsidies. The contract coverage obtained in the upper model is passed to the middle-level model. The middle-level model includes the clearing models of both the electricity spot market and the green certificate market, which are managed by the Independent System Operator (ISO). The middle-level model feeds back the market clearing results to the upper model via simulations of the electricity spot market and the green certificate market. The lower-level model formulates the bidding strategies of RES and fossil-fueled units aiming at maximizing their income, and the optimal bidding results will be fed back to the middle-level model to complete the simulation of market operation.
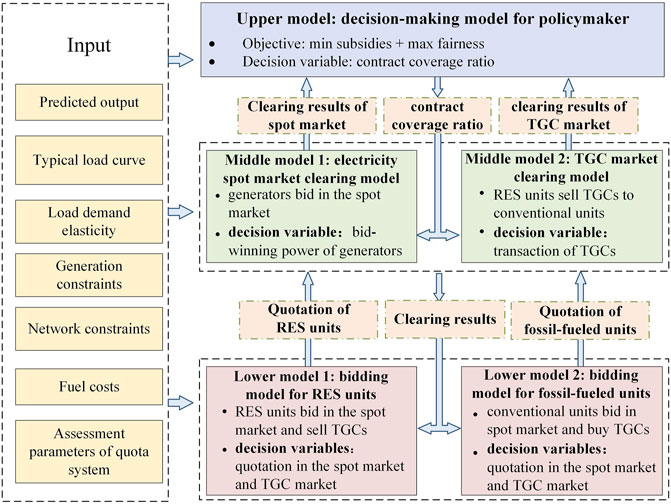
FIGURE 2. Illustration of the three-layer optimization model for determining the CCR.
3.1 Upper-Level: Decision-Making Model for Policymaker
The decision-making model for policymaker is to solve the CCR. The CCR not only determines the amount of financial subsidies, but also affects the fairness among RES units. Therefore, the upper-level model adopts a multi-objective optimization method to minimize government financial subsidies while maximizing the fairness. In this section, photovoltaic (PV) generators and wind turbines are taken as examples to elaborate details of the upper-level model.
3.1.1 Objective Function
3.1.1.1 Government Financial Subsidies
Alleviating the financial burdens of governmental subsidies is the first objective of this model, which is measured by the premium CFDs for RES units. It is modeled here that the difference between the CFD price and the spot market price is the premium value of government subsidies. Therefore, the objective function based on the amount of government financial subsidies can be expressed as follows.
where
3.1.1.2 Fairness in the Benefits Among Renewable Energy Sources Generation Units
The fairness of the governmental subsidy is crucial for the policymaker. While maximizing the overall benefit of RES units, it is necessary to ensure that each unit can benefit from the transition mechanism as much as possible. Therefore, another goal of the upper-level model is to maximize the fairness of income among the same type of units. The concept of unit power generation profit as defined in Eq. 3 is introduced to measure the fairness.
where
To ensure that the RES units of the same type have the smallest variance in the unit power generation profit in all trading periods, the objective function to measure the fairness of the RES profit can be expressed by Eq. 4.
where
Similarly, the objective functions for wind turbines can be formulated by Eqs. 5, 6.
where
where
3.1.2 Constraints and Solution
The output constraints of RES generators are included in the upper-level decision-making model, as shown in Eqs. 8, 9.
where
With the above objective functions and constraints, a multi-objective optimization model is obtained for solving the CCR of photovoltaic generators and wind turbines. The original objective functions are first normalized to [0,1] to get rid of the influence of dimension and order. Then the weighting factors are added as in Eq. 10.
where
3.2 Middle-Level: Market Clearing Model
3.2.1 Electricity Spot Market Clearing Model
The clearing results of the electricity spot market are required when calculating the CCR. Therefore, the electricity spot market clearing model is the first middle-level model to provide market data for decision-making in the upper-level model. Participants in the spot market can be divided into fossil-fueled generation units and renewable energy units. For a trading session
where
For both the type I and type II RES units,
where
3.2.2 Green Certificate Market Clearing Model
The TGC market clearing model is the other middle-level model. During a decision cycle, the TGC market clearing process is repeated. After a market clearing, the winning participants can conduct transactions, and the participants who have not reached a transaction will requote and enter the next market clearing process. Since the clearing results of the spot market and the TGC market affect each other, it is assumed that the clearing cycle of the TGC market is consistent with the spot market. For a trading session
where
where
3.3 Lower-Level: Bidding Model of Participants
3.3.1 Bidding Model for Renewable Energy Units
RES units participate in both the electricity spot market and the TGC market, so their income is made up of two parts as shown in Eq. 24.
where
The constraints in the bidding model of RES generation units are shown in Eqs. 25–27.
where Eq. 25 and Eq. 26 are bidding price constraints, and Eq. 27 is the biding output constraint.
Since the marginal cost of RES units is nearly zero, their market strategies in the spot market is always bidding the lowest price, so that they can win the bid as much as possible. In the TGC market, the market strategies is affected by the historical clearing results in the TGC market and the spot market as well as the CCR. It is important to point out that changes in contract coverage will only affect the number of TGCs issued for the type-I RES generation units (i.e., the subsidized units). Therefore, in the early stage of market reform when the type-I RES generation units accounting for a larger proportion of the total generation, the CCR has larger impacts on the supply and demand relationship in the TGC market. As the electricity marketization reform progresses, the proportion of the type-II RES generation units (i.e., the unsubsidized units) will increase, and the CCR will have less impacts on the TGC market clearing results.
Notably, RESs are usually coupled with energy storage resources (ESRs). Since this paper discusses the situation in the early stage of RES participation in electricity markets, the penalty mechanism for the generation output deviations of RES units is not considered in this paper. The forecasting results of RES generation outputs could be more accurate if ESRs are modeled, but the attained conclusions will remain unchanged. It is implicitly assumed that the predicted generation outputs of RES units could be accurate enough, even without ESRs installed.
3.3.2 Bidding Model for Fossil-Fueled Generation Units
When fossil-fueled generation units participate in the spot market, they need to purchase TGCs in the TGC market, so their income is also divided into two parts, as shown in Eq. 28.
where
The constraints of the bidding model for fossil-fueled generation units are shown in Eqs. 29–31. Among them, Eqs. 29, 30 are the bidding constraints, and Eq. 31 is the output constraints.
where Eq. 29 and Eq. 30 are the bidding price constraints, and Eq. 31 is the bidding output constraint.
In the spot market, the market strategies of fossil-fueled generation units not only depends on its production conditions, fuel prices and other factors, but also is affected by the TGC market clearing results. When the TGC market clearing price is high and fossil-fueled units cannot buy enough TGCs, their risk of being punished for not meeting the quota will increase, so they will tend to reduce the value of offering prices.
In the TGC market, the market strategies of fossil-fueled generation units (i.e., TGC buyers) is affected by the clearing results of the spot market. If the clearing electricity in the spot market is low, or the clearing price is low, the incentive of purchasing TGCs will drop. In the long run, the market strategies of fossil-fueled units is also affected by factors such as the approaching assessment date and the overall trend of TGC prices throughout the assessment cycle.
3.4 Reformulation and Solution
Mathematical reformulations are conducted to solve the proposed three-layer model. Since the lower-level model is a linear programming problem, the Karush-Kuhn-Tucker (KKT) condition is a necessary and sufficient condition of optimality. Therefore, the two bidding models in the lower layer can be replaced with their KKT conditions and incorporated into the middle-level model, thereby transforming the original three-layer model into a two-layer optimization model. Given Eq. 24 and Eq. 28, the Lagrangian functions of the bidding model for renewable energy based generation units and the bidding model for fossil-fueled generation units are formulated as follows.
Thus, the KKT conditions of the lower-level model are derived as Eqs. 34–37.
Based on the above KKT conditions, the lower-level model is transformed into linear constraints and incorporated into the middle-level optimization model.
Similarly, since the two market clearing models in the middle layer are both linear programming problems, the middle-level model can also be replaced with its KKT condition, thereby transforming the original problem into a single-level optimization model. After substituting Eqs. 34–37 into Eqs. 11–17 and Eqs. 19–22, the Lagrangian functions of the spot market clearing model and the TGC market clearing model are constructed as below.
Therefore, the KKT conditions of the electricity spot market clearing model and the TGC market clearing model can be expressed by Eqs. 40–60.
3.4.1 Equality Constraints
3.4.2 Inequality Constraints
3.4.3 Dual Complementary Constraints
where
For the dual complementary constraints in Eqs. 52–60, the big M method can be used to convert them into linear constraints. For example, a binary variable
where
With the above KKT conditions, the middle- and lower-level models are transformed into linear constraints and incorporated into the upper-level optimization model. At this point, the three-layer optimization model to determine the contract coverage of RES units has been transformed into a Mixed-Integer Linear Programming (MILP) problem, which can be solved by the GUROBI solver in MATLAB, and finally obtain the optimal CCR for RES generation units.
4 Numerical Examples and Results
4.1 Data Specifications
Numerical experiments are performed using the real-world data of the electricity market in a province of eastern China. It is assumed that the RES units begin to participate in the electricity spot market in 2020. The fossil-fueled generation units are coal-fired units, and the RES units include photovoltaics and wind turbines. The parameters of each unit in 2020 are shown in Table 2. The RES units in 2020 all belonged to type I; the number of type-II units started increasing from 2021, and the annual growth rate is set according to governmental policies (The State Council Information Office of the People’s Republic of China, 2020). The CFD price for the type-II RES units is the same as for coal-fired units. The RES output is predicted based on the historical data, and the annual load demand curve is obtained based on the load curve of that province in 2020. The responsibility weight of the quota system for coal-fired units is set according to governmental policies (National Development and Reform Commission and National Energy Administration Commission, 2021). The lower and upper limits of the clearing price in the spot market are set to −200 yuan/MWh and 1000 yuan/MWh respectively, and the lower and upper limits of the clearing price in the TGC market are set to 0 yuan/MWh and 800 yuan/MWh respectively.
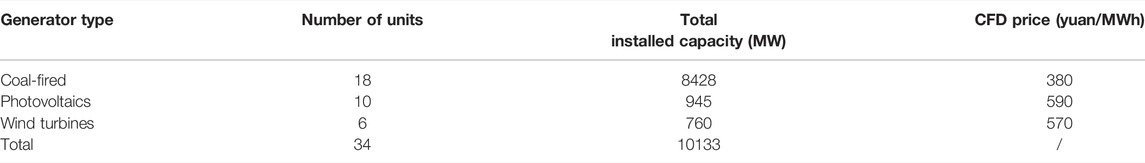
TABLE 2. Parameter settings of generation units in 2020.
In this experiment, the CCR in the peak period, flat period, and valley period of each day for photovoltaic generators and wind turbines will be determined, respectively. Furthermore, the comprehensive CCR is introduced to reflect the overall CCR of RES units, which is a weighted average of the contract coverage at different times, as shown in Eq. 63.
where
4.2 Analysis of Short-Term Simulation Results
The changes in CCR in 2020 are simulated by adjusting the weighting factors of the decision-making model, as shown in Figure 3 and Figure 4. Changes in policy, load supply, and demand are simulated by changing the ratio of
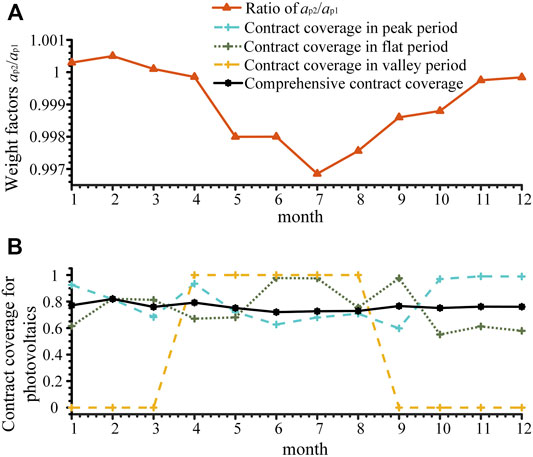
FIGURE 3. Changes in contract coverage of photovoltaics in 2020. (A) Change of weight factors. (B) Change of contract coverage.
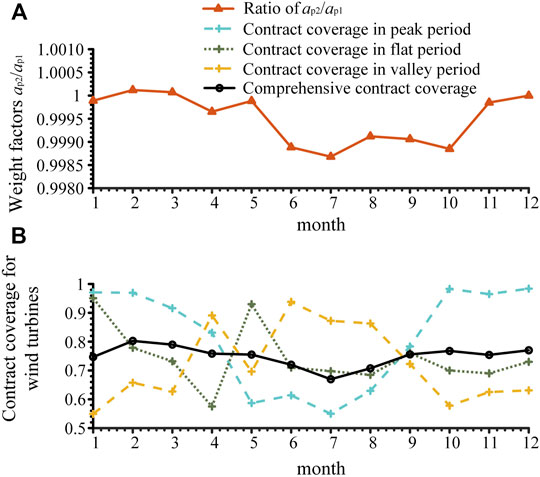
FIGURE 4. Changes in contract coverage of wind turbines in 2020. (A) Change of weight factors. (B) Change in contract coverage.
It can be seen in Figure 3 and Figure 4 that the comprehensive CCR of photovoltaics and wind turbines is consistent with the trend of the weighting factors. This indicates that the CCR can achieve the expected effect by adjusting the weighting factors. Specifically, at the beginning of the year, the contract coverage of RES units remains at a high level since the winter is the peak period, and then it decreases significantly in the summer. This allows RES units to maintain a high level of income through high-coverage CFDs in winter. When the spot market price is higher in summer, the CCR of RES generations is low and thus the remaining RES outputs can opt to participate in the spot market. This is consistent with the intention of setting the weighting factors. The output of photovoltaics mainly concentrates in the middle of the load, so it needs to be maintained at a high level to ensure the income. The output of wind turbines in each load period fluctuates greatly due to the uncertainty of wind power, so its CCR varies more. The contract coverage of photovoltaics in the load valley period is extreme, because the output of photovoltaics in the valley period is extremely small, whose impact on the objective function is limited.
The results of income and fairness coefficients for RES units are compared between proposed method and the fixed contract coverage method, as shown in Table 3. For the income analysis, fixing the CCR will increase the government’s financial subsidy but reduce the income of RES units in the spot market and the TGC market. For the fairness analysis, the fairness coefficient of fixing the contract coverage is relatively large, meaning that the variance of unit power generation income among the RES units is too high. Further analysis shows that fixing the annual CCR is a solution to the proposed model, but not the optimal solution. The decision-making cycle of optimal contract coverage should be determined according to the changes of generation output and load demand, while considering the policy formulation and the implementation of RES units.
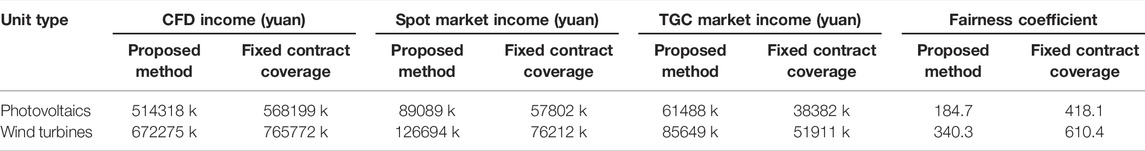
TABLE 3. Comparisons between the results attained by the proposed method and the fixed contract coverage.
4.3 Analysis of Medium and Long-term Results
Based on the “14th Five-Year Plan”, the “carbon peaking” goal in 2030, and the outline of the long-term goal in 2035 (The State Council Information Office of the People’s Republic of China, 2020; National Development and Reform Commission of China, 2021), the simulation of RES unit participation in the spot market from 2020 to 2035 is carried out, as shown in Figure 5.
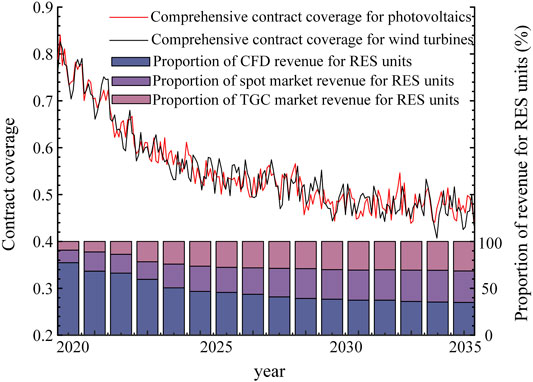
FIGURE 5. Changes in contract coverage and revenue share of RES generation units from 2020 to 2035.
As can be seen from Figure 5, during the transition of electricity market reform, due to the continuous development of renewable energy generation technology, government subsidies decrease, and the CCR of RES units and the proportion of CFD revenue also decrease. The proportion of spot market revenue and TGC market revenue increase, indicating that RES units gradually adapt to the spot market during the transition, and the subsidy for RES units changes smoothly from the financial subsidy to TGC subsidy. As the number of type II RES units increases year by year, the impact of contract coverage on the spot market and TGC market gradually decreases. In this example, to 2035, the revenue composition of RES units is relatively fixed, the change in contract coverage tends to be stable, and the curve only fluctuates with changes in load demand and generation output. When RES units have completed the transition phase to participate in the spot market, the determination of the contract coverage can be further adjusted according to the development and policies of renewable energy.
4.4 Sensitivity Analysis of Contract Coverage
Sensitivity analysis is carried out for the contract coverage against market boundary conditions including the assessment weights of the quota system and system load demand.
Firstly, the changes in CCR for RES units under different assessment weights of the quota system for fossil-fueled units are studied. Taking the simulation data in July 2025 as an example, the results are shown in Figure 6 and Figure 7. It can be found that with the increasing of the assessment weights, the CCR of RES units shows a downward trend. The reason is that when the assessment weights of the quota system for fossil-fueled units increase, their demand for TGC increases, which then leads to an increase in the clearing price of the TGC market. Under the same weighting factors, the reduction in government subsidy burdens caused by the decrease in contract coverage does not come at the expense of a sharp decline in the RES generator revenue, because the number of TGCs sold by type I RES units increases, making the RES generator revenue from TGC market increase. As fossil-fueled units have a greater demand for TGC during peak load periods, the contract coverage decreases the most during peak periods. Changing the market strategies of fossil-fueled units in the TGC market can effectively make up for the difference in the degree of decline of RES units in peak, flat and valley periods. Due to the output uncertainties of RES units and the approaching deadline for assessment, this difference cannot be eliminated. However, it is worth noting that due to the small output of photovoltaics during the valley period, the CCR does not change when adjusting the assessment weights.
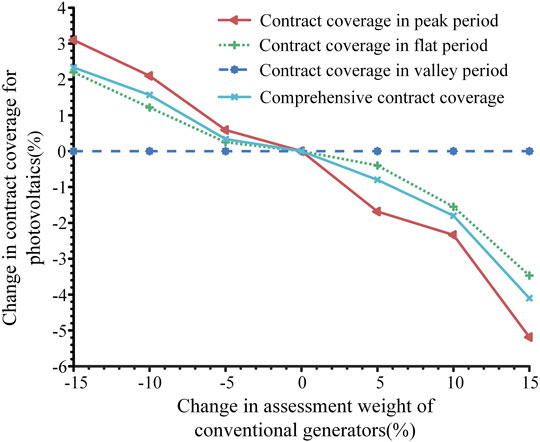
FIGURE 6. Changes in CCR for photovoltaics under different assessment weights of the quota system.
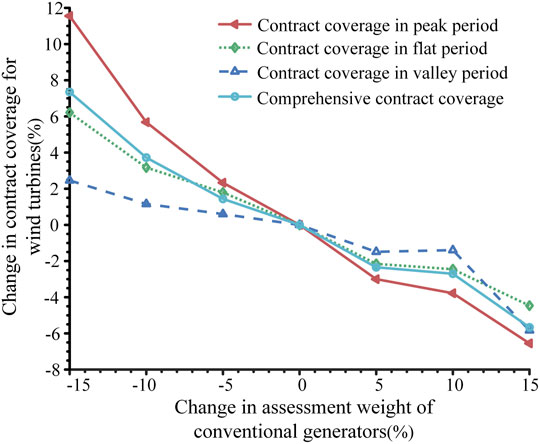
FIGURE 7. Changes in CCR of wind turbines under different assessment weights of the quota system.
Secondly, the changes in CCR for RES units under different load levels are examined. Taking the simulation data in July 2025 as an example, the results are shown in Figure 8 and Figure 9. The results show that the contract coverage shows a downward trend as the load demand increases. The reason is that the increase in load will lead to an increase in the spot market price. Under the same weighting factors, the reduction in government subsidy caused by the decrease in contract coverage does not come at the expense of a sharp drop in the revenue of RES units, because the spot market revenue of RES units increases. Similar to when adjusting the assessment weights, adjusting the load demand does not change the CCR for photovoltaics during valley periods.
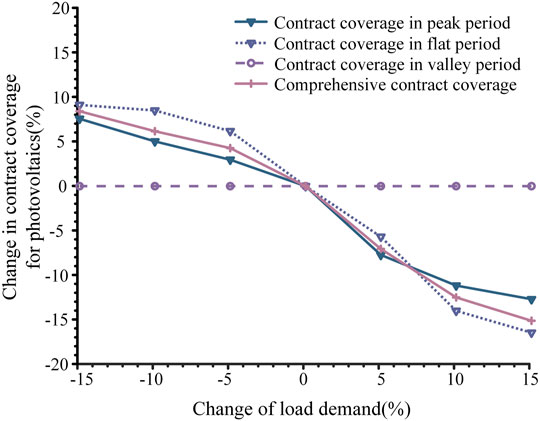
FIGURE 8. Changes in CCR for photovoltaics under different system load levels.
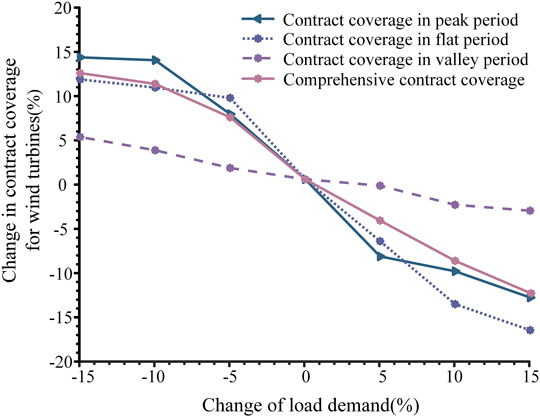
FIGURE 9. Changes in CCR of wind turbines under different system load levels.
Figures 6–9 shows that the changes in the assessment weights of the quota system and the system load level change the supply-demand relationship in the TGC market and the spot market, respectively. When the market demand exceeds the supply, the contract coverage for RES unit tends to decline.
5 Conclusion
How to realize the smooth transition from a fixed-price transaction mode to a full participation in the electricity spot market is an important issue for RES generation in the electricity market reform procedure of China. In this paper, a transition mechanism for RES units to participate in the electricity spot market considering the TGC market is presented. In this transition mechanism, the adjustment of CFD coverage for RES units is a key part of the design. By modeling the decision-making of various agents participating in the electricity spot market, a three-layer optimization model for solving the CCR is proposed, which provides a scientific basis for adjusting the CCR during the transition period. Extensive numerical experiments are conducted to manifest the feasibility and efficiency of proposed models and algorithms. The impact of the transition mechanism on the RES development is analyzed from the perspectives of short-term and medium-/long-term. The sensitivity analysis of CCR against the assessment weights and system load level shows that when the market demand exceeds supply, the CCR of RES units tends to decline.
Data Availability Statement
The original contributions presented in the study are included in the article/supplementary material, further inquiries can be directed to the corresponding author.
Author Contributions
KW, HD, and CX conceptualized the study. HD, JY, and CX performed the analysis. KW, JY, CX, and DQ performed investigations. HD and ZZ acquired resources. HD, CX, and ZZ acquired funding. KW wrote the original draft. JY, CX, and FW reviewed and edited the manuscript. All authors agreed to be accountable for the content of the work.
Funding
This study received funding from the Science and Technology Program of State Grid Zhejiang Electric Power Co., Ltd. (No. B311DS21000A).
Conflict of Interest
Authors HD, CX, and ZZ were employed by the company State Grid Zhejiang Electric Power Co., Ltd., Research Institute.
The remaining authors declare that the research was conducted in the absence of any commercial or financial relationships that could be construed as a potential conflict of interest.
Publisher’s Note
All claims expressed in this article are solely those of the authors and do not necessarily represent those of their affiliated organizations, or those of the publisher, the editors and the reviewers. Any product that may be evaluated in this article, or claim that may be made by its manufacturer, is not guaranteed or endorsed by the publisher.
References
Barbose, G., Wiser, R., Heeter, J., Mai, T., Bird, L., Bolinger, M., et al. (2016). A Retrospective Analysis of Benefits and Impacts of U.S. Renewable Portfolio Standards. Energy Policy 96, 645–660. doi:10.1016/j.enpol.2016.06.035
Dai, J., and Chen, H. (2020). Research on Transition Mechanism of Renewable Energy's Participation in Electricity Spot Market. Zhejiang Electr. Power 39 (12), 78–84.
García-Alvarez, M. T., Cabeza-García, L., and Soares, I. (2017). Analysis of the Promotion of Onshore Wind Energy in the EU: Feed-In Tariff or Renewable Portfolio Standard? Renew. Energy 111, 256–264. doi:10.1016/j.renene.2017.03.067
Gawel, E., and Purkus, A. (2013). Promoting the Market and System Integration of Renewable Energies through Premium Schemes-A Case Study of the German Market Premium. Energy Policy 61, 599–609. doi:10.1016/j.enpol.2013.06.117
Gu, F. (2020). Make Good Use of the Government Authorized Contract System to Promote the Construction of Electricity Spot Market. Chin. power Enterp. Manag. (16), 36–39.
Jiang, Y., Cao, H., Yang, L., Fei, F., Li, J., and Lin, Z. (2020). Mechanism Design and Impact Analysis of Renewable Portfolio Standard. Automation Electr. Power Syst. 44 (7), 187–199.
Kilinc-Ata, N. (2016). The Evaluation of Renewable Energy Policies across EU Countries and US States: An Econometric Approach. Energy Sustain. Dev. 31, 83–90. doi:10.1016/j.esd.2015.12.006
Kong, P., Yang, L., Hu, Z., Lin, X., and Wang, B. (2021). “Bilateral Transaction of Bayesian Game in Reformed Electricity Spot Market,” in 2021 11th International Conference on Power and Energy Systems (ICPES) (IEEE). doi:10.1109/icpes53652.2021.9683848
Li, F., and Xu, P. (2021). “Zonal Reserve Evaluation and Optimization Method in Electricity Spot Market for Power System Integrated with Wind Generation,” in 2021 IEEE Sustainable Power and Energy Conference (iSPEC) (IEEE).
Luo, C. (2016). Evolution and Trends in Global Supportive Renewable Energy Policies. Sino-Global Energy 21 (9), 20–27.
Ma, Z., Zhong, H., Tan, Z., Xia, Q., and Wang, Y. (2017). Incenting Demand and Supply of Renewable Energy with Renewable Portfolio Standard: Mechanism Design of National Renewable Energy Market. Automation Electr. Power Syst. 41 (24), 90–96.
National Development and Reform Commission and National Energy Administration Commission (2021). Notice on the 2021 Renewable Energy Power Consumption Responsibility Weight and Related Matters [Online]. Available: http://www.gov.cn/zhengce/zhengceku/2021-05/26/content_5612441.htm (Accessed February 22, 2022 2022).
National Development and Reform Commission of China (2020). Notice on Matters Concerning the 2021 Renewable Energy Feed-In Tariff Policy [Online]. Available: http://www.gov.cn/zhengce/zhengceku/2021-06/11/content_5617297.htm (Accessed Mar 24, 2022 2022).
National Development and Reform Commission of China (2021). The 14th Five-Year Plan for National Economic and Social Development of the People's Republic of China and Outline of the Vision for 2035 [Online]. Available: http://www.gov.cn/xinwen/2021-03/13/content_5592681.htm (Accessed Mar 24, 2022 2022).
Ren, X., Zhu, L., Xie, D., and Ye, B. (2022). Discussion on Key Issues of Renewable Energy Participation in the Electricity Spot Market and its Application on A Case Study. Mod. Electr. Power 1 (2), 203–211.
Schallenberg-Rodriguez, J., and Haas, R. (2012). Fixed Feed-In Tariff versus Premium: A Review of the Current Spanish System. Renew. Sustain. Energy Rev. 16 (1), 293–305. doi:10.1016/j.rser.2011.07.155
Shinde, P., Hesamzadeh, M. R., Date, P., and Bunn, D. W. (2021). Optimal Dispatch in a Balancing Market with Intermittent Renewable Generation. IEEE Trans. Power Syst. 36 (2), 865–878. doi:10.1109/tpwrs.2020.3014515
The State Council Information Office of the People’s Republic of China (2020). Energy In China’s New Era [Online]. Available: http://www.scio.gov.cn/ztk/dtzt/42313/44537/index.htm (Accessed Mar. 24, 2022 2022).
Upton, G. B., and Snyder, B. F. (2017). Funding Renewable Energy: An Analysis of Renewable Portfolio Standards. Energy Econ. 66, 205–216. doi:10.1016/j.eneco.2017.06.003
Xu, C., Wen, F., and Palu, I. (2020). Electricity Market Regulation: Global Status, Development Trend, and Prospect in China. Energy Convers. Econ. 1 (3), 151–170. doi:10.1049/enc2.12020
Yang, J., Dong, Z. Y., Wen, F., Chen, G., and Qiao, Y. (2020). A Decentralized Distribution Market Mechanism Considering Renewable Generation Units with Zero Marginal Costs. IEEE Trans. Smart Grid 11 (2), 1724–1736. doi:10.1109/TSG.2019.2942616
Zhang, L., Chen, C., Wang, Q., and Zhou, D. (2021). The Impact of Feed-In Tariff Reduction and Renewable Portfolio Standard on the Development of Distributed Photovoltaic Generation in China. Energy 232, 120933. doi:10.1016/j.energy.2021.120933
Zhang, Y., Zhao, X., Zuo, Y., Ren, L., and Wang, L. (2017). The Development of the Renewable Energy Power Industry under Feed-In Tariff and Renewable Portfolio Standard: A Case Study of China's Photovoltaic Power Industry. Sustainability 9 (4), 532. doi:10.3390/su9040532
Zhao, Y., Chen, F., Li, Z., Zhu, M., and Li, K. (2021). “Correlation Analysis between Transaction Price and Wind Power Generation Based on Copula Function,” in 2021 IEEE 2nd International Conference on Information Technology, Big Data and Artificial Intelligence (ICIBA) (IEEE). doi:10.1109/iciba52610.2021.9688290
Keywords: carbon neutral, renewable energy generation, electricity spot market, tradable green certificate, contract coverage
Citation: Wang K, Deng H, Yang J, Xu C, Zhou Z, Wen F and Qi D (2022) A Transition Mechanism for the Participation of Renewable Energy Generation Companies in Competitive Electricity Spot Markets. Front. Energy Res. 10:911872. doi: 10.3389/fenrg.2022.911872
Received: 03 April 2022; Accepted: 24 May 2022;
Published: 20 June 2022.
Edited by:
Xue Lyu, University of Wisconsin-Madison, United StatesReviewed by:
S. N. Singh, Indian Institute of Technology Kanpur, IndiaQin Wang, Electric Power Research Institute (EPRI), United States
Weijia Liu, National Renewable Energy Laboratory (DOE), United States
Copyright © 2022 Wang, Deng, Yang, Xu, Zhou, Wen and Qi. This is an open-access article distributed under the terms of the Creative Commons Attribution License (CC BY). The use, distribution or reproduction in other forums is permitted, provided the original author(s) and the copyright owner(s) are credited and that the original publication in this journal is cited, in accordance with accepted academic practice. No use, distribution or reproduction is permitted which does not comply with these terms.
*Correspondence: Fushuan Wen, d2VuZnNAaG90bWFpbC5jb20=