 Sun Zhen-zhou1,2
 Chen Jie-feng
 Lu Hong-chao
 Fan Tian-hui
- 1Key Laboratory of Far-shore Wind Power Technology of Zhejiang Province, Hangzhou, China
- 2Power China Huadong Engineering Corporation Limited, Hangzhou, China
- 3School of Civil Engineering and Transportation, South China University of Technology, Guangzhou, China
To ensure the computational accuracy for the offshore high voltage direct current substation local structure and its large and complex electrical equipment, it is necessary to reduce the modeling complexity and improve the calculation efficiency. Thus, a simplified vibration model with constant key physical parameters was established; the converter valve was used as a test design example and a lower number of samples was used. Finally, the response surface fitting was carried out. Based on the machine learning concept, problems such as the loss of physical meaning of complex system matrices and low iteration efficiency, caused by high-dimensional matrix operations were avoided. In addition, the deterministic screening experiment design greatly reduced the number of samples needed while also ensuring the second-order effect. The fit between the response surface equation and experimental results was good after optimizing the relevant design factors based on the vibration equation. The comparison between the simplified vibration converter valve model and the original complex model has shown that the errors for various physical parameters and the vibration characteristics were below 5% and that the model simplification degree was 95%.
Introduction
Within the offshore wind power industry, it is known that the traditional offshore substation cannot always meet the gradually increasing demand for larger offshore distance, capacity, and higher voltage levels. Therefore, offshore wind power relies on flexible direct-current (DC) transmission to improve its cost-effectiveness (Tang et al., 2013). Consequently, the offshore high voltage direct current (HVDC) substation has become a new core technology in offshore wind farms. Its structure and the safety of the carried precision high-voltage equipment are critical factors in the reliable offshore wind farm operation.
Generally, the structural dynamic response of HVDC is mainly studied under adverse loads, including seismic action (Sun et al., 2019) and extreme wind and wave conditions (Zhang et al., 2019), with structural safety prioritized. When modeling HVDC substation structure, the equipment model in real scale should be built accurately to obtain the stress of structural components, node displacements, and local mode/vibration, among other indicators. Those are necessary to increase the computation accuracy and are calculated for the important equipment positions (Bang et al., 2021). Further, large-scale high-voltage electrical equipment has a significant number of diverse components. For example, a converter valve tower alone (Qi et al., 2015; He et al., 2019) will greatly increase the complexity of the overall model when modeled in accordance with the design drawings. This results in a sharp decrease in computational efficiency and poor fault tolerance. Finally, it should be stated that the trade-off between the calculation model accuracy and the computation cost is a widespread problem in the structural modeling of large offshore electrical platforms.
The model simplification problem of large and complex electrical equipment is similar to the modification of the parametric model, which is employed using following two steps (Friswell and Mottershead, 1995; Schedlinski, 2000): (1) an initial model with certain parameters is selected to be modified model, and the physical characteristic parameters having little effect on the vibration are ignored; (2) the modification process is implemented to make that the physical characteristic parameters of the structure coincide with the target parameters, and then the complex structure is simplified. The traditional approach is based on the incomplete degree-of-freedom vibration data for the existing actual structure (Hu et al., 2007). System matrices such as mass and stiffness matrices are obtained through polycondensation, order expansion, and similar techniques. This way it is possible to modify the finite element model (Baruch, 2012). The premise of this method is that the finite element model is relatively complete. On the other hand, if the initial model system matrices have excessively large differences, the number of iterative operations will greatly increase (Liu and Li, 2013), making it difficult to simplify the model. Moreover, this approach is not suitable for the simplification of complex electrical equipment.
With the emergence of machine learning methods, neural networks (Sadr et al., 2017), genetic algorithms (Jung and Kim, 2013), and response surface methods (Ren and Chen, 2010)0, those advanced methods were also applied within the field. However, they are restricted by the number of samples and the measured values; unreasonable input and output parameters will adversely affect the learning time and results, causing significant deviations in results (Guo, 2017).
Aiming at the large and complex electrical equipment represented by converter valves of offshore HVDC substations, and to ensure that the model meets the accuracy requirements, a simplified reference vibration model was established. Firstly, identical 3D scales model was obtained, which had rather similar natural vibration characteristics. Secondly, the test scheme was designed and the target data sample model was obtained. Next, the response surface of each target function was computed, and finally, the error of the target value was calculated to be below 5%. The error was obtained according to the evaluation principle for response surface and by comparing the vibration characteristics. Lastly, the structural simplification degree reached 95%, indicating that the method solves the contradiction between model complexity and computational accuracy. The method can simplify the complex electrical model in the overall offshore HVDC substation, and ensure refined modeling while improving computational accuracy and efficiency. Also, the method can contribute to the integrated design of equipment-structure, which can shorten the design cycle of offshore HVDC substation and ensure its safety.
Model Simplification Based on Response Surface Method
The response surface method is an important tool to simplify the complex system, which is based on the thought of statistical method and suitable to the situation that explicit relation between the objective function and design parameters is difficult to be obtained. In essence, the key of the response surface method is regression fitting of designed parameters and objective function, which mainly includes five design stages: empirical estimation, experimental design, sample calculation, response surface fitting, and model simplification (Fei et al., 2010). The analysis process is shown in Figure 1.
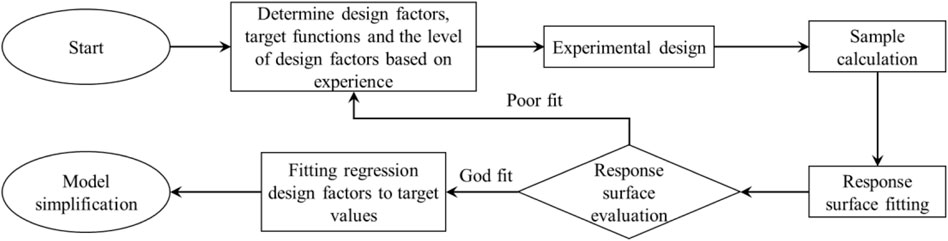
FIGURE 1. Model simplification process using response surface method.
Response Surface Model
To simplify models of large and complex electrical equipment such as converter valves, the parameters of first-and second-order natural frequency, position of the gravity center, moment of inertia, displacement, acceleration should be special focused to ensure that the vibration characteristics of the structures and model are consistent, which can be labeled as the target functions, y1, y2, ..., ym. Correspondingly, design parameters that affect target functions include but are not limited to geometric dimensions, material properties, component layout, load distribution and constraint types are labeled as design factors, x1, x2, ..., xn. In this case, the second-order response surface model can be expressed as follows (Jing, 2011):
where αi is the undetermined coefficient to represent the linear effect of the design parameter xi, αij (i ≠ j) denotes the interaction between the design parameters xi and xj, αii (i = j) represents the second-order effect of the design parameter xi, and ε is the random error.
Experimental Design
For an objective function with whole second-order response surface, there are a total of (n+1) (n+2)/2 undetermined coefficients, and the accuracy of solution is direct relative to the sample capacity. Generally, in the early learning stages, vibration models with multiple design factor levels and initial structures are determined based on either the design or calculation experience. This allows carrying out the experimental design to obtain the sample results. However, a number of the additional design factors need to be considered when simplifying the converter valve model. The application of traditional full factorial design, central composite design and Box-Behnken design will lead to a huge experiment number, which is against to the sample results acquisition (Dougles, 2003). Therefore, the definitive screening design (DSD) will be applied in the process of model simplification (Jones and Nachtsheim, 2011). The method can achieve a good balance between the experimental scale and the selection of design factors, which removes the mixture of the interaction of the two-level design factor and the main effects. Moreover, the second-order effects of all the design factors can be considered.
When constructing the DSD experimental design, the final number of experimental designs is determined depending on the odevity of the number of design parameters. Based on the fundamental of DSD, an initial design factor is randomly generated. Each odd-numbered row has one and only one column equal to 0, and the other columns are 1 or −1. Simultaneously, each even-numbered row represents a folded design of the previous row, that is, its value is equal to each value in the previous row multiplied by -1. When n is an even number, the n × n congress matrix C is formed. Meanwhile, the congress matrix C dimension is (n+1)×(n+1), when n is an odd number. The diagonal elements of congress matrix are zero and the other elements are 1 or −1. In additional, the congress matrix, C, satisfies the relationship as follows:
where m is the dimension of the congress matrix, and I denotes the unit matrix.
Based on the description above, there need to be 2n + 1 times experiments when the number of design factors is even. When the number of design factors is odd, 2n + 3 times experiments should be employed. Taking the even number of design factors as an example, the DSD experimental design is shown in Table 1.
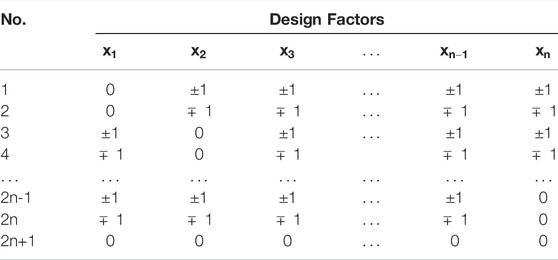
TABLE 1. The DSD experimental design with n (n is an even number) design factors.
Response Surface Evaluation
After completing the experimental design, the sample calculation and regression analysis can be implemented based on finite element software or measured data to acquire the response surface of each target function. When the response surface is obtained, the evaluation and examination of the response surface should be employed. Generally, the statistical indicators are used to evaluate the fitting degree of selected test point data and to evaluate the significance response surface function.
The complex correlation coefficient R2 is commonly regarded as the evaluation index, which ranges from 0 to 1. When the coefficient is closer to 1, it is implied that the error influence is smaller, meaning that the regression calculation results will be more accurate. It should be noted that the larger R2 doesn’t mean the more accurate established response surface model, the evaluation should consider the number of design factors. For the same number of design factors, the larger R2corresponds to the better regression fitting. The complex correlation coefficient can be calculated using following formula:
where N denotes the number of experimental designs, yi is the standard value of objective function of finite element or measured data,
To consider the influence of the design factor number, the modified complex correlation coefficient,
For the response surface model and sample data obtained using regression fitting method, the estimated value of the response surface equation,
When the value of PRESS is close to 0, the fitting effect of the response surface is relatively good.
Model Simplification
For the simplified design physical parameters of the initial vibration model
where M0 and K0 are the mass and stiffness matrices of structure; αi and βi are the coefficients related to
Sample of Converter Valve Model
The converter valve is installed in the offshore HVDC substation, the size of single converter valve is 7.92 m × 4.16 m × 10.2 m. The bottom of converter valve is supported with insulating components, and the core electronic parts and components carry on the converter valve. For an offshore HVDC substation, there are more than 20 converter valves. The converter valve and associated finite element mesh are shown in Figure 2. The model of a single converter valve contains about 4700 nodes and 5100 elements, which need to be simplified for analysis.
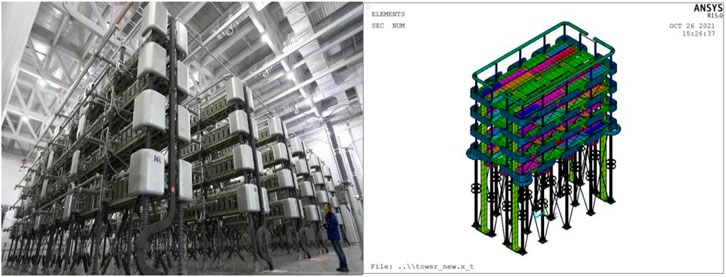
FIGURE 2. Converter valve and mesh of finite element model.
Target Design Value
Based on the basic model simplification process of the response surface method combining with the design experience, the static and dynamic characteristics of the valve tower should be considered, which include the weight, center of gravity, moment of inertia, and first- and second-order natural frequencies of the valve tower. To simplify the vibrating model as soon as possible, a simple vibration model should be established as the initial iterative model in terms of design factors.
To minimize the number of design factors, the size of the design is consistent with the actual structure, and the material density of all elements are set as 1.0 kg/m3. The center of gravity and weight of the overall structure were adjusted by controlling the position and mass of particles, and. The center of gravity and the structure moment of inertia are adjusted by changing the position of barycenter of the structure, and the natural frequencies are controlled by adjusting the stiffness of braces in different directions. Finally, the design factors of the desired objective function are determined, as shown in Figure 3.
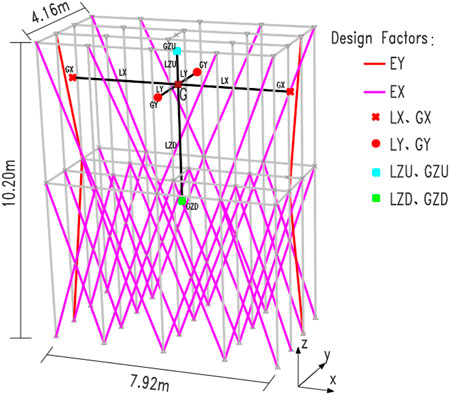
FIGURE 3. Schematic diagram of the design factors.
Based on the objective parameters of initial vibrating system model, the decentration of xy plane of the structure is known by presupposing the eccentric mass points,. Symmetrically arranged mass points in the x and y directions were adjusted to control the moment of inertia change. The eccentric mass was set along the z-direction to reduce the range of center of gravity height, while the remaining mass points were set to fine-tune its height. The LX, LY, LZU, and LZD denote the distances from the mass points to the G point, GX, GY, GZU and GZD denote the control weight for moment of inertia in x, y, z directions. Finally, the target parameters of converter valve tower from a actual project are shown in Table 2.
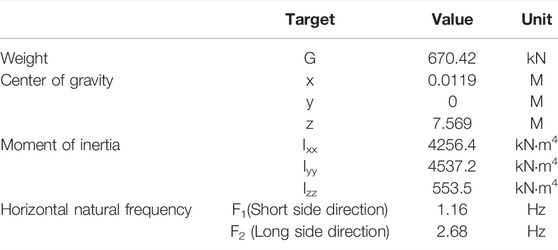
TABLE 2. Target design value of the converter valve.
The DSD Design Factors and Sample Computation
There are ten design factors are considered in this case. The range of design factors are listed in Table 3 according to the initial iterative model and design experience. Based on the DSD experimental design method, a total of 21 sets of design experiments are designed when n is an even number, and each design factor having three levels. The commercial software SACS (SACS User’s Manual, 2017) is applied to establish the finite element model of each set of design factors, and the experiment results can be obtained based on the computed sample results. The experimental design and sample calculation results are shown in Table 4, where Izz is 537.8 kN m4.
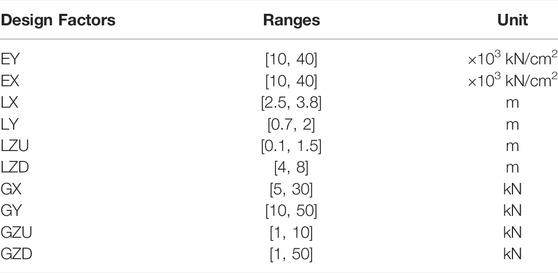
TABLE 3. Value range of each design factor.
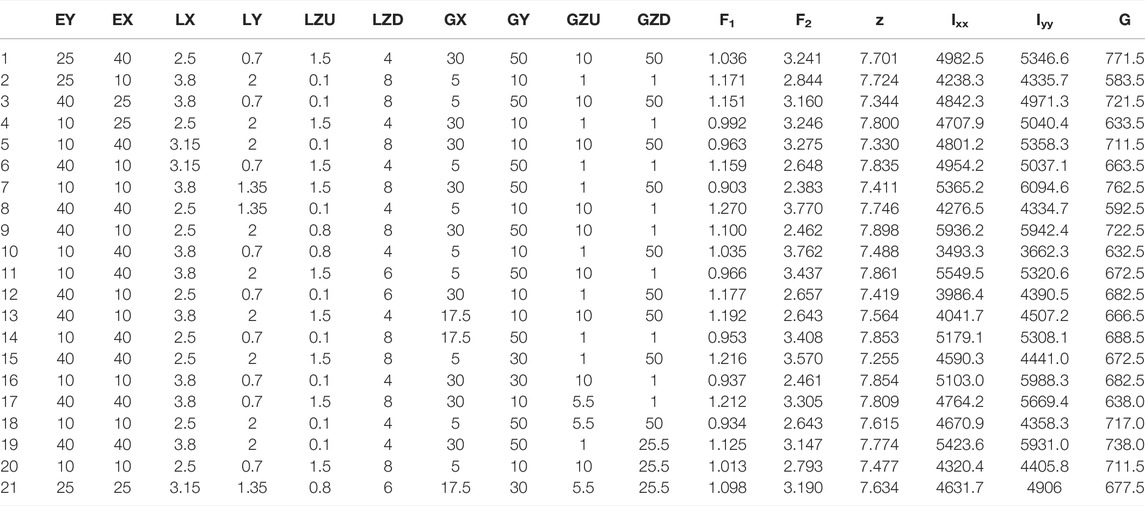
TABLE 4. Experiment design and sample computational results.
Simplification of Converter Valve Model
Response Surface Fitting and Evaluation
Taking the first-order natural frequency as an example, the fitting of response surface is employed by reducing the relative design factors at the objective values based on physical relationship. For a multiple degree of freedom structure, the natural frequencies are calculated using following formula (Clough, 1995):
where Φ denotes the modal vector and
Base on Eq. (7), the design factors that influence the mass and stiffness are considered in the process of response surface fitting, that is, EY, EX, GX, GY, GZU, and GZD. Aiming to improve the fitting accuracy, a complete second-order response surface is evaluated in the first fitting, which contains a total of 27 items. Based on the variance analysis trial, we find that the complete quadratic effects among the EX2 and various mass points are unrelated to design parameters. When the p-values of EY GX, EY GZD, and EX GZD are larger than 0.05, the corresponding design factors are not the key design factors. After removing these terms, the fitting can be reemployed and the response surface equation can be obtained as follows:
When checking the response surface using Eqs. 3 and (4), the modified complex correlation coefficient and correlation coefficient can be obtained, which are
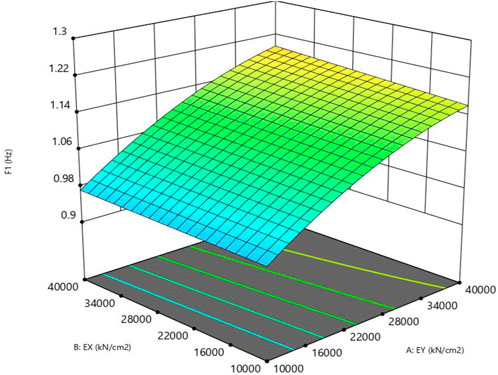
FIGURE 4. Response surface curve of.
Based on the same processes, the response surface curves of objective factor scan be solved one by one. Due to the Z-direction mass points distributed during the establishment of the initial vibration model, all the various design factors cannot directly affect the z-axis moment of inertia, so the target has no response surface curve. The error of
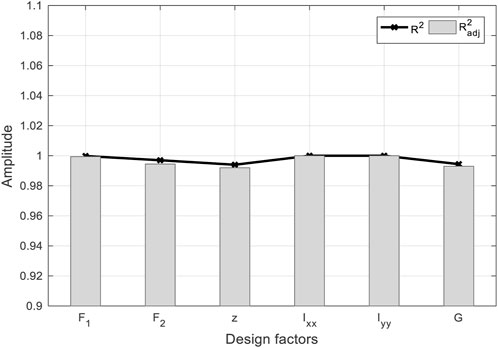
FIGURE 5. Error diagrams of
To further illustrate the prediction accuracy of the response surface, the 21 sets of experimental designs are implement regression fitting and the results will be compared with the computed values of the samples. The error of sample and predicted results is shown in Figure 6, which indicates that the errors of both the moments of inertia Ixx and Iyy are approximately 0. The largest error occurs in the response surface of the target function G, which is still less than 2.5%. The reason of the results is that the response surface only takes the mass of the mass point as the design factor, however, the position of the mass point is determined by the length of the rod component in the actual structure, and the variation in the mass of the rod itself is not counted by the response surface of the objective function. The result also reflects that the mass variation effect caused by the rod length is very small, which can be ignored in the process of simplifying the response surface model.
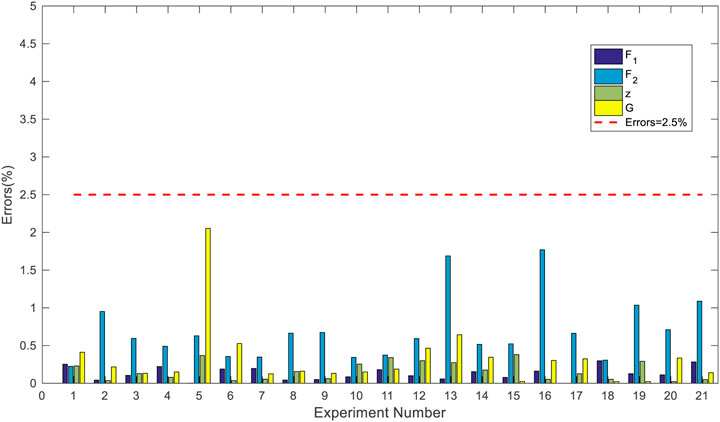
FIGURE 6. Error between sample and predicted results. Model simplification for the converter valve.
After obtaining the response surface model of objective functions with good evaluation, the design factors can be obtained using inverse regression based on the known objective functions and the response surface models. Because the coefficient matrix of equations is not full rank matrix, the fitted design factors of simplified model have not the unique solution. Based on the confidence level, the combination of design factors with the highest confidence is selected to simplify the vibration model. For this computation case, there are 12 design factor groups with the confidence close to 1, which are ranked from the high to low values and listed in Table 5. The first set of design factors is applied to simplify the model of vibrating system, and the simplified model is reconstructed.

TABLE 5. Design factors with confidence close to one.
Implementing modal analysis to the simplified converter valve, the first two modes are shown as Figure 7. The first-order mode represents a translation vibration along the short side, and the second-order is a translation vibration along the long side of the converter valve, which are consistent with the original model. The final target results are listed in Table 6. It can be observed that the maximum absolute error amongst each objective value is only 3.36%, which indicates that the simplified vibration model has good accuracy. Moreover, the number of simplified pole units is only 177 and the number of nodes is 89, which shows that the degree of simplification is up to 96.5%.
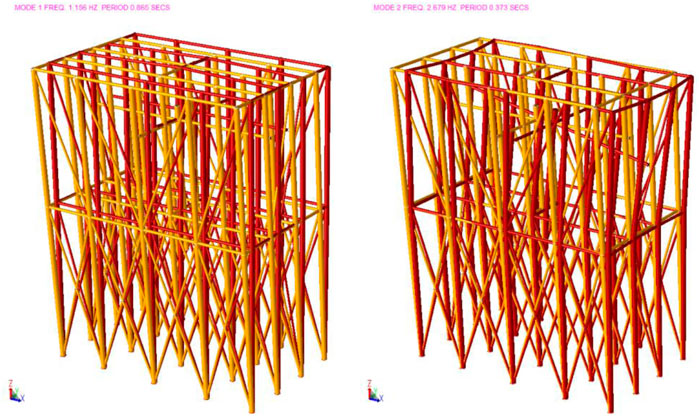
FIGURE 7. Diagram of the first- and second-order modes of the simplified model.

TABLE 6. Simplified vibration model error.
The reason for this result is that: based on engineering experience and the initial finite element model, the system matrix dimension could be simplified by the proposed method. And then, with the good response surface fitting, the highest confidence of simplified result is filtered out from the target values. Through the design factors regressing, the small scale characteristic matrix could be obtained, which correspond to the final simplified model. For offshore HVDC substation, the advantage of the process is that: it could ensure refinement of local model in global model as well as high computation efficiency of the global model.
Conclusion
1) Based on the response surface method, the converter valve vibration model of the offshore HVDC substation is simplified. The target value relative errors of physical parameters including the first- and second-order modal parameters were below 5%, while the simplification degree was over 95%.
2) When considering the second-order effects of design factors, the DSD experimental design greatly reduces the number of required sample model calculations. The correlation coefficients
3) Based on the dynamic relationship to screen design factors and use the fitting of the objective value using response surface, the regression efficiency and accuracy of response surface is improved. Meanwhile, the calculation error caused by the mass deviation due to the change of the rod length can be ignored.
Data Availability Statement
The raw data supporting the conclusions of this article will be made available by the authors, without undue reservation.
Author Contributions
SZ, LW, and ZS contributed to conception and design of the study. LH provided the numerical model and program codes. CJ wrote the first draft of the manuscript. LX and FT revised the manuscript. All authors contributed to manuscript revision, read, and approved the submitted version.
Funding
The authors wish to acknowledge the financial support of the Open Fund of Key Laboratory of Far-shore Wind Power Technology of Zhejiang Province (Grant Nos. ZOE2021003), the financial support of the National Natural Science Foundation of China (Grant Nos. 52001126, 52071145), the Science and Technology Project in Guangzhou, China (Grant Nos. 202102021053), the Natural Science Foundation of Zhejiang province, China (Grant Nos. LQ21E090010), the Funds for Marine Economic Development of Guangdong, China [Grant Nos. GDNRC(2021)39].
Conflict of Interest
Authors SZ-Z, LW, ZS-X, CJ-F were employed by the company Power China Huadong Engineering Corporation Limited.
The remaining authors declare that the research was conducted in the absence of any commercial or financial relationships that could be construed as a potential conflict of interest.
Publisher’s Note
All claims expressed in this article are solely those of the authors and do not necessarily represent those of their affiliated organizations, or those of the publisher, the editors and the reviewers. Any product that may be evaluated in this article, or claim that may be made by its manufacturer, is not guaranteed or endorsed by the publisher.
References
Bang, S., Kim, H.-S., Koo, J.-H., and Lee, B.-W. (2021). Consideration of the Insulation Design Method on a ±200 kV Converter Valve Unit in an HVDC Converter Hall. Energies 14 (8), 2296. doi:10.3390/en14082296
Baruch, M. (2012). Optimization Procedure to Correct Stiffness and Flexibility Matrices Using Vibration Data. AIAA J. 16 (11), 1208–1210. doi:10.2514/3.61032
Fei, Q. G., Han, X. L., and Su, H. L. (2010). Response Surface Based Finite Element Model Updating and its Application. J. Vib. Meas. Diagnosis 30 (2), 132–135. doi:10.13197/j.eeev.2013.05.128.hanjp.016
Friswell, M. I., and Mottershead, J. E. (1995). Finite Element Model Updating in Structural Dynamics. Norwell: Kluwer Academic Publishers.
Guo, N. (2017). Research on Integrated Global/local Structural Dynamic Model Updating Method. Xi’an: Northwestern Polytechnical University.
He, C., Xie, Q., Yang, Z., and Xue, S. (2019). Seismic Performance Evaluation and Improvement of Ultra-high Voltage Wall Bushing-Valve Hall System. J. Constr. steel Res. 154, 123–133. doi:10.1016/j.jcsr.2018.11.016
Hu, S.-L. J., Li, H., and Wang, S. (2007). Cross-model Cross-Mode Method for Model Updating. Mech. Syst. Signal Process. 21 (4), 1690–1703. doi:10.1016/j.ymssp.2006.07.012
Jing, Y. J. (2011). Research on Dynamic Model Updating Technology for Complex Structures Based on Response Surface Methodology. Wuhan: Wuhan University.
Jones, B., and Nachtsheim, C. J. (2011). A Class of Three-Level Designs for Definitive Screening in the Presence of Second-Order Effects. J. Qual. Technol. 43 (1), 1–15. doi:10.1080/00224065.2011.11917841
Jung, D.-S., and Kim, C.-Y. (2013). Finite Element Model Updating of a Simply Supported Skewed PSC I-Girder Bridge Using Hybrid Genetic Algorithm. KSCE J. Civ. Eng. 17 (3), 518–529. doi:10.1007/s12205-013-0599-z
Liu, F., and Li, H. (2013). A Two-step Mode Shape Expansion Method for Offshore Jacket Structures with Physical Meaningful Modelling Errors. Ocean. Eng. 63, 26–34. doi:10.1016/j.oceaneng.2013.01.030
Qi, L., Wang, X. X., Li, C., Wang, G., Cui, X., and Gao, C. (2015). Electric Field Simulation and Optimization of ±1100kV HVDC Converter Valve in Insulation Type Test. High. Volt. Eng. 41 (4), 1262–1271. doi:10.13336/j.1003-6520.hve.2015.04.025
Ren, W.-X., and Chen, H.-B. (2010). Finite Element Model Updating in Structural Dynamics by Using the Response Surface Method. Eng. Struct. 32 (8), 2455–2465. doi:10.1016/j.engstruct.2010.04.019
Sadr, M. H., Astaraki, S., and Salehi, S. (2007). Improving the Neural Network Method for Finite Element Model Updating Using Homogenous Distribution of Design Points. Arch. Appl. Mech. 77 (11), 795–807. doi:10.1007/s00419-007-0129-x
Schedlinski, C. (2000). “Computational Model Updating of Large Scale Finite Element Models,”; in Proceedings of IMAC-XVIII: Aconference on Structural Dynamics, Proc. SPIE 4062, 476–482.
Sun, Z. Z., Bi, C. W., Zhao, S. X., Dong, G. H., and Yu, H. F. (2019). Experimental Analysis on Dynamic Responses of an Electrical Platform for an Offshore Wind Farm under Earthquake Load. J. Mar. Sci. Eng. 8 (7), 279. doi:10.3390/jmse7080279
Tang, G. F., He, Z. Y., and Pang, H. (2013). Research, Application and Development of VSC-HVDC Engineering Technology. Automation Electr. Power Syst. 37 (15), 3–14. doi:10.7500/AEPS20130224003
Keywords: response surface, model simplification, vibration characteristics, offshore HVDC substation, experimental design
Citation: Zhen-zhou S, Wei L, Sheng-xiao Z, Xiao-chen L, Jie-feng C, Hong-chao L and Tian-hui F (2022) Simplified Method for Vibration Model of Converter Valve in Offshore HVDC Substation Based on Response Surface. Front. Energy Res. 10:909377. doi: 10.3389/fenrg.2022.909377
Received: 31 March 2022; Accepted: 13 June 2022;
Published: 11 July 2022.
Edited by:
Anna Rutgersson, Uppsala University, SwedenReviewed by:
Puyang Zhang, Tianjin University, ChinaMingsheng Chen, Wuhan University of Technology, China
Copyright © 2022 Zhen-zhou, Wei, Sheng-xiao, Xiao-chen, Jie-feng, Hong-chao and Tian-hui. This is an open-access article distributed under the terms of the Creative Commons Attribution License (CC BY). The use, distribution or reproduction in other forums is permitted, provided the original author(s) and the copyright owner(s) are credited and that the original publication in this journal is cited, in accordance with accepted academic practice. No use, distribution or reproduction is permitted which does not comply with these terms.
*Correspondence: Li Xiao-chen, bGl4aWFvY2hlbkBzY3V0LmVkdS5jbg==