 Jennifer R. Glenn
 Grace A. Lindquist2
 George M. Roberts
- 1Nel Hydrogen, Wallingford, CT, United States
- 2Department of Chemistry and Biochemistry, Univeristy of Oregon, Eugene, OR, United States
Post-operation component disassembly and observation of electrolyzer parts is useful in understanding the interactions of the components and the electrochemical environment beyond the systems electrochemical output. We report a standard protocol for post-operation component disassembly and observation, including directions for cell-component preservation, preliminary visual inspection of cell components, and a guide for the advanced inspection of specific components with suggestions for further analysis if necessary. The procedures outlined here allow for a standardized method that can be used and compared between different laboratories and for literature comparison to experimental results.
1 Introduction
Water electrolysis for green hydrogen production is expected to scale substantially in the coming decade as the global renewable energy economy develops (Pivovar et al., 2018). While multiple established water electrolysis technologies exist at various stages of commercialization and scale (Ayers et al., 2019), component-specific development is still needed to improve performance and decrease capital and operating expenses. Many components used in electrolysis are adapted from other systems, for example fuel cells, and thus may not be the ideal design for an electrolyzer environment where water and gas transport needs differ dramatically. With increased interest in electrolyzers, research efforts toward electrolyzer-specific components have increased. These specialized components have enabled improved efficiency, longer system lifetimes and lower costs.
Multiple protocols specific to low-temperature electrolysis systems have been published. However, these are specific to individual components, such as catalysts (Alia and Denilovic, 2022; Creel et al., 2022), porous transport layers (PTLs) (Quimet et al., 2022), or membranes (Arges et al., 2022; Wang et al., 2022). Once a material passes this initial screening, the next step is to understand the operational performance in a full cell. Interactions between different components may alter performance or introduce additional stresses not observed ex-situ.
Limited information can be obtained from electrochemical analysis of full-cell electrolysis systems, as cells are complex and all components contribute to the total observed current-voltage response. Thus, post-operation analysis of test stacks and cells reveal additional information regarding how each component is contributing to cell performance. The concept of post-operation component disassembly and observation is not new, however the best practices for doing so reproducibly, in-house and across laboratories, is lacking. This article provides a standard protocol for post-operation component disassembly and observation of electrolyzer cells that were tested at a small scale, benchtop size and for short durations of less than 8 h. The protocol is applicable to both proton exchange membrane (PEM) and anion exchange membrane (AEM) systems and will cover cell/component preservation and storage, a workflow for the preliminary visual inspection of components, and advanced component specific analysis with recommendations for further analysis. As the primary analysis in this protocol is visual, the indications of degradation that are key to determining failures or the necessity for further analysis include changes in physical appearance such as color changes or tactile texture differences, delamination of electrodes from components, holes or cracking of components, etc. Guidance regarding how to present the data so that it is replicable and comparable between laboratories is also discussed.
2 Protocol scope
2.1 Scope and applicability
This procedure is intended to provide guidelines and best practices for diagnosing component failure in operated low-temperature electrolyzer cells for both PEM and AEM systems. The components covered in this protocol are present in both PEM and AEM systems and are typically made of the same or similar materials, apart from the membranes. While the membranes differ in composition, the analysis process is similar enough to be compared here. Instructions for disassembling cell hardware, labeling and preserving cell components, and diagnostic test methods for these components are discussed. This procedure is primarily designed for a bench-top, short-duration, single-cell water electrolyzer system, but it is possible to adapt the procedure for other cell hardware and multi-cell stacks.
2.2 Summary of method
This protocol describes the component disassembly, preservation, and ex-situ testing of the following electrolyzer components: membrane/catalyst coated membrane (CCM), carbon gas diffusion layer (GDL), porous transport layer (PTL), gaskets, and the bipolar/cell plate. The component disassembly and initial observation procedure will cover the disassembly of the cell, marking all relevant inlets/outlets to preserve the orientation of components within the cell, preparation of components for ex-situ testing when necessary, and suggestions for further ex-situ analysis.
2.3 Personnel qualifications/responsibilities
All personnel must be trained to handle chemicals and to mitigate chemical hazards. Training and familiarity with the test stand equipment and cell components is necessary for all personnel.
2.4 Health and safety warming
2.4.1 Chemical hazards
Standard personal protective equipment, including safety glasses, lab coat and gloves, must be worn at all times. Ensure that all gas cylinders used in the experiments are properly secured and regulated. Ensure that any gas venting lines are located in a well-ventilated area such as a hood. If the experiment used nanoparticles, take additional appropriate precautions as nanoparticles are frequently found to be more reactive than their parent compound.
2.4.2 Electrical hazards
Before disassembling the cell, check that the power source is turned off and disconnected, and that the cell is discharged to prevent personal injury and the potential to short the cell during disassembly.
2.4.3 Heat hazard
Allow the cell stack to cool before handling to prevent injury due to contact with hot cell components, metal cell components are excellent conductors of heat.
2.4.4 Sharp edges
Wear latex or nitrile gloves at all times to protect against any sharp edges of stack components.
2.5 Equipment and supplies
The supplies listed below are suggested tools for this component disassembly and initial observation test protocols; depending on the testing, additional equipment and supplies may be necessary:
Storage container suitable for containing liquids
Deionized (DI) water compliant with ASTM Standard D 1193-99e1 Type 1 or 2
Latex or nitrile gloves
Stainless steel or plastic spatula
Light table
Benchtop optical microscope with a recommended resolution of at least ×10
Camera
3 Procedure
3.1 Entire cell preservation procedure
This procedure is typically used to preserve cells during the extraction process when immediate examination of the components is not possible.
1) Remove all components from the test setup without separating components. One repeat unit consisting of each of the components will be referred to as a cell from this point forward. For the purpose of this protocol, a cell contains gasketing, gas diffusion layer, membrane, porous transport layer and bipolar/cell plate. An illustration of the cell components is displayed in Figure 1. If there are any visible changes during operation that may be disrupted when submerging in water, make a note and consider photographing the cell.
2) Place the entire cell in a watertight container with sufficient DI water to keep the CCM hydrated.
a) Note: The components may shift from their original position over time depending on the type of container used. If this is of concern, mark the components (such as with a dull pencil) to indicate orientation.
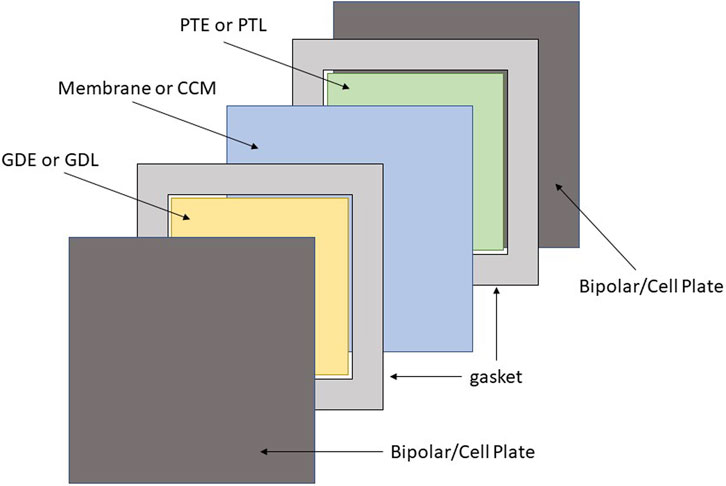
FIGURE 1. Illustration of the cell components including bipolar/cell plate, gaskets, GDE or GDL, Membrane or CCM, and the PTE or PTL displayed in dark grey, light grey, yellow, blue and green respectively.
3.2 Preliminary visual inspection of cell components
Note: Always wear latex or nitrile gloves when handling cell components to prevent contamination.
1) Remove all components from the test hardware as one cell (one repeating unit) if cells have not already been preserved (Section 3.1). It is easier to separate parts outside of the test hardware.
2) Place cell components on a clean surface, where they will not be exposed to other chemicals or contaminants.
3) Disassemble each cell component in order of their stack up in the cell starting at your preferred side of the cell. When removing each part gently mark the orientation of the parts by a distinguishing factor of the cell (ex. Voltage tab, flow direction, etc.) using a dull graphite pencil or an ink marker. A spatula can be utilized to help separate cell components; however, care must be taken to not inflict damage on the cell components during this initial evaluation. Note any damage that occurs from the cell disassembly.
a) Note: For wet materials a dull graphite pencil is recommended for marking as it will not bleed like an ink pen would; however, the mark will wear off over time if exposed to excessive rubbing or water flow. Use a dull pencil to prevent puncturing any delicate cell components. If the component is dry and will not be stored in a wet environment, an ink marker is also appropriate.
b) Note: Unless intending to complete water content sampling on the membrane, keep the membrane hydrated with DI water during this process.
4) Visually inspect any cell components for differences relative to new unoperated cell hardware. Some differences may be expected due to operation, which would be indicated from historical data. One example of this is impressions on gasket materials made from neighboring cell components. Historical data is useful in these cases to determine if this is a “normal” operational difference or a larger/unusual difference that would indicate a failure. Using the same example of impression in a gasket material, this could mean that the impression is greater than usual, a different shape, resulting in tears that are not typically observed, etc.
a) Note: Collecting images of difference is a good way to compare to historical data and useful in reporting damage. It is recommended that new components are also analyzed as part of this historical data for comparison. All images should contain a scale bar of some form for reference. (i.e., scale bar provided by imaging source, ruler or comparison to an object of known size such as monetary coins which have standardized dimensions).
5) If inspection of parts ends after visual inspection, reassemble cell components in original order and orientation, and store in watertight container with DI water to keep the membrane hydrated. If it is more appropriate to store the components separately, ensure that the membrane is stored in an airtight container with DI water and the components that do not require hydration are stored so that they remain clean and free of additional contamination.
3.3 Component-specific analysis
This protocol applies to the teardown of two configurations: GDL-CCM-PTL and GDE-PEM or AEM -PTE.
1) GDL-CCM-PTL: Gas Diffusion Layer – Catalyst Coated Membrane – Porous Transport Layer (catalyst is on the membrane, Figure 2A)
2) GDE—PEM/AEM—PTE: Gas Diffusion Electrode – Proton Exchange Membrane or Anion Exchange Membrane – Porous Transport Electrode (catalyst layer is on the gas diffusion layer and porous transport layer, Figure 2B)
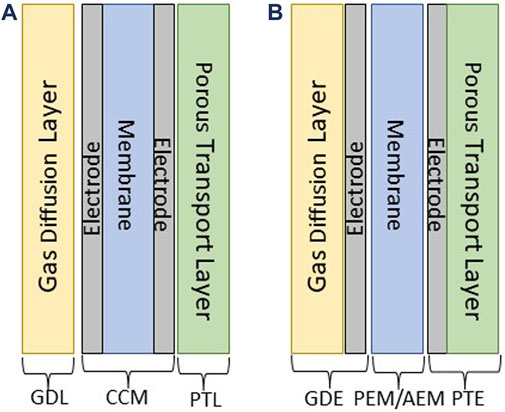
FIGURE 2. Illustration of (A) GDL-CCM-PTL and (B) GDE-PEM/AEM-PTE configurations respectively.
3.3.1 Membrane/electrode
1) Mark PEM/AEM or CCM with a graphite pencil or ink marker (discussion in Section 3.2 sub-bullet 3) to indicate the orientation within the cell.
2) Visually inspect PEM/AEM or CCM for discoloration and, in the case of an CCM, electrode dissolution. If present, additional testing may be required suggestions for which are made in Section 3.4.
3) Visually and tactilely inspect membrane for unusual wrinkling. This potentially indicates under or over hydration of the membrane and/or a possible water flow issue.
4) Place PEM/AEM or CCM on a light table. If light shows through the electrode, an electrode void or pinhole in the membrane may be present. For PEM/AEM without an electrode (e.g. the catalyst layers were applied to the GDL and PTL), a pinhole may be more difficult to identify as there will not be as significant of a color difference.
5) To differentiate between an electrode void and a pinhole, inspect the membrane under an optical microscope.
6) If an electrode void is not present and a pinhole is suspected but not visually identifiable under an optical microscope, blot the membrane surface dry, and put DI water under the membrane in the suspected area. If a pinhole is present DI water will pass through the hole to the membrane surface.
a) Note: This technique does not always work if the pinhole is too small. One strategy to find such a pinhole is to pressurize one side of the membrane while covering the other side with DI water. If there is a small pinhole bubbles will appear in the water at the location of the pinhole. This can help identify an area of interest, which can then be examined closer.
7) If a pinhole is identified, a cross section of the area of interest can be taken and observed under a higher resolution microscopy instrument to confirm the pinhole along with its size and possibly its source.
a) Figure 3 illustrates an example of a large hole present in an CCM (Millet et al., 2012). This is an extreme example, and many pinholes are much smaller.
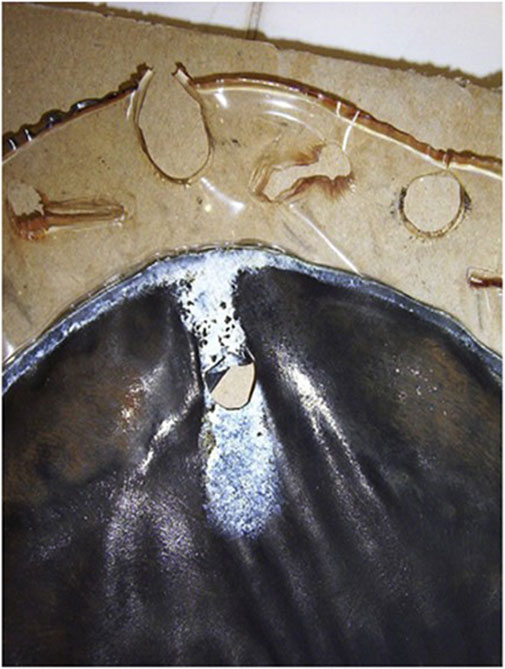
FIGURE 3. An extreme example of a hole present in a membrane post-operation. Reproduced with permission from Millet et al. (2012).
3.3.2 Gas diffusion layer and porous transport layer
1) Mark carbon gas diffusion layer and/or metal porous transport layer with a graphite pencil or ink marker (see discussion in Section 3.2 sub-bullet 3) to indicate orientation within the cell.
2) Visually inspect the GDL or PTL for damage or transfer of electrode material either onto the GDL/PTL from the CCM or from the GDE/PTE to the membrane if the electrode was applied directly to the GDL/PTL.
3) Inspect any areas of interest under an optical microscope or a high-resolution microscopy instrument if appropriate.
3.3.3 Gaskets
1) Mark gasket(s) with a graphite pencil or ink marker (see discussion in Section 3.2 sub-bullet 3) to indicate orientation within the cell.
2) Visually and tactilely inspect gasket for any discoloration, increased indentations, wrinkles, tears or stretching.
a) Potential reasons for discoloration include material transfer from another cell component, contamination, or a temperature event.
b) Increased indentations, wrinkling, tears or stretching can be a result of a pressure event or unevenly applied load.
3.3.4 Bipolar/cell plate
1) Mark bipolar/cell plate with a graphite pencil or ink marker (see discussion in Section 3.2 sub-bullet 3) to indicate orientation within the cell if the plate does not already have an orientation-defining feature.
2) Visually and tactilely inspect bipolar/cell plate for any discoloration, new or different indentations, cracking, etc.
a) Potential reasons for discoloration include material transfer from another cell component, oxidation of the plate depending on the material it is composed of, or a temperature event.
b) New or different indentations and cracking may indicate that a pressure event occurred or that an uneven load was applied to the cell.
c) Figure 4 depicts discoloration of a bipolar/cell plate due to corrosion (Feng et al., 2017).
d) Figure 5 demonstrates an extreme example of damage caused by a thermal event (Millet et al., 2012).
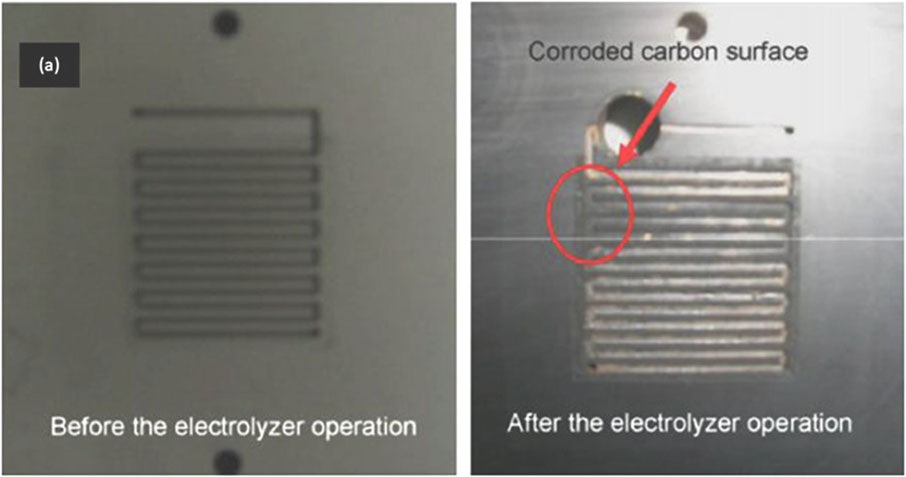
FIGURE 4. Example of a bipolar/cell plate that has incurred corrosive damage after electrolyzer operation (right) as compared to the bipolar/cell plate before electrolyzer operation (left). Reproduced with permission from Feng et al. (2017).
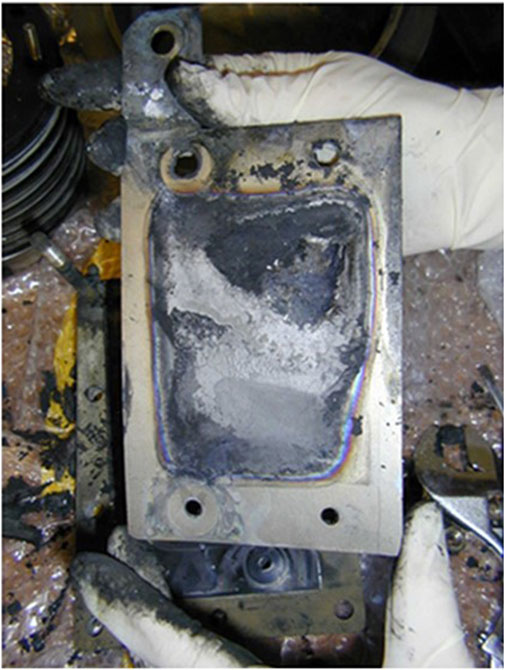
FIGURE 5. Bipolar/cell plate that has been damaged by a thermal event. Reproduced with permission from Millet et al. (2012).
3.4 Suggestions for advanced characterization
After visual inspection and proper documentation, additional testing and characterization may be warranted. These tests will be cell-specific and should be conducted only if necessary at the discretion of the analyzer. The additional testing and characterization discussed here are suggestions by the authors and as such are not intended to be an inclusive list of potential testing and will not cover the procedures for each characterization method in exhaustive detail.
3.4.1 Water sampling
Water sampling is useful if contamination or low water quality are known or suspected. This testing may include tests such as total organic carbon (TOC), inductively coupled plasma (ICP) metals scans, nonvolatile reactants (NVR), etc. (Watts et al., 1982; Meyer, 1987; Bisutti et al., 2004) For TOC and ICP testing SEM 5310 B, C and D and EPA 200.7 are recommended respectively. NVR is a test involving the evaporation of the water and measurement of the residue; however, the complete procedure is outside the scope of this protocol. General instructions for water sample collection will be provided below.
1) Collect water samples from the water reservoir if the water in the system recirculates or the water outlet of the stack if it does not recirculate. It may also be advisable to collect water samples pre-circulation in systems that recirculate water or the water inlet for the stack for non-recirculating systems if a blank measurement is desired.
a) Note: Some testing may require special sampling containers to take accurate measurements. For example, water samples for TOC analysis must be stored in a container that will not leach organic carbons into the water sample prior to testing. Additionally, biological sampling may be time sensitive. Check all analysis protocols for specific sampling requirements prior to collecting samples.
2) Prepare water samples appropriately for the chosen analysis technique.
a) If contaminants are suspected in extremely small quantities, it may be necessary to concentrate the sample prior to analysis. If the sample is concentrated, this must be reported with the data to accurately assess the contaminant level.
Note: Some contaminants of concern and common to electrolyzers include iron, cobalt, chromium, zinc, chlorine, and sodium. However, this is not an exhaustive list. When considering potential contaminants, it is helpful to create a list of material compositions for the components as well as the materials used in the test setup.
3.4.2 Component-specific: membrane/electrode
1) Discoloration: In case of component discoloration further investigation may be warranted, such as SEM coupled with EDS or XRF (this will only identify elements with fluorescent properties) to determine if the discoloration is due to contaminants or elemental transfer from another cell component.
b) Note: For AEM cells if any further testing requires the membrane be dried, the membrane must be ion exchanged out of the OH− counter-ion form. During drying, the nucleophilicity of OH− increases and may cause chemical degradation of the polymer. To ion-exchange, follow manufacturer recommendations for OH− operation but instead replace the hydroxide solution with the same concentration chloride solution. For example, if a manufacturer recommends soaking in 1 M KOH for 24 h, soak the membrane in 1 M NaCl for the same amount of time prior to drying.
2) Electrode Dissolution: The degree of electrode dissolution can be determined with a calcination test, provided the initial loading was known. (Kuntze, 2009). This test is destructive.
3) Small Features: SEM can also be used to observe smaller features on the surface of the PEM/AEM or CCM and to view the PEM/AEM or CCM in cross-section if it is suspected that a defect penetrates the sample. Note that this testing would be destructive unless the full sample is small enough to fit in the SEM. Depending on the material of the PEM/AEM or CCM, a gold or conductive carbon coating might be advisable as organic materials are less stable under the electron beam required for this analysis.
a) Figure 6 is an example of how a cross-section of an CCM observed with SEM can help identify delamination of the catalyst (Feng et al., 2017).
b) Figure 7 demonstrates how SEM can be used to observe topographical features on a PEM/AEM or CCM and how cross-section can be used to determine how/if a feature affects the layers of the PEM/AEM/CCM (LaConti et al., 2006).
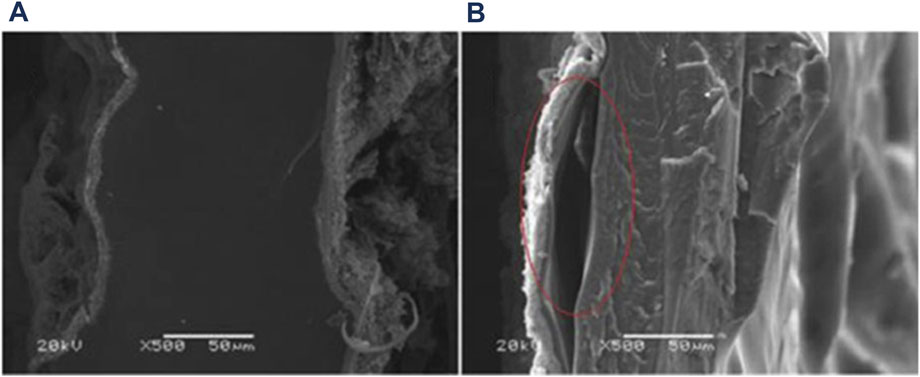
FIGURE 6. SEM micrographs of cross-sections of (A) CCM with a well adhered electrode layer and (B) an electrode layer that is starting to delaminate. Reproduced with permission from Feng et al. (2017).
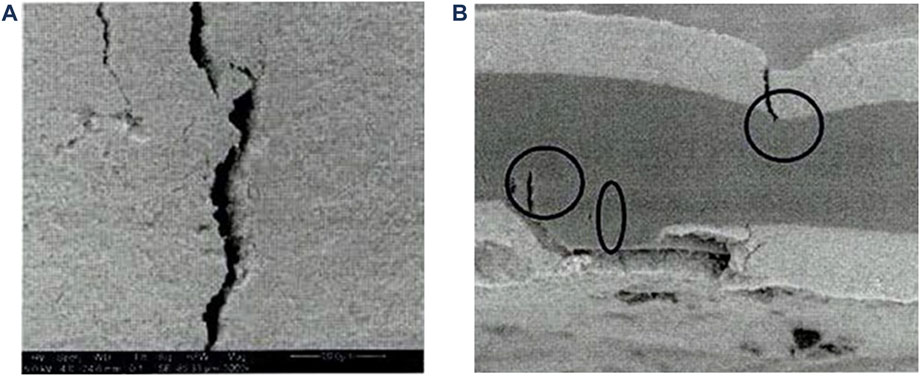
FIGURE 7. Morphology of an CCM investigated using SEM to observe the surface topography. (A) The surface of the CCM displaying a crack in the electrode layer. (B) A cross-sectional micrograph displaying how the electrode cracking is penetrating the CCM and the beginning of a pinhole/tearing of the membrane. Reproduced with permission from LaConti et al. (2022).
3.4.3 Component-specific: gas diffusion layer and porous transport layer
1) Coating Retention: If a coating was applied to either the carbon gas diffusion layer or the porous transport layer, assess the retention of that layer through imaging techniques or thickness measurements.
a) A few examples of ways to do thickness measurements include: XRF elemental thickness if your instrument has this function and the coating is a fluorescent material, measurement with a micrometer that has an appropriate measurement range for the expected coating thickness, cross-sectional measurements of coatings via SEM (cracking samples with liquid nitrogen is recommended to reduce the chance of compression of the coating from cutting), optical profilometry or X-ray photoelectron spectroscopy.
b) An example of using SEM for cross-sectional measurements of coating thickness is displayed in Figure 8 (Frensch et al., 2019).
2) Material Density: The relative density of the material and/or coating can be determined through flow-through testing or bubble-point testing. Use an applicable standard for comparison of the results.
a) Flow Through Testing—While attached to a vacuum set-up, time how long it takes for a set amount of water to pass through the GDL or PTL with or without electrodes applied.
b) Bubble Point Testing—Pressurize one side of the GDL or PTL while covering the other side with an appropriate solvent (i.e., DI water or isopropanol). The pressure at which bubbles start to appear is considered the initial bubble point, and when the bubbling resembles a rolling boil the full bubble point has been reached.
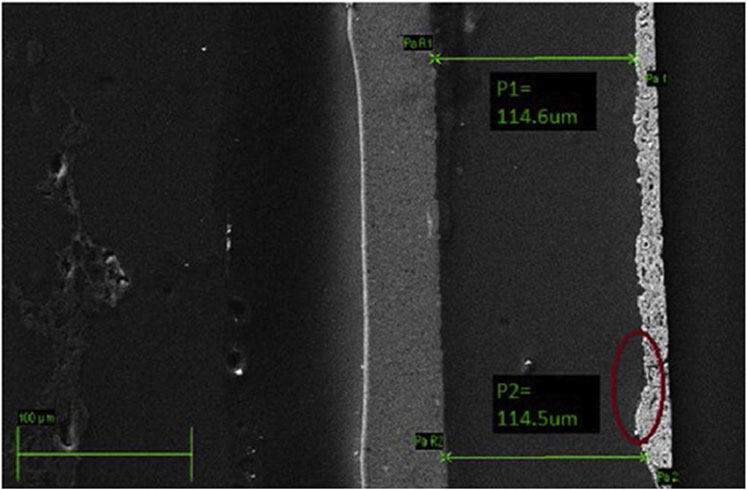
FIGURE 8. SEM micrograph exemplifying how cross-sectioning of samples can be used to measure component thicknesses. This example is of an CCM, but the technique can be extended to GDEs and PTEs as well. Reproduced with permission from Frensch et al. (2019).
4 Instrument, methods, and results reporting formats
Throughout this protocol numerous experimental methods and analytical instrumentation have been called out as suggested analysis routes for further/additional investigation. If further/additional investigation is necessary and the suggested techniques or others are utilized, use appropriate instrument or methods calibration and standards for the technique as outlined by instrument procedures, additional standard operating procedures or any industrial standards that are being followed. Historical data should be cataloged for comparison, for how the cell components are expected to look before and after operation and what the test results are for a known good test. For example, if an ICP metals scan is being collected for a water sample of stack/cell that is suspected to have contamination, it would be beneficial to have historical data of the ICP metals for a water sample of a stack/cells that have not been operated and a stack/cells that are known to not contain any contaminants so that the level of contamination can be compared to what is “normal” for the system.
When reporting the results of any post-operation component analysis, it is important to report the data in a reliable, reproducible manner. It is essential due to the qualitative nature of the analysis to report how the analysis was done and provide as much information as possible. This can be done by providing the experimental details of how data is collected and/or by pointing to standard analysis protocols that were followed. Also state any standard materials that were used for comparison, either as technique/instrument standards or a comparison to the standard “normal” for the specific system. If providing such standards is prohibited by the need to protect proprietary information, the authors suggest providing a statement such as the following “These results have been compared to proprietary internal standards/results and were determined/observed to ….” and add an appropriate comparison of the results. Include references to the instrumentation and the setting used for any advanced analysis in addition to the technique standards for ease of reproducibility by others. Sample size information should be provided or the data normalized by reporting values per active area (or component area) whenever possible so that comparison may be made between samples of different platform size. Some examples of this would include stating the overall stack voltage is for a cell stack of x number of cells, the NVR as grams/sample area, ICP results as mg/L, etc. By including the information discussed above there will be more transparency regarding how the results were collected, their significance, and how the results compare to other experimental results not only within one’s own laboratory but between laboratories leading to better understandings and comparability of data.
4.1 Reminders to prevent common issues
Wear latex or nitrile gloves while handling all cell components to prevent transfer of any potential contaminants to the cell components, especially if the components will be analyzed for chemical contamination. Change gloves between any other tasks involving substances incompatible with the cell (e.g. oils, lubricants, etc.) and working with cell parts. It may also be necessary to change gloves more frequently if cell components have the potential to contaminate one another, one example of which would be if handling the different electrodes is suspected to leave residue on the gloves resulting in transfer to the other electrode during handling.
When collecting samples, in particular water samples, ensure that the sampling method/sample containers are compatible with the analysis technique (e.g., plastic versus glass, use of preservatives, filling process, etc.).
Some forms of analysis will negate the testing of others; ensure that your test plan takes this into consideration. For example, it is suggested to do all non-destructive testing first as destructive testing may not allow for further testing of the material in part or as a whole.
Data availability statement
The original contributions presented in the study are included in the article/supplementary material, further inquiries can be directed to the corresponding author.
Author contributions
JG wrote the body of the article and GL wrote the introduction. GL and SB edited the article and proofed the sections regarding AEM electrolysis. GR and KA edited the article and proofed the sections regarding PEM electrolysis.
Funding
The authors would like to acknowledge the U.S. Department of Energy and the funding support from project DOE-DE-EE0008092, “Benchmarking Advanced Water Splitting Technologies: Best Practices in Materials Characterization”.
Conflict of interest
The authors declare that the research was conducted in the absence of pany commercial or financial relationships that could be construed as a potential conflict of interest.
The handling editor BB is currently organizing a Research Topic with the author(s) KA.
Publisher’s note
All claims expressed in this article are solely those of the authors and do not necessarily represent those of their affiliated organizations, or those of the publisher, the editors and the reviewers. Any product that may be evaluated in this article, or claim that may be made by its manufacturer, is not guaranteed or endorsed by the publisher.
Abbreviations
PEM, Proton Exchange Membrane; AEM, Anode Exchange Membrane; CCM, Catalyst Coated Membrane; GDL, Gas Diffusion Layer; GDE, Gas Diffusion Electrode; PTL, Porous Transport Layer; PTE, Porous Transport Electrode; SEM, Scanning Electron Microscopy; EDS, Energy Dispersive Spectroscopy; XRF, X-ray Fluorescence Spectroscopy; TOC, Total Organic Carbon; ICP, Inductively Coupled Plasma; NVR, Non-Volatile Reactants.
References
Alia, S. M., and Denilovic, N., “Rotating disk electrode standardization and best practices in acidic oxygen evolution for low temperature electrolysis”, Front. Energy Res., 2022, Provisionally Accepted. doi:10.3389/feng.2022.857663
Arges, C. G., Ramani, V., Wang, Z., and Ouimet, R. J. (2022). Assessing the oxidative stability of anion exchange membranes in oxygen saturated aqueous alkaline solutions. Front. Energy Res. 10, 871851. doi:10.3389/fenrg.2022.871851
Ayers, K., Danilovic, N., Oiumet, R., Carmo, M., Pivovar, B., and Bornstein, M., “Perspectives on low-temperature electrolysis and potential for renewable hydrogen at scale”, Annu. Rev. Chem. Biomol. Eng., 2019, 10, 219–239. doi:10.1146/annurev-chembioeng-060718-030241
Bisutti, I., Hilke, I., and Raessler, M. (2004). Determination of total organic carbon – An overview of current methods. TrAC Trends Anal. Chem. 23, 716–726. doi:10.1016/j.trac.2004.09.003
Creel, E. B., Lyu, X., McCool, G., Quimet, R. J., and Serov, A. (2022). Protocol for screening water oxidation or reduction electrocatalyst activity in a three-electrode cell for alkaline exchange membrane electrolysis. Front. Energy Res. 10, 871604. doi:10.3389/fenrg.2022.871604
Feng, Q., Yuan, X.-Z., Liu, G., Wei, B., Zhang, Z., Li, H., et al. (2017). A review of proton exchange membrane water electrolysis on degradation mechanisms and mitigation strategies. J. Power Sources 366, 33–55. doi:10.1016/j.jpowsour.2017.09.006
Frensch, S. H., Fouda-Onana, F., Serre, G., Thoby, D., Araya, S. S., and Kær, S. K. (2019). Influence of the operation mode on PEM water electrolysis degradation. Int. J. Hydrogen Energy 44, 29889–29898. doi:10.1016/j.ijhydene.2019.09.169
Kuntze, R. (2009). Calcination processes. Gypsum:Connecting Sci. Technol., 37–60. doi:10.1520/MNL11585M
LaConti, A. B., Liu, H., Mittelsteadt, C., and McDonald, R. C. (2006). Polymer electrolyte membrane degradation mechanisms in fuel cells – findings over the past 30 years and comparison with electrolyzers. ECS Trans. 1, 199–219. doi:10.1149/1.2214554
Meyer, G. A. (1987). ICP: Still the panacea for trace metal analysis? Anal. Chem. 59 (23), 1345A–1354A. doi:10.1021/ac00150a001
Millet, P., Ranjbari, A., de Guglielmo, F., Grigoriev, S. A., and Auprêtre, F. (2012). Cell failure mechanisms in PEM water electrolyzers. Int. J. Hydrogen Energy 37, 17478–17487. doi:10.1016/j.ijhydene.2012.06.017
Pivovar, B., Rustagi, N., and Satyapal, S. (2018). Hydrogen at scale (H2 @ scale): Key to a clean, economic, and sustainable energy system. Electrochem. Soc. Interface 27, 47–52. doi:10.1149/2.F04181if
Quimet, R. J., Young, J. L., Schuler, T., Bender, G., Roberts, G. M., and Ayers, K. E. (2022). Measurement of resistance, porosity, and water contact angle of porous transport layers for low-temperature electrolysis technologies. Front. Energy Res. 10, 911077. doi:10.3389/fenrg.2022.911077
Wang, L., Rojas-Carbonell, S., Hu, K., Setzler, B. P., Motz, A. R., Ueckermann, M. E., et al. (2022). Standard operating protocol for ion-exchange capacity of anion exchange membranes. Front. Energy Res. 10, 887893. doi:10.3389/fenrg.2022.887893
Keywords: teardown analysis, electrolyzer, membrane, gas diffusion layer, porous transport layer, electrode
Citation: Glenn JR, Lindquist GA, Roberts GM, Boettcher SW and Ayers KE (2022) Standard operating procedure for post-operation component disassembly and observation of benchtop water electrolyzer testing. Front. Energy Res. 10:908672. doi: 10.3389/fenrg.2022.908672
Received: 30 March 2022; Accepted: 20 July 2022;
Published: 19 August 2022.
Edited by:
Brendan Bulfin, ETH Zürich, SwitzerlandReviewed by:
Andries Kruger, Schaeffler, GermanyHiroshi Ito, National Institute of Advanced Industrial Science and Technology (AIST), Japan
Copyright © 2022 Glenn, Lindquist, Roberts, Boettcher and Ayers. This is an open-access article distributed under the terms of the Creative Commons Attribution License (CC BY). The use, distribution or reproduction in other forums is permitted, provided the original author(s) and the copyright owner(s) are credited and that the original publication in this journal is cited, in accordance with accepted academic practice. No use, distribution or reproduction is permitted which does not comply with these terms.
*Correspondence: Jennifer R. Glenn, amdsZW5uQG5lbGh5ZHJvZ2VuLmNvbQ==