 Zhanbin Lin
- School of Management, Guangdong University of Technology, Guangzhou, China
In order to improve the accuracy of the short-term prediction of building energy consumption, this study proposes a short-term prediction model of building energy consumption based on the CEEMDAN-BiLSTM method. In this study, the energy consumption data of an office building in 2019 are selected as a sample, and CEEMDAN is used to decompose the energy consumption data into multiple components, and the strong correlation components are selected and sent to the BiLSTM network. The final energy consumption prediction results are obtained by superimposing the prediction results of each sub-component, and five models are built simultaneously to compare the errors with the proposed models. The results showed that the weather type has a great influence on the accuracy of energy consumption prediction. When the weather fluctuates greatly, the prediction error of energy consumption by a single prediction model is large. When the weather suddenly changes, the EMD-LSTM model has a big error in the prediction of air conditioning energy consumption. After CEEMDAN decomposition of energy consumption data, more detailed components can be extracted, which makes the BiLSTM prediction algorithm more accurate. Compared with the CEEMDAN-LSTM model, the CEEMDAN-BiLSTM model reduces eRMSE, eMAPE, and eTIC by 4.1%, 9.441, and 1.3%, respectively. The proposed model can effectively improve the accuracy of short-term prediction of building energy consumption.
Introduction
In the past few decades, with the acceleration of urbanization, the demand for building energy has greatly increased. The question as to how to reduce building energy consumption has attracted researchers’ attention (Ding et al., 2021; Somu et al., 2021). However, there are many factors affecting energy consumption, and building energy prediction is still a complicated task (Yakut and Zkan, 2020; Han et al., 2021; Oh, 2021). An important means of building energy conservation and emission reduction is fine management of building energy consumption, and the basis of this work is an accurate prediction of building energy consumption so as to support the optimal management of building operation and achieve the goal of energy conservation and emission reduction.
At present, there are two main prediction methods of building energy consumption, including the physical modeling method and the artificial intelligence method. Physical-based modeling methods can be divided into simplified engineering algorithms and comprehensive methods. Simplified engineering algorithms mainly include the full-load operation method and degree-day method. Comprehensive methods use thermodynamic equations to accurately calculate building energy consumption (Khattari et al., 2020; Runge and Zmeureanu, 2019). However, physical methods usually require a large number of detailed inputs of buildings and their environment, such as the heating system, ventilation system, air conditioning system, insulation thickness, thermal characteristics, internal occupancy load, and solar energy information (Pinanggih et al., 2021).
In the field of building energy prediction, an artificial neural network, as an effective method to predict the relationship between data input and output, has entered the researchers’ field of vision. The artificial neural network is a novel computing method based on the human neural activity, which is suitable for dealing with complex linear and nonlinear mapping problems. Because of its powerful nonlinear mapping capability, the neural network has gained more and more recognition in the engineering field (Shapi et al., 2020). The literature (Runge and Zmeureanu, 2019) summarizes the application of artificial neural networks in the hourly prediction of building energy consumption, and the results showed that the neural network model has achieved good results in single-step and multi-step prediction. The literature (Ma et al., 2018) based on historical meteorological data shows that the support vector machine model is used to predict the monthly electricity consumption of buildings, and it is stated that the accuracy of the support vector machine is better than that of the neural network. The literature (Li et al., 2009) based on using the SVM algorithm to predict the hourly load of a single office building shows that the root mean square error is only 1.17%, and the prediction effect is good. The literature report by Wang et al. (2018) optimizes the parameters of the short-term model of building energy consumption by the cross-validation method. The literature results (Bagnasco et al., 2015) based on using multilayer perceptron to predict the electricity consumption of hospital facilities according to meteorological data and time changes showed that the artificial neural network performs better in winter. The literature by Neto and Fiorelli (2008) compares the neural network with the EnergyPlus energy simulation tool, and the results showed that the neural network has higher prediction accuracy.
Many achievements have been made in the aforementioned research, but each method has some limitations. Physical prediction methods need to rely on detailed building and historical meteorological data information, but it is difficult to obtain detailed operational data in building structures to determine relevant parameters, and the calculation process is prone to deviation, which leads to unsatisfactory prediction results. Although the artificial intelligence method does not need to know the specific principle of energy consumption deeply, the traditional neural network algorithm has a slow convergence speed, serious local over-fitting, and limited scope of application. In order to better improve the accuracy of building sub-item energy consumption prediction, this study classifies the weather types, uses the CEEMDAN method to carry out the modal decomposition of energy consumption historical data, and sends the strong correlation components to the BiLSTM neural network. In order to verify the prediction accuracy of the CEEMDAN-BiLSTM model, BP, SVR, LSTM, EMD-LSTM, and CEEMDAN-LSTM models were established simultaneously and compared with the proposed model. The results clearly showed the accuracy of the proposed prediction model. The prediction method of building energy consumption based on deep learning proposed in this study can provide a reference for related research and application of building energy consumption prediction.
Principle of the CEEMDAN and BiLSTM Algorithm
Principle of the CEEMDAN Algorithm
Empirical mode decomposition (EMD) is to decompose data into multiple IMF components according to the fluctuation scale of data series, but modal aliasing is easy to occur when decomposing nonlinear and non-stationary sequences. The ensemble empirical mode decomposition (EEMD) adds white noise with different amplitudes to the original sequence to suppress the aliasing phenomenon to a certain extent, but the calculation efficiency of EEMD is low. Therefore, this study adopts the self-adaptive noise complete empirical mode decomposition method, which adds white noise with different amplitudes to each component to obtain the optimal IMF component (Ali et al., 2021). The CEEMDAN method has lower iteration times than the EEMD method and also solves the problem of modal aliasing. The steps of CEEMDAN are as follows.
1) Gaussian white noise with different amplitudes is added to the original signal
where
2) EMD decomposition is carried out on the ith signal
3) The first-order residual
4) The first-order modal component IMF2 is calculated as follows:
Here,
5) The first IMF can be obtained by calculating the
The component
6) When the surplus is no longer decomposed, the highest order of IMF is obtained. At this point, the original signal is
BiLSTM Layer Model Structure
Recurrent neural networks (RNNs) can be modeled according to the inherent characteristics of time series and can store information before and after collecting data, but the RNN model has the problem of gradient explosion or gradient disappearance. LSTM solves the gradient problem of the RNN by adding a gate controller and memory unit in the hidden layer.
The first step of LSTM is to calculate the forgotten information. The energy consumption data of the current module and the output A of the energy consumption data of the previous module are taken as inputs, and the state of the pre-neuron cells is mapped to the
The second step of the LSTM model is to calculate the memory information. The input is the current building energy consumption data
The third step of the LSTM model is to select the output value. The output neuron state
The LSTM model enhances the memory of neurons through three gating units, discards useless information, and solves the problem of long dependence. However, the LSTM model cannot make full use of the data information before and after building sub-item energy consumption, so this study uses the BiLSTM model to identify the features of modal components. The BiLSTM neural network can obtain complete data information before and after energy consumption. The front layer LSTM obtains the intrinsic characteristics of the building energy consumption data in front: the back-layer LSTM obtains the intrinsic characteristics of the building energy consumption data in the back and finally combines the two to obtain the building energy consumption data characteristics. The formulae are as follows:
Among them,
CEEMDAN-BiLSTM Coupling Model
The data series of energy consumption is affected by many factors and belongs to nonlinear and non-stationary signals. Therefore, this study puts forward the CEEMDAN-BiLSTM prediction model. First, the sub-energy consumption sequence was decomposed into multiple sub-components by the CEEMDAN method, and the strong correlation sub-components were screened out for normalization. Then, the strong correlation components were sent into the BiLSTM model to obtain the predicted values of the sub-components. Finally, the predicted values of the sub-components were reversely normalized to obtain the final energy consumption prediction results. The CEEMDAN-BiLSTM model structure is shown in Figure 1.
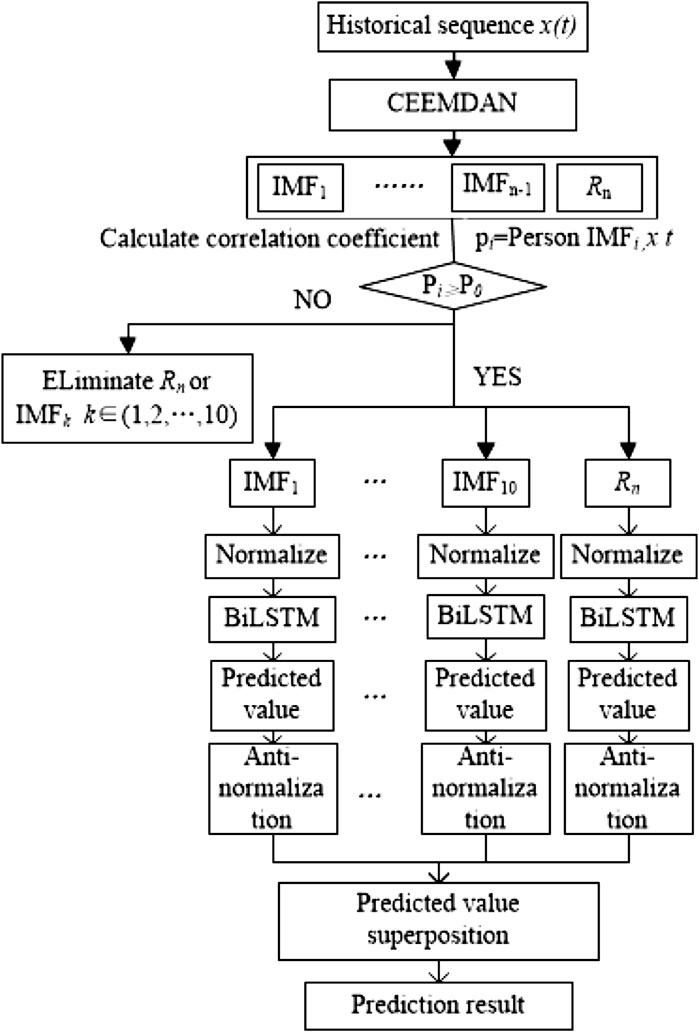
FIGURE 1. CEEMDAN-BiLSTM model framework structure diagram.
The specific modeling process is as follows:
1) CEEMDAN decomposition
The original energy consumption sequence x(t) is decomposed into multiple IMF and residual components Rn by the CEEMDAN method.
2) IMF component screening
Calculate the Pearson correlation coefficient of the original sequence x(t) and each sub-component, and the formula is as follows:
where pi represents the Pearson correlation coefficient of two continuous variables, and n is the number of subcomponents. P0 is the threshold of the correlation coefficient, and strong correlation components can be screened out according to p0.
3) BiLSTM network prediction
In order to avoid the influence of different dimensions of energy consumption series after CEEMDAN decomposition, the strong correlation components are normalized. The specific parameters of the BiLSTM model are set as follows: in order to prevent over-fitting, dropout is set to 0.5; the absolute error function is the loss function, tanh is the activation function, adam is the optimization function, and the training times are set to 1,000 times. The LSTM layer node number is set to 50; the batch size is set to 72.
Building Sub-Item Energy Consumption Prediction Model
Modeling Classification Basis
Building energy consumption consists of air conditioning energy consumption, lighting energy consumption, and power energy consumption. The energy consumption of air conditioning is mainly composed of air conditioning terminals, cold and hot stations, and other pieces of equipment. Lighting energy consumption mainly consists of landscape lighting, corridors, emergency, and lighting equipment. Power consumption is mainly composed of fans, elevators, and water supply devices. Moreover, the energy consumption of lighting power has a strong correlation with the work and the rest of the staff, and the energy consumption of air conditioning has a certain trend with the seasons and temperatures. Analysis of a specific load of energy consumption shows that when the weather changes, lighting, air conditioning, and ventilator equipment will also be adjusted accordingly, and when the weather suddenly changes, the energy consumption of each sub-item will also fluctuate greatly.
Because the energy consumption of buildings is quite different between abrupt weather and non-abrupt weather, the weather is divided into abrupt weather and non-abrupt weather according to the meteorological classification index. The itemized short-term prediction process of building energy consumption based on the CEEMDAN-BiLSTM model is shown in Figure 2. The following are selected as characteristic quantities: 24 h of the day, outdoor hourly average relative humidity, hourly average wind speed, outdoor hourly average temperature, holidays, and weather changes. In order to improve the accuracy of the forecast, abrupt weather and non-abrupt weather are subdivided into four weather types. The historical data of lighting energy consumption, air-conditioning energy consumption, and power energy consumption of different weather types are decomposed by CEEMDAN so as to become a stable energy consumption series. Different meteorological factors are added to the decomposed strong correlation subcomponents as the prediction conditions of the BiLSTM model. The predicted values of sub-components are reversely normalized and superimposed to obtain the final energy consumption prediction result.
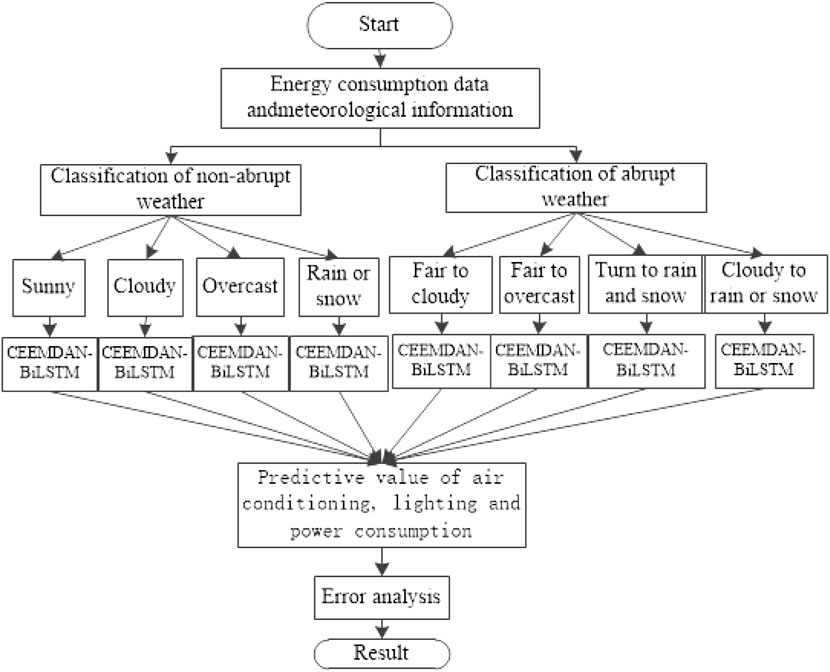
FIGURE 2. CEEMDAN-BiLSTM model prediction process.
Evaluating Indicator
Synchronous BP, SVM, LSTM, EMD-LSTM, and CEEMDAN-LSTM models are established, and the calculation accuracy is compared with the proposed models. The average absolute percentage error eMAPE, root mean square error eRMSE, and Hill inequality coefficient eTIC are selected to evaluate the model accuracy, and the expressions are as follows (18)∼(20).
where z is the purpose of the test sample, y′ is the predicted value of building energy consumption, and y is the actual value of building energy consumption.
Results and Discussion
The effectiveness of the CEEMDAN-BiLSTM model is verified by the weather conditions and energy consumption data of an office building in Fuzhou, Fujian Province in 2019. According to statistics, there were 273 abrupt weather days in Central Africa in 2019, including 111 sunny days, 47 cloudy days, 53 overcast days, 62 rainy days and 92 abrupt weather days. In non-abrupt weather, considering sunny weather as an example for analysis, 25 days were selected as training samples and 8 days as test samples in sunny weather. For a sudden change in weather, the weather from sunny to rainy is considered as an example. Among the 16 days of weather from sunny to rainy, 12 days were selected as training samples and 4 days as test samples.
The forecast results of lighting, air conditioning, and power consumption in sunny weather are shown in Figures 3A–C. In sunny weather, the fluctuation of the building energy consumption curve is small, and the change in energy consumption has certain regularity. Except for BP and SVM models, the other four models all showed good prediction effects. In the prediction curves of air-conditioning energy consumption and power energy consumption, it can be observed that the LSTM model based on the CEEMDAN method has the highest fitting degree to the curve, and the prediction effect of the combined model is obviously better than that of the single prediction model. The forecast results of each sub-item energy consumption under abrupt weather conditions are shown in Figures 3D,F. Under abrupt weather conditions, affected by various meteorological factors, the energy consumption curve fluctuates greatly, and the predicted power of each model deviates from the actual power. After the sudden change of weather, the predicted value of the lighting energy consumption of the BP neural network is lower than the actual energy consumption. Compared with the other two combined models, the EMD-LSTM model has more chaotic curves, resulting in larger errors.
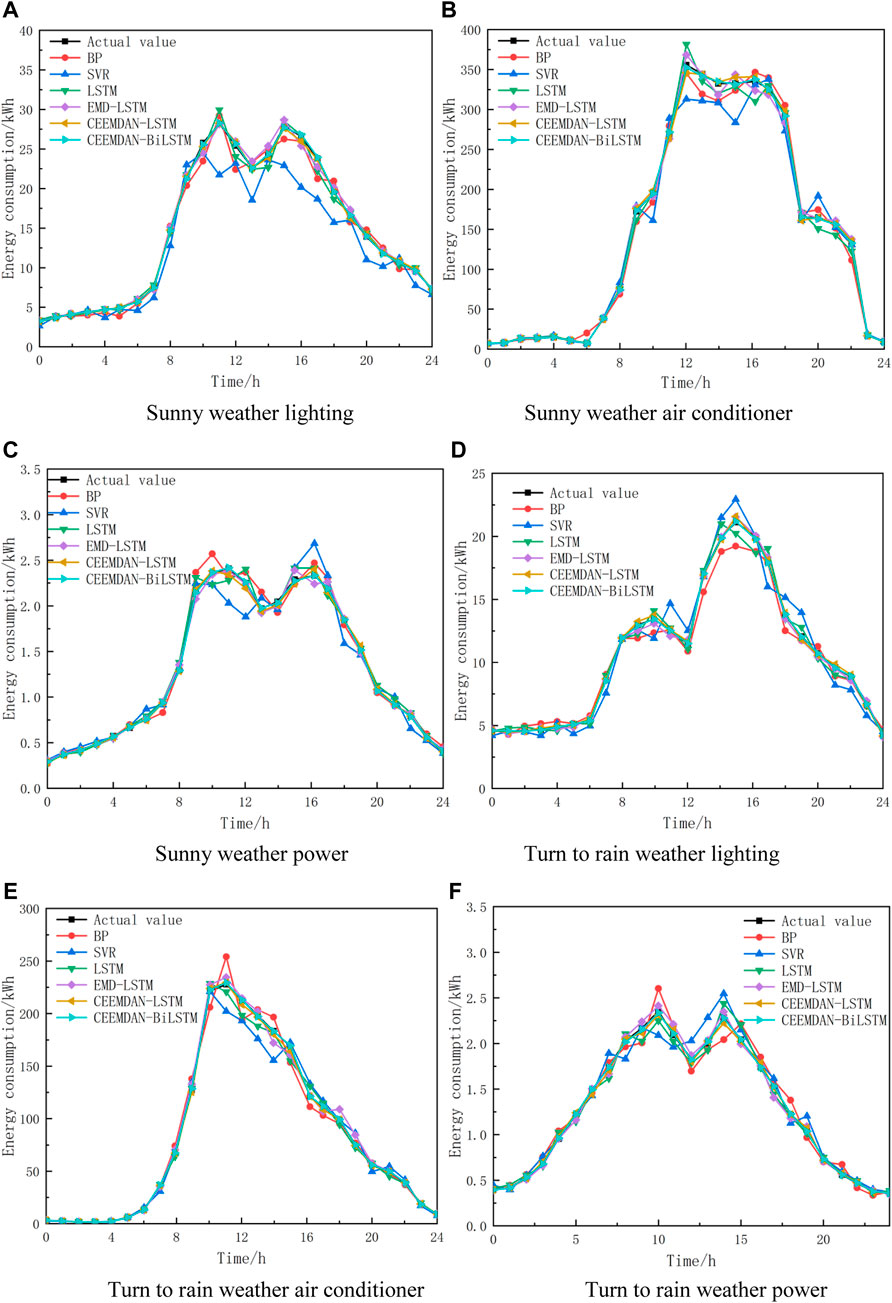
FIGURE 3. Prediction results of different models. (A) Sunny weather lighting. (B) Sunny weather air conditioner. (C) Sunny weather power. (D) Turn to rain weather lighting. (E) Turn to rain weather air conditioner. (F) Turn to rain weather power.
In order to compare the prediction effects of each model more accurately, the errors of the six models are plotted in Table 1. In sunny weather, most indexes of the combined model based on the LSTM algorithm are better than those of the single model. According to the analysis of the prediction results of lighting energy consumption, it can be seen that the eRMSE, eMAPE, and eTIC indexes of the four deep learning models have little difference. Compared with EMD-LSTM and CEEMDAN-LSTM, the eMAPE value of the CEEMDAN-BiLSTM prediction model is reduced by 2.4 and 1.9%, respectively. CEEMDAN-LSTM model has obvious performance advantages in predicting air-conditioning energy consumption. Compared with EMD-LSTM and CEEMDAN-LSTM combined models, the eRMSE of the CEEMDAN-LSTM model is reduced by 6.6 and 1.1%, respectively, the eMAPE is reduced by 36.512 and 12.065, respectively, and the eTIC is reduced by 4.1 and 1.1%, respectively. The LSTM model is not sensitive enough to power consumption, while EMD-LSTM, CEEMDAN-LSTM, and CEEMDAN-BiLSTM models extract curve details through modal decomposition, which makes the prediction algorithm more accurate. Under abrupt weather conditions, both BP and SVM prediction models have large errors in energy consumption. The combination model has an excellent prediction effect on lighting energy consumption and power energy consumption. In this comparison in a smaller numerical range, the combination model can be used directly. The CEEMDAN-BiLSTM model has the best performance in the short-term hourly prediction of air conditioning energy consumption, and the eMAPE value is reduced by 14.4, 23.3, 9.3, 8.1, and 4.4%, respectively, compared with BP, SVM, LSTM, EMD-LSTM, and CEEMDAN-LSTM models, that is, CEEMDAN decomposition improves the prediction performance of the model to a certain extent. After the power consumption data is decomposed by CEEMDAN, the details that can be extracted by the LSTM network and BiLSTM network are further increased, so CEEMDAN has a positive effect on energy consumption prediction.
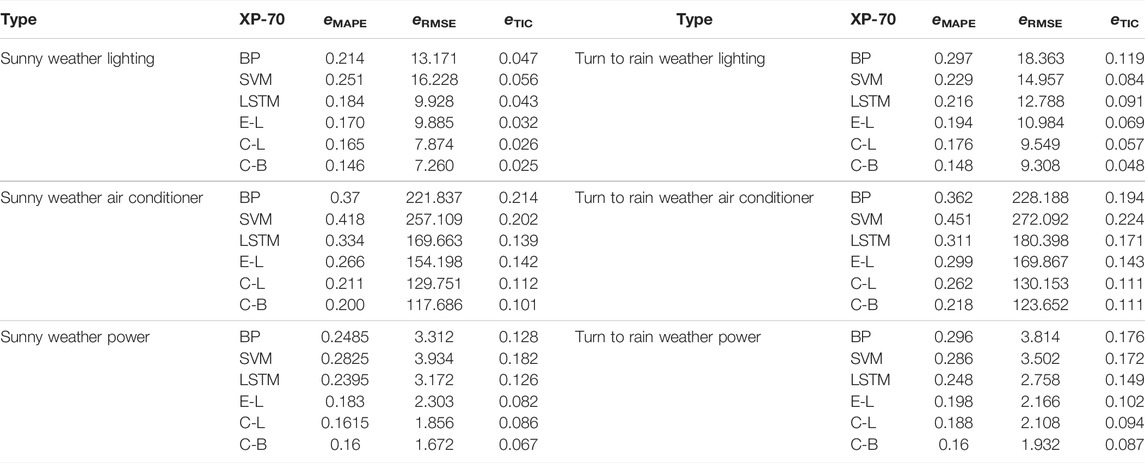
TABLE 1. Prediction errors of different models.
In this study, the predicted values and effective values of all test samples of building energy consumption are counted. Compared with the CEEMDAN-BiLSTM model, the CEEMDAN-LSTM model reduces eMAPE, eRMSE, and eTIC by 4.1, 9.441, and 1.3%, respectively. In other words, after CEEMDAN modal decomposition of building energy consumption, the BiLSTM network is more accurate than the LSTM network prediction algorithm.
Conclusion
In this study, a short-term prediction model of building energy consumption based on the CEEMDAN-BiLSTM method is proposed. The energy consumption data of lighting, air conditioning, and power are decomposed by CEEMDAN and then sent to the BiLSTM network for energy consumption prediction. At the same time, five models are established and compared with the proposed model. The CEEMDAN-BiLSTM model solves the problem of low accuracy of traditional forecasting methods when energy consumption fluctuates. The main conclusions are as follows:
1) BP and SVM models are simple in structure, showing large errors in all kinds of weather, so they are not suitable for the prediction of energy consumption series. The accuracy of the LSTM model is difficult to guarantee when the energy consumption fluctuates greatly. When the weather suddenly changes, the EMD-LSTM model shows a big error in the prediction of air conditioning energy consumption.
2) More detailed components can be extracted by CEEMDAN decomposition of energy consumption curve data, which makes the prediction of the BiLSTM network more accurate.
3) The difference between the predicted energy consumption of the CEEMDAN-LSTM model and the actual energy consumption is small, and the prediction accuracy meets the requirements of short-term prediction.
Data Availability Statement
The original contributions presented in the study are included in the article/supplementary material; further inquiries can be directed to the corresponding author.
Author Contributions
ZL basically completed all the contents of the article independently.
Conflict of Interest
The authors declare that the research was conducted in the absence of any commercial or financial relationships that could be construed as a potential conflict of interest.
Publisher’s Note
All claims expressed in this article are solely those of the authors and do not necessarily represent those of their affiliated organizations, or those of the publisher, the editors, and the reviewers. Any product that may be evaluated in this article, or claim that may be made by its manufacturer, is not guaranteed or endorsed by the publisher.
References
Ali, H., Azalan, M., Zaidi, A., Amran, T. S. T., and Elshaikh, M. (2021). Feature Extraction Based on Empirical Mode Decomposition for Shapes Recognition of Buried Objects by Ground Penetrating Radar. J. Phys. Conf. Ser. 1878 (1), 012022. doi:10.1088/1742-6596/1878/1/012022
Bagnasco, A., Fresi, F., Saviozi, M., and Vinci, A. (2015). Electrical Consumption Forecasting in Hospital Facilities: An Application Case. Energy & Build. 103 (SEP.), 261–270. doi:10.1016/j.enbuild.2015.05.056
Ding, S., Li, R., Wu, S., and Zhou, W. (2021). Application of a Novel Structure-Adaptative Grey Model with Adjustable Time Power Item for Nuclear Energy Consumption Forecasting. Appl. Energy 298 (3), 117114. doi:10.1016/j.apenergy.2021.117114
Han, Q., Ikbal, M. A., and Khanna, S. (2021). Prediction of Energy Consumption of Numerical Control Machine Tools and Analysis of Key Energy : aving Technologies[J]. IET Collab. Intell. Manuf. 3, doi:10.1049/cim2.12001
Khattari, Y., El-Otmany, H., Rhafiki, T. E., Kousksou, T., Ahmed, A., and Ghoulam, E. B. (2020). Physical Models to Evaluate the Performance of Impure Phase Change Material Dispersed in Building Materials. J. Energy Storage 31, 101661. doi:10.1016/j.est.2020.101661
Li, Q., Meng, Q., Cai, J., Yoshino, H., and Mochida, A. (2009). Applying Support Vector Machine to Predict Hourly Cooling Load in the Building. Appl. Energy 86 (10), 2249–2256. doi:10.1016/j.apenergy.2008.11.035
Ma, Z., Ye, C., Li, H., and Ma, W. (2018). Applying Support Vector Machines to Predict Building Energy Consumption in China. Energy Procedia 152, 780–786. doi:10.1016/j.egypro.2018.09.245
Neto, A. H., and Fiorelli, F. (2008). Comparison between Detailed Model Simulation and Artificial Neural Network for Forecasting Building Energy Consumption. Energy Build. 40 (12), 2169–2176. doi:10.1016/j.enbuild.2008.06.013
Oh, J. S. (2021). A Comparative Study on Energy Consumption Forecast Methods for Electric Propulsion Ship. J. Mar. Sci. Eng. 10. doi:10.3390/jmse10010032
Pinanggih, D. H., Abdullah, A. G., and Hakim, D. L. (2021). Prediction of Energy Consumption Using Artificial Neural Network Method in One of Shopping Center in Cirebon City[J]. IOP Conf. Ser. Mater. Sci. Eng. 1098 (4), 042011. doi:10.1088/1757-899x/1098/4/042011
Runge, J., and Zmeureanu, R. (2019). Forecasting Energy Use in Buildings Using Artificial Neural Networks: A Review. Energies 12 (17), 3254. doi:10.3390/en12173254
Shapi, M., Ramli, N. A., and Awalin, L. J. (2020). Energy Consumption Prediction by Using Machine Learning for Smart Building: Case Study in Malaysia. Dev. Built Environ. 5, 100037. doi:10.1016/j.dibe.2020.100037
Somu, N., Gauthama, R., and Ramamritham, K. (2021). A Deep Learning Framework for Building Energy Consumption Forecast. Renew. Sustain. Energy Rev. 137, 110591. doi:10.1016/j.rser.2020.110591
Wang, W., Pan, Y., and Huang, Z. (2018). Application of Gradient Progressive Regression Tree to Short-Term Prediction of Building Energy Consumption. Build. Energy Conserv. 46 (3), 5.
Keywords: short-term forecast, sub-item energy consumption of buildings, modal decomposition, weather classification, energy consumption
Citation: Lin Z (2022) Short-Term Prediction of Building Sub-Item Energy Consumption Based on the CEEMDAN-BiLSTM Method. Front. Energy Res. 10:908544. doi: 10.3389/fenrg.2022.908544
Received: 30 March 2022; Accepted: 18 April 2022;
Published: 02 June 2022.
Edited by:
Xun Shen, Tokyo Institute of Technology, JapanReviewed by:
S. Sardana, Indian Institute of Technology, Dhanbad, IndiaSandeep Singh Nanglu, Sri Sai Group of Institutes, Badhani, India
Copyright © 2022 Lin. This is an open-access article distributed under the terms of the Creative Commons Attribution License (CC BY). The use, distribution or reproduction in other forums is permitted, provided the original author(s) and the copyright owner(s) are credited and that the original publication in this journal is cited, in accordance with accepted academic practice. No use, distribution or reproduction is permitted which does not comply with these terms.
*Correspondence: Zhanbin Lin, TGluX2RpbGlnZW5jZUAxNjMuY29t