 Lin Zhu
 Zhigang Wu1*
 Chao Xing
- 1School of Electric Power Engineering, South China University of Technology, Guangzhou, China
- 2State Grid Jiangsu Electric Power CO., Ltd Extra High Voltage Company, Nanjing, China
- 3Department of Electrical and Computer Engineering, University of Saskatchewan, Saskatoon, SK, Canada
- 4Electric Power Research Institute of Yunnan Power Grid Co., Ltd, Kunming, China
- 5Maintenance & Test Center, CSG EHV Power Transmission Company, Guangzhou, China
This paper studies the user-defined modeling (UDM) method in PSS/E and applies it to a modular multilevel converter high-voltage direct current (MMC-HVDC) system. First, the mechanism of PSS/E UDM is discussed, including the requirements of the model call, storage space allocation, and flows of dynamic simulation. Then, a generic UDM method applicable to various objects is proposed in PSS/E, considering both the internal structures of models and their interfaces with the PSS/E main program. Next, the design of multiple time scales of UDM is presented for hybrid step size simulation. Accordingly, a user-defined MMC-HVDC system model is built in PSS/E considering the converter, DC-line, control system, and system interface. Finally, the model is compared with a PSCAD electromagnetic transient MMC-HVDC model in a modified two-area-four-generator system. The simulation results demonstrate the proposed UDM method.
Introduction
Power system simulation is crucial for system planning, design, and operations; accurate modeling plays a key role in identifying potential system deficiencies. Recently, various power electronics-based devices such as voltage source converter high voltage direct current (VSC-HVDC) and wind power plants have been integrated into grids, presenting a challenge of system simulation and analysis (Liu et al., 2014; Vennelaganti and Chaudhuri, 2018; Li et al., 2019; Wang et al., 2019).
Although simulation toolsets provide various system component models, challenges exist, especially in extending, modifying, and improving the models. UDM is an effective solution that enables users to build, customize and refine models based on users’ requirements (Ahn et al., 2013). To cope well with various study cases, users would specify intellectual models that are perhaps not generic or supported by manufacturers.
The benefits of UDM have been studied in previous research (Saeedifard and Iravani, 2010; Peralta et al., 2012a; Peralta et al., 2012b; Xu et al., 2014; Kwon et al., 2017; Tang et al., 2018). Studies in (Xu et al., 2014) show that power system numerical simulations can be extended to MATLAB through UDM. UDM can also facilitate the development of models and control strategies. For instance, (Saeedifard and Iravani, 2010) develops a comprehensive mathematical model based on the negative and positive sequence decomposition technique. (Kwon et al., 2017) shows an improved droop control strategy for stability enhancement of VSC-MTDC systems in PSCAD/EMTDC. A novel topology of modular multilevel converter (MMC)-based distributed power flow controller is proposed in (Tang et al., 2018), providing an alternate method for power flow control. Furthermore, UDM allows considerable features and knowledge based on years of experience or design standardization to be integrated into PSS/E. A new UDM method is proposed in (Peralta et al., 2012a) and further developed in (Peralta et al., 2012b) based on the authors’ experience to enable accurate d-q frame VSC modeling in the blocked state.
As widely used in the power system simulation and analysis, PSS/E has been equipped with comprehensive UDM capabilities, which are prevalent in power system studies and result in economical and flexible solutions (Chen et al., 2014; Kwon et al., 2015; Zhang et al., 2015). In (Chen et al., 2014), SVC is modeled as a current source in PSS/E, injecting current into the connected bus to generate a transient response. Further studies in (Zhang et al., 2015) show that the modeling method proposed in (Chen et al., 2014) could apply to HVDC. The correctness of the user-defined CIGRE benchmark HVDC system is demonstrated through comparison with the example file in PSCAD. Moreover, a new controller for HVDC systems is integrated into PSS/E to improve transient variations in the DC voltage and current (Kwon et al., 2015).
The above reviews of UDM in PSS/E only focus on modeling a specific system or improving the response characteristics through PSS/E UDM. To the best of the authors’ knowledge, the fundamental nature of UDM in PSS/E, including mechanisms and modeling methods, is still poorly explored. Feature optimization and improvement of model accuracy of UDM in PSS/E also receive little attention.
Therefore, this paper explores the fundamentals of UDM in PSS/E. It studies the UDM mechanism in PSS/E in detail based on high fidelity modeling, including call processing, the storage and sharing of model data. It then proposes a generic UDM method applicable to various model objects. Subsequently, modeling with multiple time scales is achieved to improve accuracy. Finally, a user-defined MMC-HVDC system in PSS/E is modeled and compared with an accurate electromagnetic transient model in PSCAD, and time-domain simulations validate the proposed method.
The rest of this paper is organized as follows. Section 2 presents the mechanism of UDM in PSS/E. Section 3 describes the UDM method of PSS/E in depth. Section 4 implements the detailed modeling of an MMC-HVDC transmission system with the proposed method. In Section 5, case studies are presented to verify the proposed method, followed by conclusions.
Mechanism of User-Defined Modeling in PSS/E
The Framework of User-Defined Modeling in PSS/E
By achieving “industry standard” status, PSS/E has developed a natural evolution of organizational structures in response to a very definite power system simulation need. Due to space limitations, this study focuses on UDM, explaining how UDM works and interacts with PSS/E main program. Figure 1 is the framework describing relationships among different modules associated with UDM.
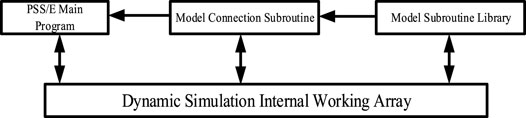
FIGURE 1. Relationships among different modules associated with UDM.
Users can design a wide range of constitutive models in PSS/E, when a standard library model cannot meet their requirements. User-defined models are recommended to be programmed in Fortran, compiled as a dynamic link library (DLL), added to the PSS/E working directory, and loaded by the main program.
The object subroutine library is the core of UDM and is also a sequence of models, carrying specific properties of the objects of interest. Usually, we use differential algebraic equations (DAEs) to describe equipment dynamics and build custom control blocks. However, these cannot be called directly by the PSS/E main program, as shown in Figure 1. Instead, this library needs to cooperate with other subroutines during the transient simulation process.
CONEC and CONET are a set of connection subroutines that link equipment models and their data with network elements. The model connection subroutines are specifications that prescribe a set of routines for performing common operations, such as calling a user-defined model from the model library and solving DAEs to update variables. In other words, the model connection subroutines bridge the gap between the PSS/E main program and the user model. These models require user designs for input and output flow. They are also a sequence of Fortran CALL statements connecting models from the PSS/E model library to network components.
The internal working arrays are responsible for storing and sharing data involved in UDM and participate in every single stage, including definition, connection, and calculation. The types of data involved in dynamic simulation calculations can be divided into four categories: constants, state variables, algebraic variables, and input variables. Obviously, one specific kind of internal working array corresponds to one specific type of data. Some general-purpose storage arrays bear the responsibility of storing model parameters in the model subroutine, while the interface arrays are designed for the network solutions in the main program. Furthermore, PSS/E specifies the location of one specific model through the storage locations reserved for that model reference during the model connection stage.
Requirements of Model Call and Storage Space Allocation
Figure 1 shows that internal working arrays associate with all of the other modules in UDM. During a simulation, the implementation of model functions often requires the call of relevant data and the return of calculation results. These data or results are stored in a group of named arrays, related to buses, machines, and loads. These quantities, such as VOLT, BSFREQ, MBASE, etc., are frequently needed as inputs and outputs in setting up and displaying the results of dynamic simulations (Siemens, 2013). User-defined models can access these quantities through the bus, machine, and load numbering sequences. There are also four general-purpose storage arrays: CON stores the model parameters that do not vary during the simulation, VAR stores the algebraic variables, STATE stores the state variables determined by differential equations, and DSTATE stores the state variable derivatives versus time.
Generally, the modeling of a complete system comprises numerous models in the PSS/E model library and user-defined model. The respective functions of these models are completed through the data call and the return of results. This process requires assigning individual spaces to each model and calling these data according to the types. Taking the storage space allocation of two user-defined models as an example, as shown in Figure 2, from the perspective of a single user-defined model A, different types of data are allocated in the corresponding locations of arrays using array indexes Ia, Ja, and Ka. For example, the EFD, VREF, and ECOMP arrays use index Ia, the CON array uses index Ja, while the STATE and DSTATE arrays use index Ka. As for the storage space allocation of two user-defined models, we only discuss the CON array; the other arrays are similar. Supposing that the location of the CON array in user-defined model A starts at Ja and ends at Ja+1, then the location of the CON array in user-defined model B starts at Jb, and the next locations are Jb+1, Jb+2, and so on.
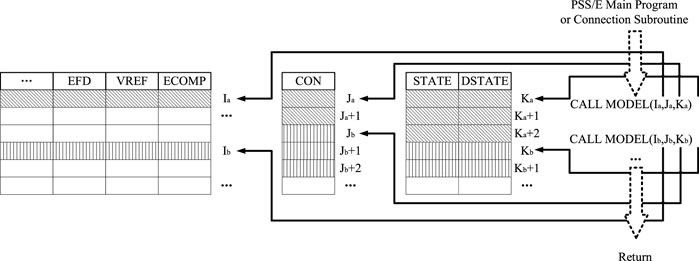
FIGURE 2. Mechanisms for storage space allocation of internal arrays in PSS/E. The flow of dynamic simulation for UDM
Understanding the requirements of models in PSS/E is necessary whenever a new user-defined model is required. Each model completes different types of computations at different stages in the dynamic simulation process. As a result, a set of flags are used to communicate among PSS/E dynamic simulation activities. The simulation flag MODE varies from 1 to 8 and suits individual needs, as shown in Table 1.
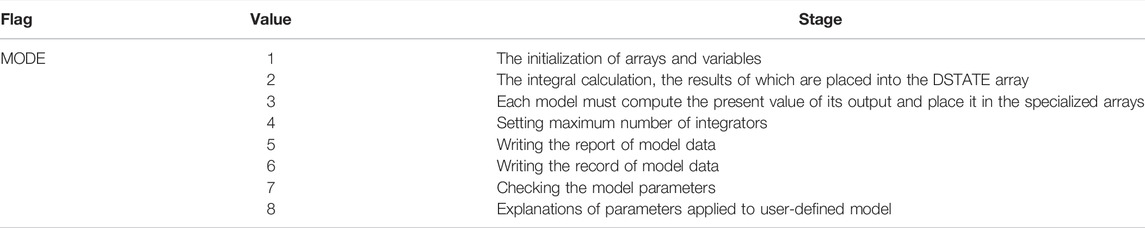
TABLE 1. Functions of MODE in PSS/E.
Stages represented by MODE 1 to MODE 8 are not all cyclically executed in each step during the simulation. When a user-defined model participates in simulation, MODE 1, 4, and 8 are executed only once during its initialization. On the contrary, MODE 2 and MODE 3 are dominant and are executed circularly in the user-defined model. MODE 7 checks the model parameters just after the dynamic data file is loaded. MODE 5 and MODE 6 are executed optionally, if necessary. Here, we only discuss the stages represented by MODE 1, 2, 3, 4, and 8. The primary flow of dynamic simulation based on MODE is shown in Figure 3.
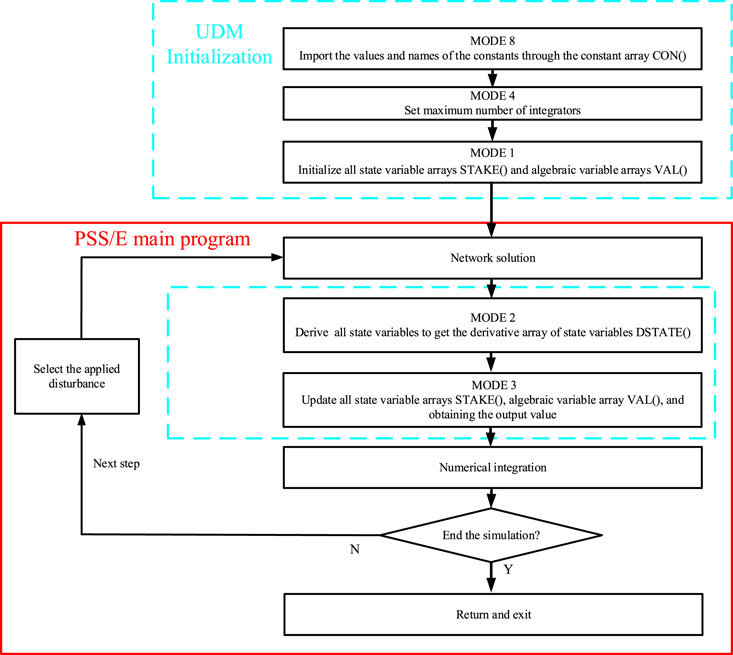
FIGURE 3. Flow of dynamic simulation based on MODE.
User-Defined Modeling Method in PSS/E
In this section, we propose a generic UDM method after identifying the mechanism of UDM in PSS/E in Section 2. The proposed method is well designed and easily coordinated with various objects. This method is composed of two main parts: the reasonable description of the internal structure and arranging the interface between the model output and PSS/E main program.
Realization of the Internal Structure
The core of this part is making clear the DAEs of an object and writing the responding subroutine to meet the requirements of UDM. Users need to analyze the DAEs first and confirm how many constant parameters, algebraic variables, and state variables relevant to the model are used, and distribute space in the CON, VAR, and STATE arrays by rules. Here, we consider the excitation system model ‘SEXS’ in the standard model library as an example.
As can be seen from the control block in Figure 4, the model is mainly composed of a lead-lag block and an inertia block. Suppose that the state variable in relation to the lead-lag block is E1, and the state variable in relation to the inertia block is E2. The allocation of storage space for constant parameters, state variables, and algebraic variables is shown in Table 2.
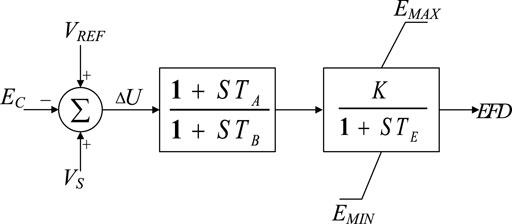
FIGURE 4. The control block of SEXS.
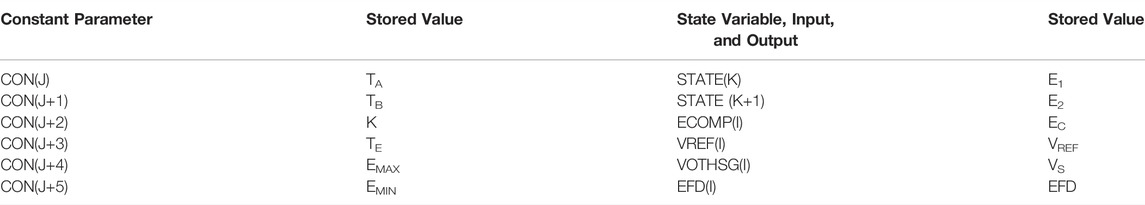
TABLE 2. Storage allocation of array for SEXS.
The definition of arrays from CON(J) to CON(J+5) is carried out in MODE 8, and the number of state variables is subsequently updated in MODE 4. In the meantime, the initial values of the input, output, and state variables are confirmed through the power flow results in MODE 1. That is to say, we can obtain initial values of ECOMP(I), VREF(I), VOTHSG(I), and EFD (I) from the main program. Then the initial values of STATE(K) and STATE (K+1) can be determined through the logical relations among state variables, inputs, and outputs. The characteristic equations and DAEs representing the control system are written in the frequency domain in MODE 2. The decomposition of the first lead-lag block is shown in Figure 5.where E1 is set as STATE(K) and its derivative is stored in DSTATE(K), which can be expressed as:
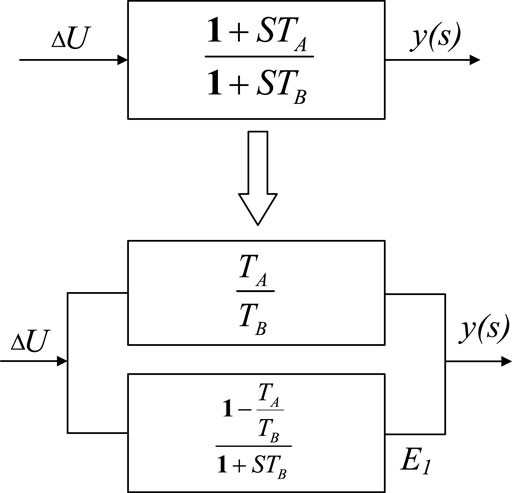
FIGURE 5. Decomposition of lead-lag control block.
The output of the second lag block E2 is set as STATE (K+1), and DSTATE (K+1) is handled similar to DSTATE(K). Finally, the values of the above state variables and algebraic variables are updated in MODE 3.
The Interface Between the User-Defined odel and PSS/E Main Program
An interface can connect the user-defined model and PSS/E main program. This interface is a shared boundary during simulation across which the user-defined model and PSS/E main program exchange information. The interface is not necessarily the same for all dynamic models because some models’ outputs must match with specific internal working arrays in the data library of PSS/E. In other words, these specific internal working arrays act as protocols to receive and send data. The excitation system of the generator, prime mover, and governor are typical representations. Again, taking the exciter as an example, the output variable excitation voltage is stored in the EFD array, which can be recognized and called by the main program directly. These internal working arrays serve as the interface and make interacting with the user-defined model and PSS/E main program easier.
On the other hand, no internal working arrays correspond to the physical variables represented by the models’ outputs for a flexible alternating current transmission system (FACTS), HVDC, or other complex electrical devices. Under these circumstances, the outputs cannot be directly recognized or called by the main program. Usually, an electrical device or component impacts the system at the connected bus by injecting power while the system provides a voltage that affects the dynamics of the component. Converting the injecting power into the equivalent current is advised not to lose impact at the connected bus. Consequently, the output as the injected current can be stored in the internal working array CURNT. This interface is established as shown in Figure 6.
FIGURE 6. Interface of user-defined model.
Realization of Modeling With Multiple Time Scales
A power system is a large-scale nonlinear system with high complexity, consisting of a large number of variables with different time constants. Some of the variables change rapidly, whereas others change relatively slowly. In this scenario, multiple time scales can characterize the power system. PSS/E mainly concentrates on electromechanical transients of power systems with a large step size, such as a half-circle; this is widely accepted, especially in AC systems. With full use of power electronic devices such as HVDC and FACTS, these models need a smaller step size than AC devices for precision. The contradiction arises when there is a large fixed step size and requirements for precision without additional computational burden. This section will discuss multiple time scales in UDM for higher accuracy.
The PSS/E main program performs data interactions with the user-defined model during each iteration of each step. When the user-defined model performs the internal calculation, the main program waits until the calculation ends. During this period, the value of the user-defined model imported by the main program maintains the current value. Once the calculation of the user-defined model is finished, the main program continues, and the user-defined model passes the results to the main program as a fixed value in the subsequent cycle of calculation.
According to the characteristics of the user-defined model, the entire calculation process is independent of the main program. The interface between the main program and the user-defined model is only for data transmission and does not affect the respective simulation processes. Therefore, a simulation with a hybrid step size can be realized by modifying the internal calculation process of the user-defined model. One needs to preset a large time step
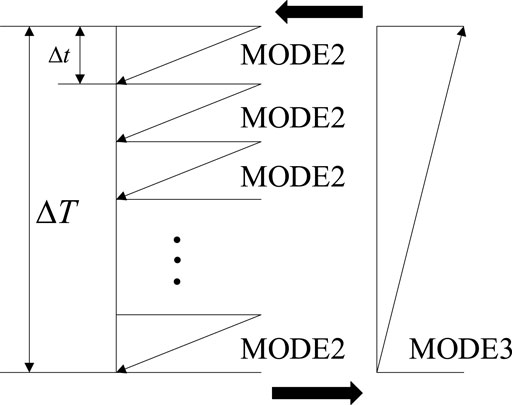
FIGURE 7. Realization mechanism of modeling with multiple time scales.
User-Defined Modeling of an Modular Multilevel Converter -High Voltage Direct Current System in PSS/E
This section performs UDM of an MMC-HVDC system with the generic method proposed in this paper. Figure 8 is a diagram of the modeling of the MMC-HVDC system, which includes four modules: 1) converter; 2) DC-line; 3) control system; and 4) system interface. Modules 1), 2), and 3) are a realization of the internal structure, and module 4) is the interface between the user-defined model and PSS/E main program.
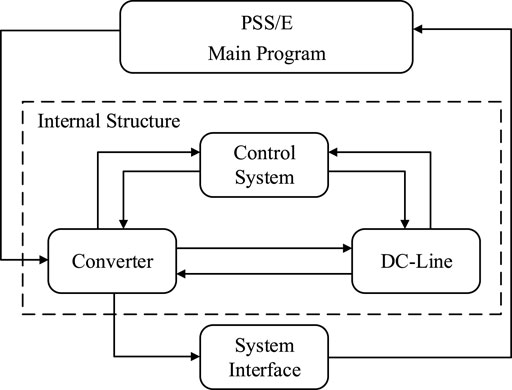
FIGURE 8. Diagram of the modeling of an MMC-HVDC system.
Internal Structure
Converter
The equivalent circuit of a single MMC on the AC side is shown in Figure 9, where point of common coupling (PCC) is the converter bus on the network side, Rt and Lt respectively represent the resistance and reactance of the converter transformer, and Rp and Lp respectively represent the resistance and reactance of the bridge arm.
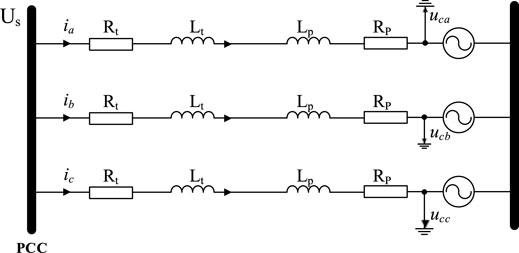
FIGURE 9. The equivalent structure of a single MMC on the AC side.
To facilitate the analysis and independent control of each physical quantity, the three-phase time varying quantities of the MMC-HVDC system are transformed into physical quantities under the d-q rotating coordinate system perpendicular to each other. Assuming that the positive sequence fundamental component of the converter bus voltage is in the same direction as the d-axis, the mathematical model of the voltage source converter at this coordinate is as follows:
where L = Lt + Lp, R = Rt + Rp, ω is the fundamental angular frequency of the system, usd and usq are respectively the d and q components of the voltage at converter bus, ud and uq are respectively the d and q components of the fundamental voltage at the midpoint of the converter bridge arm, and id and iq are respectively the d and q components of the current injected into the converter bus.
DC-Line
This paper uses a π-type circuit to simulate the DC transmission line. The equivalent circuit diagram is shown in Figure 10.
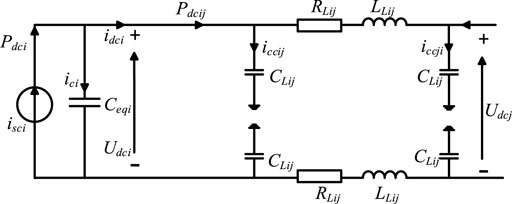
FIGURE 10. Equivalent circuit of the DC-line.
In Figure 10, the subscript i represents the variable of the MMCi and Ceqi is the equivalent sub-module capacitance for six bridge arms of MMC, which can be expressed as:
where Csm and Nsm respectively represent the capacitance and number of sub-modules.
For MMCi on the DC side, the equations are as follows:
where isci is the total current injected into the DC side of MMCi, and is composed of the current ici injected into the equivalent capacitor and the current idci from DC node i to DC node j.
For the DC-line from i to j, the equations are as follows:
where CLij, LLij, and RLij are respectively the capacitance, inductance, and resistance of the DC-line and iccij is the current injected into the capacitor of the DC-line.
Control System
The basic controller of a single MMC in the HVDC system is shown in Figure 11, and consists of inner and outer control loops accompanied by a modulation controller. Consider the presence of certain time lags when ud and uq track udref and uqref:
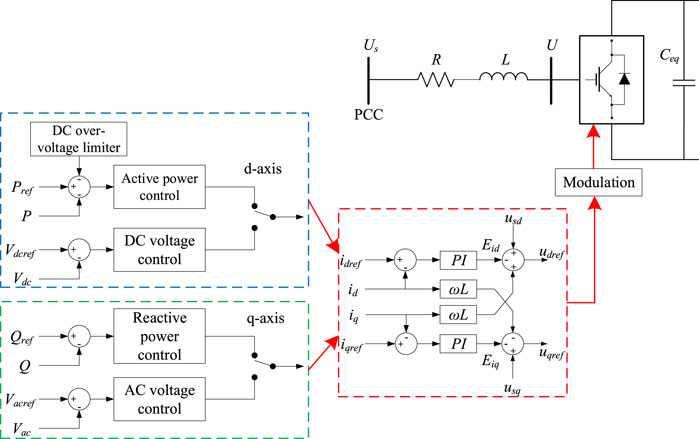
FIGURE 11. Control architecture of a single MMC.
Considering that the outer loop controller may generate excessive reference current even beyond the physical tolerance of the valve when the system is undergoing disturbances, a current limiting link should be added between the outer loop controller and the inner loop controller. This paper adopts the d-axis priority current limiting mode, as shown in Figure 12 (Giroux and Sybille, 2006).
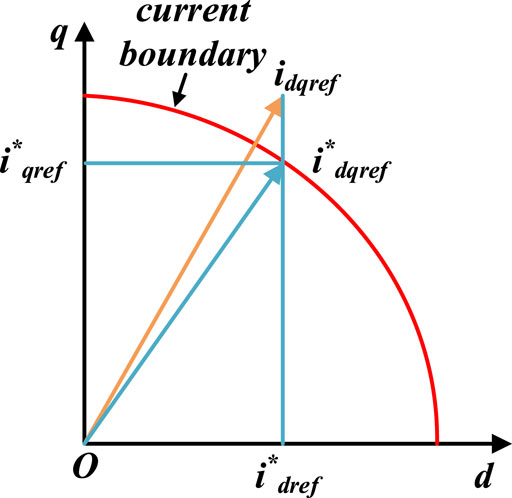
FIGURE 12. The principle of d-axis priority current limiting.
System Interface
According to the above details, the system interface of an MMC-HVDC system should be achieved through CURNT, which is an internal array loading the injection current data and feeding it back to the network for calculation. The model output needs to be converted into the current injection in accordance with the format of CURNT, which is composed of real and imaginary components. The converter equation shows that the outputs are isd and isq in the d-q rotating coordinate system. Therefore, it is necessary to perform a coordinate transformation to obtain the current in the x-y stationary reference frame. The d, q components of the current mentioned above are converted into P, Q, and then we can get the x, y component of the current as shown in (Eq. 10):
where id and iq are the same as those in (Eq. 1); ix and iy are the x and y components of the current injected into converter bus, respectively; us is the voltage vector at the converter bus; j is the imaginary unit; and Re and Im respectively represent the real and imaginary parts of the vector.
When a fault is applied to the system, the MMC-HVDC system will change the output current value so as to control the active power, DC voltage, and bus voltage. The implementation of the process is shown as follows:
where CURNT(I)n and CURNT(I)n+1 are current injection value in the N-th time step and the next time step, respectively; I is the number of the converter bus; and ix and iy are the x and y components of the current injected into the converter bus, respectively.
Detailed Modeling Procedure
In summary, in MODE 8 the CON array allocates storage for constants such as gains and time constants of control blocks, resistances and capacitances of the DC-line, etc. The detailed allocation of storage space for constant parameters is shown in Table 3. Subsequently, the maximum number of integrators is set to 20 according to the number of state variables in MODE 4. The state variables involved in the MMC-HVDC system are mainly the outputs of PI controllers, DC voltages, DC currents, and valve currents. The allocation of storage space for state variables is shown in Table 4. All of the above variables are initialized using the steady-state solutions of the AC and DC networks in MODE 1.
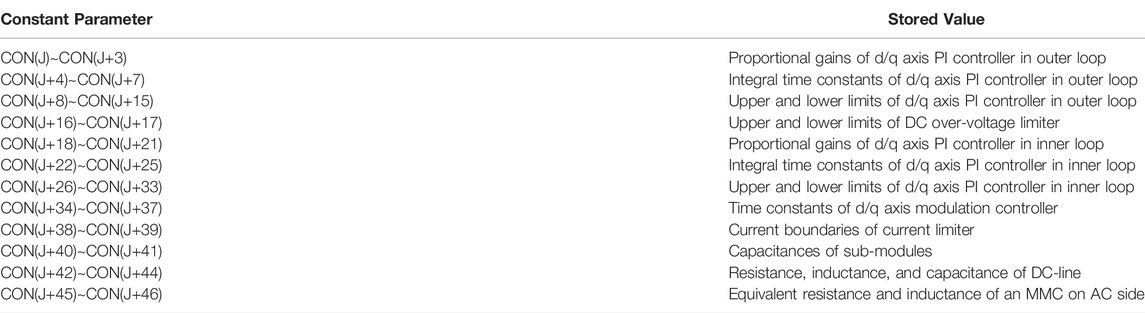
TABLE 3. Storage allocation of CON array for MMC-HVDC.
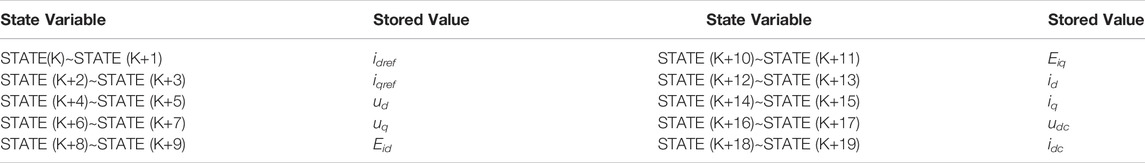
TABLE 4. Storage allocation of STATE array for MMC-HVDC.
After initialization, we can handle the DAEs of converters, DC-line, outer loop, inner loop, and modulation controller. In MODE 3, the output quantities such as active power, reactive power, and DC voltage, etc., are updated. These quantities are then delivered to MODE 2 as inputs of the DAEs. In MODE 2, derivatives of the state variables in the DAEs are confirmed and stored in DSTATE arrays. Through integral calculation, the valve currents and DC voltages are finally delivered to MODE 3 again to update the output quantities. Considering that the transient simulation of the MMC-HVDC system is in need of hybrid time steps, during a single time step MODE 2 is executed in loops to solve the DAEs as presented in Section 3 while MODE 3 is executed only once to update the output of the model. MODE 2 and MODE 3 are executed in turns until the simulation ends. As for the system interface, the update of CURNT is implemented through writing the codes in the form of auxiliary functions in MODE 3. In this way, the internal structure and dynamics of the MMC-HVDC system are successfully presented.
Study Cases
Test System and Simulation Conditions
A modified two area-four generator system is used to validate the proposed method and MMC-HVDC user-defined model, as shown in Figure 13. The rated active power of the MMC-HVDC system is 400 MW, and the AC transmission line transfers 200 MW of active power from bus 7 to bus 8. The rated DC voltage of the MMC-HVDC system is 400 kV; other detailed parameters of the test system are from (Kundur et al., 1994).
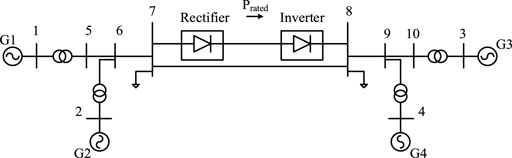
FIGURE 13. Test system.
This section builds the user-defined electromechanical model of MMC-HVDC in PSS/E and compares performance with the accurate electromagnetic transient model in PSCAD. The simulation step sizes are 200us in PSCAD and 10 ms in PSS/E.
Transient Simulation and Comparison
Case 1: MMC-HVDC systems with controls are modeled separately in PSCAD and PSS/E. The model in PSCAD is accurate and acts as the reference. The rectifier controls the active power and the AC voltage, while the inverter controls the DC voltage to the set point and the AC voltage. At 2.0 s, an instant three-phase fault is applied to bus 8 then cleared 0.1 s later. Figure 14 shows responses of the DC voltage and active power.
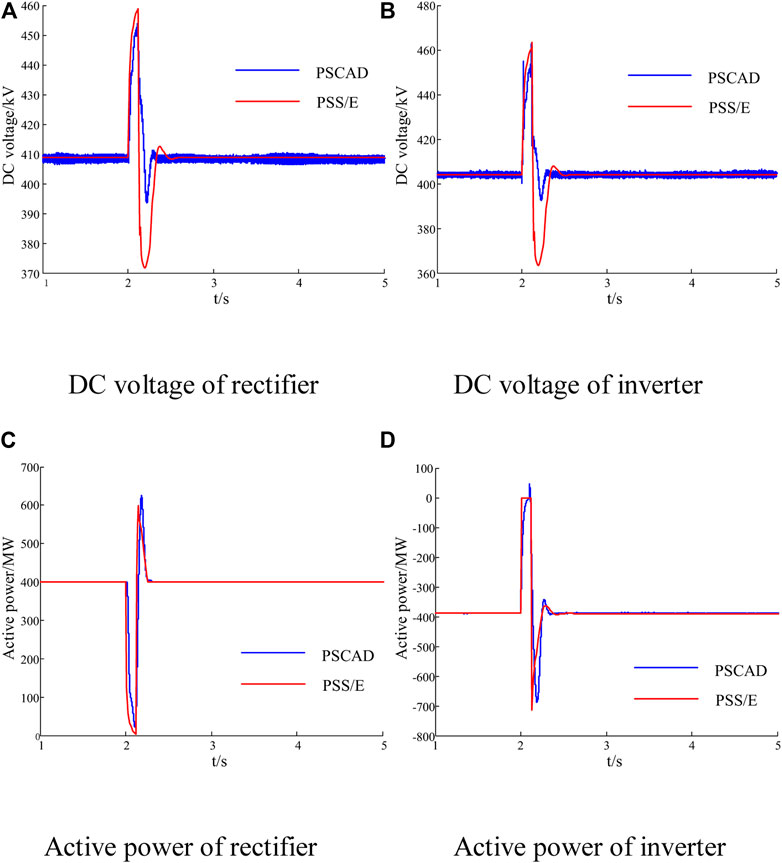
FIGURE 14. Dynamic response of the MMC-HVDC system in PSCAD and PSS/E. (A) DC voltage of rectifier (B) DC voltage of inverter. (C) Active power of rectifier (D) Active power of inverter.
As shown in Figure 14, the DC voltage and active power are almost the same in PSCAD and PSS/E in the steady states. Even during the transient process, the largest mismatch is less than 0.1 p.u. This demonstrates that the dynamic responses of the models in PSS/E and PSCAD coincide well. Although the results in PSCAD contain some high-frequency oscillations, the effect of the oscillation on the transient stability is clearly restricted. The main differences between the two models lie in the fact that the electromechanical transient model only considers the fundamental wave. However, the electromagnetic transient model takes the high-frequency component into consideration.
Case 2: According to the above results, the stability of the DC voltage during transient simulation can be further improved. The extensibility of UDM is illustrated with a user-defined auxiliary controller added to the above MMC-HVDC model in PSS/E. The controller, the structure of which is shown in Figure 15, is proposed in (Stamatiou and Bongiorno, 2017) and has been proven effective. The rectifier and inverter both select the user-defined auxiliary controller, and they still control the AC voltage simultaneously. The same fault is applied again, with the results of models with the basic controller and user-defined controller in PSS/E shown in Figure 16.
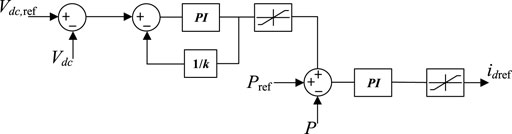
FIGURE 15. Control architecture of user-defined auxiliary controller.
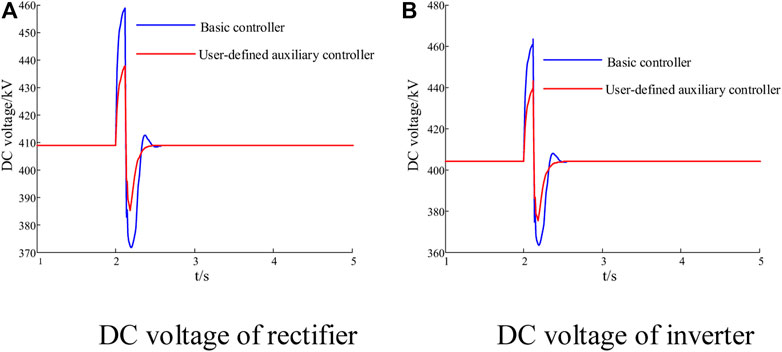
FIGURE 16. Dynamic response of the MMC-HVDC system with two different controllers in PSS/E. (A) DC voltage of rectifier (B) DC voltage of inverter.
During the transient process, the DC voltage of the model with the user-defined controller fluctuates in a smaller range and recovers faster compared with the basic controller. The flexibility of UDM is highlighted.
Case 3: A severe permanent trip-line fault is executed in both PSCAD and PSS/E further to test the performance of the user-defined MMC-HVDC system. A three-phase permanent fault is applied to bus 8 at 2.0 s, and the AC transmission line from bus 7 to bus 8 is permanently tripped 0.1 s later. Regarding the flexibility of the MMC-HVDC system, the set point of the active power at the rectifier is increased from 400 to 600 MW to make up the power shortage. Figure 17 shows the active power and DC voltage responses in Case 3.
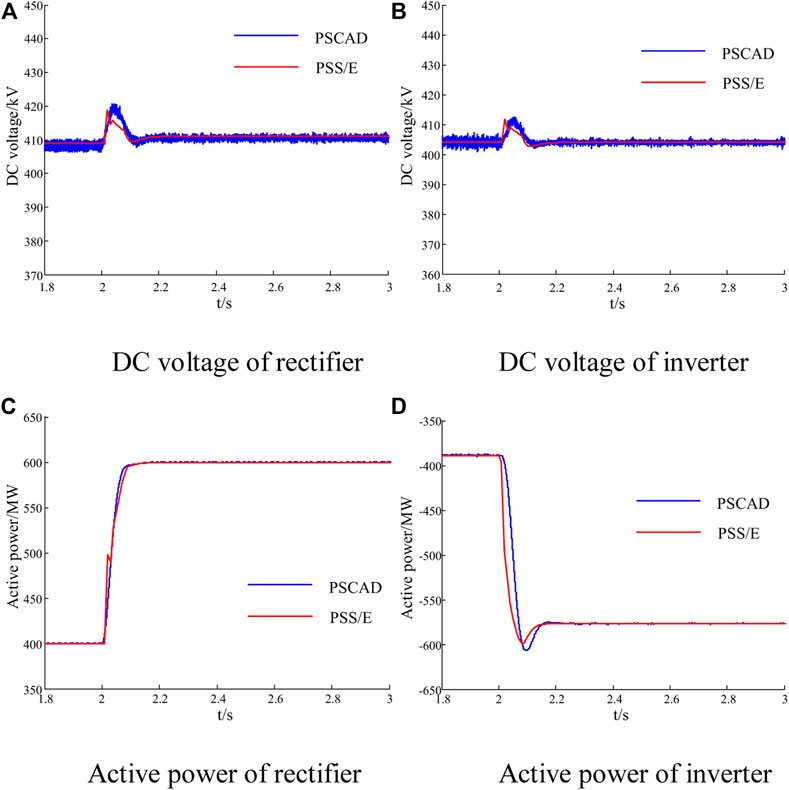
FIGURE 17. Dynamic response of MMC-HVDC in Case 3. (A) DC voltage of rectifier (B) DC voltage of inverter. (C) Active power of rectifier (D) Active power of inverter.
Figure 17 shows that the results in both PSS/E and PSCAD still match with negligible error in terms of magnitude and phase. The rectifier rapidly follows the change of power set point and reaches the new stable condition of 600 MW at about 2.1 s. At the same time, the inverter still controls the DC voltage at the initial set point after the fluctuation of power due to constant DC voltage control. As a result, the whole system is stable again with the adjustment of the MMC-HVDC system. The controllability and validity of the user-defined MMC-HVDC system model are thus again verified. This approach can be applied to extend various complex models.
The efficiencies of PSS/E built-in models, the user-defined model with a basic controller, and the user-defined model with an auxiliary controller are also compared. The simulation is carried out on a platform featuring an Intel i5 CPU with 8 GB of RAM and employing PSS/E version 33.04. In conclusion, the user-defined models in PSS/E are all highly efficient and applicable to large-scale power systems.
Conclusion
In this paper, the mechanism of UDM in PSS/E is thoroughly investigated, including requirements of model call, storage space allocation, and flows of dynamic simulation for UDM The proposed method can effectively deal with the internal dynamic of a user-defined model and the interface between a user-defined model and PSS/E main program. The design of multiple time scales is proposed to meet the requirement of hybrid simulation steps. The significant contribution of this paper is the UDM method, which is suited to various objects in PSS/E. Following this method, a user-defined MMC-HVDC system model is presented in PSS/E and compared with the accurate electromagnetic transient MMC-HVDC model in PSCAD on a modified two area-four generator system. Detailed case studies show the validity of the proposed method and the user-defined MMC-HVDC model. Notably, a user-defined auxiliary controller based on users’ insight demonstrates the benefits of UDM, which shows the flexibility and extension for individual requirements. All results indicate that the proposed generic UDM method in PSS/E is efficient and fulfills requirements for model expansion, modification, and improvement.
Data Availability Statement
The original contributions presented in the study are included in the article/Supplementary Material, further inquiries can be directed to the corresponding authors.
Author Contributions
LZ and DC conceived of the presented idea. ZW contributed significantly to analysis and manuscript preparation. CX and QL carried out the experiments. DC and YC verified the analytical methods. LZ and ZW took the lead in writing the manuscript. All authors discussed the results and contributed to the final manuscript.
Funding
This study received funding from China Southern Power Grid Company Limited (No. GDKJXM20198236). The funder was not involved in the study design, collection, analysis, interpretation of data, the writing of this article or the decision to submit it for publication. All authors declare no other competing interests.
Conflict of Interest
LZ and ZW are employed by South China University of Technology. DC is employed by State Grid Jiangsu Electric Power CO., Ltd. Extra High Voltage Company. YC is employed by University of Saskatchewan. CX is employed by Electric Power Research Institute of Yunnan Power Grid Co., Ltd. QL is employed by Maintenance & Test Center, CSG EHV Power Transmission Company.All authors declare no other competing interests
Publisher’s Note
All claims expressed in this article are solely those of the authors and do not necessarily represent those of their affiliated organizations, or those of the publisher, the editors and the reviewers. Any product that may be evaluated in this article, or claim that may be made by its manufacturer, is not guaranteed or endorsed by the publisher.
References
Ahn, S., Choi, J., Go, S., Jung, W., Il-Keun, S., and Dong-Jun, W. (2013). “Development of Simulation Platform of Distribution Systems with DGs and SVR for Voltage Control Studies,” in 2013 IEEE Power & Energy Society General Meeting (PESGM), Vancouver, BC, Canada, 1–5.
Chen, Y., Zhu, L., Yang, H., Cai, Z., and Li, S. (2014). “User-defined Modeling of Static Var Compensation for Electromechanical Transient Simulation in PSS/E,” in 2014 IEEE PES Asia-Pacific Power and Energy Engineering Conference (APPEEC), Hong Kong, China, 1–6. doi:10.1109/appeec.2014.7066095
Giroux, P., and Sybille, G. (2006). Static Synchronous Compensator (STATCOM) Used for Midpoint Voltage Regulation on a 500kV Transmission Line. Natick, MA: The MathWorks, Inc.
Kundur, P., Balu, N. J., and Lauby, M. G. (1994). Power System Stability and Control. New York: McGraw-Hill.
Kwon, D., Kim, Y., Moon, S., and Kim, C. (2017). Modeling of HVDC System to Improve Estimation of Transient DC Current and Voltages for AC Line-To-Ground Fault-An Actual Case Study in Korea. Energies 10, 1543. doi:10.3390/en10101543
Kwon, D., Moon, H., Kim, R., Kim, C., and Moon, S. (2015). “Modeling of CIGRE Benchmark HVDC System Using PSS/E Compared with PSCAD,” in 2015 5th International Youth Conference on Energy (IYCE), Pisa, Italy, 1–8. doi:10.1109/iyce.2015.7180781
Li, B., Liu, Y., Li, B., Hong, C., Zhang, Y., and Yang, J. (2019). Computationally Efficient Modeling Method of MMC Based on Arm Equivalent Time-Variant Capacitance. Int. Trans. Electr. Energ Syst. 29, e2732. doi:10.1002/etep.2732
Liu, S., Xu, Z., Hua, W., Tang, G., and Xue, Y. (2014). Electromechanical Transient Modeling of Modular Multilevel Converter Based Multi-Terminal HVDC Systems. IEEE Trans. Power Syst. 29, 72–83. doi:10.1109/tpwrs.2013.2278402
Peralta, J., Saad, H., Dennetière, S., and Mahseredjian, J. (2012). “Dynamic Performance of Average-Value Models for Multi-Terminal VSC-HVDC Systems,” in 2012 IEEE Power and Energy Society General Meeting (PESGM), San Diego, CA, USA, 1–8.
Peralta, J., Saad, H., Dennetiere, S., Mahseredjian, J., and Nguefeu, S. (2012). Detailed and Averaged Models for a 401-Level MMC-HVDC System. IEEE Trans. Power Deliv. 27, 1501–1508. doi:10.1109/tpwrd.2012.2188911
Saeedifard, M., and Iravani, R. (2010). Dynamic Performance of a Modular Multilevel Back-To-Back HVDC System. IEEE Trans. Power Deliv. 25, 2903–2912. doi:10.1109/tpwrd.2010.2050787
Siemens, P. T. I. (2013). Program Operation Manual of PSS/E-33.4. Schenectady, NY, USA: Siemens PTI, 21–23.
Stamatiou, G., and Bongiorno, M. (2017). Power‐dependent Droop‐based Control Strategy for Multi‐terminal HVDC Transmission Grids. IET Gener. Transm. & Distrib. 11, 383–391. doi:10.1049/iet-gtd.2016.0764
Tang, A., Shao, Y., Huang, Y., and Xu, Q. (2018). A New Topology of the Distributed Power Flow Controller and its Electromagnetic Transient Characteristics. Electr. Power Syst. Res. 163, 280–287. doi:10.1016/j.epsr.2018.07.002
Vennelaganti, S. G., and Chaudhuri, N. R. (2018). Ratio-Based Selective Inertial and Primary Frequency Support through MTDC Grids with Offshore Wind Farms. IEEE Trans. Power Syst. 33, 7277–7287. doi:10.1109/tpwrs.2018.2850145
Wang, Y. Z., Wen, W. J., Wang, C. S., Liu, H. T., Zhan, X., and Xiao, X. L. (2019). Adaptive Voltage Droop Method of Multiterminal VSC-HVDC Systems for DC Voltage Deviation and Power Sharing. IEEE Trans. Power Del. 34, 169–176.
Xiao, H., Sun, K., Pan, J., Li, Y., and Liu, Y. (2021). Review of Hybrid HVDC Systems Combining Line Communicated Converter and Voltage Source Converter. Int. J. Electr. Power & Energy Syst. 129, 1–9. doi:10.1016/j.ijepes.2020.106713
Xu, X., Zhang, H., and Xu, Q. (2014). “An Approach to User-Defined Modeling Implemented with MATLAB,” in 2014 IEEE PES Asia-Pacific Power and Energy Engineering Conference (APPEEC), 1–4. doi:10.1109/appeec.2014.7066083
Keywords: user-defined modeling method, PSS/E, modular multilevel converter highvoltage direct current , electromechanical transient, interface
Citation: Zhu L, Wu Z, Chen D, Chen Y, Xing C and Li Q (2022) A Generic User-Defined Modeling Method in PSS/E and Its Application in an MMC-HVDC System. Front. Energy Res. 10:908293. doi: 10.3389/fenrg.2022.908293
Received: 30 March 2022; Accepted: 26 April 2022;
Published: 11 May 2022.
Edited by:
Kaiqi Sun, Shandong University, ChinaCopyright © 2022 Zhu, Wu, Chen, Chen, Xing and Li. This is an open-access article distributed under the terms of the Creative Commons Attribution License (CC BY). The use, distribution or reproduction in other forums is permitted, provided the original author(s) and the copyright owner(s) are credited and that the original publication in this journal is cited, in accordance with accepted academic practice. No use, distribution or reproduction is permitted which does not comply with these terms.
*Correspondence: Lin Zhu, emh1bEBzY3V0LmVkdS5jbg==; Zhigang Wu, ZXB6Z3d1QHNjdXQuZWR1LmNu