 Lin Zhu
 Shiyu Huang
 Zhigang Wu1*
94% of researchers rate our articles as excellent or good
Learn more about the work of our research integrity team to safeguard the quality of each article we publish.
Find out more
ORIGINAL RESEARCH article
Front. Energy Res., 25 May 2022
Sec. Smart Grids
Volume 10 - 2022 | https://doi.org/10.3389/fenrg.2022.908207
This article is part of the Research TopicIntelligent Operation and Control in Next Generation Urban Power GridView all 14 articles
As the number of wind farms (WFs) in urban power grids gradually increases, their dynamic equivalence is needed for stability analysis. This paper proposes a dynamic equivalence method for distributed multiple wind farms in an urban power grid. The key idea is to characterize wind farms dynamics and then use them for coherence by considering the differences between doubly-fed induction generators (DFIG) and permanent magnet direct-drive synchronous generators (PMSG). The mathematical-physical models and operational control characteristics are firstly analyzed to find the essential attributes representing the dynamic characteristics. Then we introduce the similarity based on the dynamic timing warping (DTW) distances, which help construct the clustering index for coherency wind farms. Meanwhile, comprehensive constraints, which ensure the consistency of the urban power grid topology, are adequately considered. Finally, the parameters of coherent wind farms are aggregated based on the clustering groups. The proposed method is validated in an urban grid by the time-domain simulation.
Wind power has maintained an upward trend in past decades because of its advantages, such as sustainability and environmental benefits. A higher wind power penetration demand in the urban power grid is in the corner, which leads to a growing capacity and a wide spatial distribution, then brings new challenges to the safe and stable operation of the grid. For example, stability analyses based on accurate and adequate modeling are significant. However, one-to-one high accuracy modeling of all wind turbines in large-scale grids causes dimensional disasters, resulting in an enormous computational burden and time-consuming. In order to balance the accuracy and the complication, the dynamic equivalence method for wind power is drawing attention (Weng and Xu, 2012; Dorfler and Bullo, 2013; Joe and Juan, 2020).
The traditional dynamic equivalence primarily aims at synchronous generators (Joe and Juan, 2020). The dynamic equivalence can dramatically reduce the scale of the power system while ensuring that the relevant dynamic characteristics of the retained system and the original system are essentially the same (Weng and Xu, 2012). Usually, the modeling of the synchronous generators section greatly affects the accuracy of the dynamic equivalence. A widely used method in large power systems is the coherency-based dynamic equivalence, which compares rotor angles of various synchronous generators suffering contingencies and considers their comparable tendencies and responses as a coherent criterion. Therefore, in order to obtain a reasonable equivalent model of synchronous generators, researchers cluster various groups based on synchronous generators’ coherencies and then make parameters aggregation of the equivalent generator.
However, there is an evident gap when directly applying this traditional dynamic equivalent method to grids with high penetration of wind power. One reason lies in random and intermittent natures of wind energy, and the other is the significant difference in wind turbine types (Zhu et al., 2020a). These reasons make it challenging to cluster wind farms.
Currently, wind power dynamic modeling studies are limited inside wind farms. Dynamic equivalences of wind farms are divided into two categories: “single-machine” wind farm aggregation method and “multi-machine” method, depending on whether one or more machines are used to represent the wind farm (Muljadi and Parsons, 2006). The single-machine method uses one equivalent machine to replace the wind farm (Fernández et al., 2008; García-Gracia et al., 2008; Fernández et al., 2009). A wind farm consisting of the same type of wind turbine is equivalent to one expansion turbine. However, there is an error when the wind farm spans a wild area, and equivalence into a single wind turbine cannot act the dynamic characteristics. Then, the multi-machine method is proposed to overcome these drawbacks. Wind turbines are clustered into different groups considering the turbine types and operating conditions, then aggregates the turbines in each group separately. For example, considering the composition of DFIGs, converter controllers and crowbar protection are proposed for clustering (Fang and Wu, 2016). Early studies of wind turbine clustering are based on steady-state operation as the indicators, such as wind speed (Meng et al., 2013) and wake effect (Tian et al., 2017). However, wind speed does not accurately characterize the operating state of wind farms, which may lead to errors. Artificial algorithms have recently been applied to cluster wind turbines, including the density peak clustering algorithm, K-means, and fuzzy clustering algorithms (Zou et al., 2015; Liu et al., 2019). The references above mainly concentrated on DFIG. Recently, the dynamic equivalence of PMSG also has attracted attention (Wang et al., 2020; Wang et al., 2021a). Besides, Ref (Wang et al., 2021b) proposes an artificial algorithm to build dynamic equivalent models of DFIG and PMSG, but different indicators need to be extracted using algorithms to cluster for different models. However, these algorithms must be trained with datasets, which is time-consuming.
After the clustering of wind farms, the next step is to perform parameter aggregation of coherent wind turbines, which can identify parameters for an equivalent model and ensure that the accuracy of the dynamic responses is comparable to that of the original system. Currently, the capacity-weighted average method (Zhou et al., 1109) and the parameter identification method (Zin et al., 2003; Shao et al., 2021) are mainly used for parameter aggregation.
The dynamic equivalence for various wind farms, especially in an urban grid, is an aspect that has not been widely studied in earlier work. Some scholars have been interested in dynamic equivalence among multiple wind farms. Ref (Wang et al., 2018) gives the basis for clustering of doubly-fed wind turbines from different perspectives. Then the index of the similarity achieves clustering by the similarity of the output power characteristics of the point of common coupling (PCC). The coherency idea of synchronous generators is utilized for reference. Ref (Zhu et al., 2020b) constructs a clustering index based on the equivalent power angle in multiple scenarios, trying to discern the coherency between wind farms from a data-driven perspective. However, the proposed equivalent power angle is difficult to obtain directly during operation and only applies to doubly-fed wind farms.
The above approaches are inappropriate in urban power grids where wind turbines and farms are distributed broadly. In addition to wind randomness and model differences of various turbines, constraints in the urban grid need to be considered, such as the dispersion of the wind farm distribution. These reasons make it difficult to build a rational model of various wind farms. Therefore, this paper focuses on the equivalent modeling of wind farms in urban power grids.
The major influencing factors of the dynamic characteristics of wind turbines can be classified into three categories: 1) the type of the turbine, the control methods, and corresponding parameters; 2)the steady-state operation of the turbine representing a stable equilibrium point; 3)and the contingencies. The two most commonly used wind energy conversion systems in urban power grids are doubly-fed induction generators (DFIG) and permanent magnet direct-drive synchronous generators (PMSG). They have considerable differences, cannot be clustered into a group, and need to be studied separately. After separating multiple wind farms in the urban power grid according to the turbine types, it is also necessary to consider the consistency of the static and dynamic characteristics. The clustering of wind farms needs to be constrained by comprehensive conditions, such as urban geographic topology, terrain differences, and short-circuit capacity.
In order to address the abovementioned challenges, this paper focuses on attracting the key attributes that can characterize wind farms’ dynamics and suit different wind turbine models. We construct a comprehensive constraint, especially considering the geographic topology of the urban power grids. We introduce the similarity based on the dynamic timing warping (DTW) distances and derive the similarity index for clustering the coherent wind farms. It is convenient to quantify the similarity for loop comparison and get the optimal clustering effect. We adopt a two-stage cluster based on the proposed index that satisfies both steady-state and dynamic consistency. After the clustering, the wind farm parameters are aggregated using an active power-weighted method (Zhu et al., 2020b).
The remainder of this paper is organized as follows. Section 2 finds attributes that characterize the wind farms in urban power grids separately by analyzing models. Section 3 introduces the similarity based on the dynamic timing warping (DTW) distances and constructs the similarity index for clustering the coherent wind farms. Section 4 provides an overview of the dynamic equivalence process for multiple wind farms in urban power grids. Furthermore, in Section 5, the effectiveness of the dynamic equivalence method for multiple wind farms in urban power grids is demonstrated by case studies.
Figure 1 illustrates the simplified schematic structure of an urban power grid in which cleaner alternatives, primarily-wind turbines, and photovoltaics, are effectively addressed. We focus on DFIG and PMSG in this section and aim to find the key attributes of wind farms’ dynamic characteristics from the working principle and mathematical-physical model separately. Some assumptions are made considering urban power grids’ profiles, configurations, and operational data.
1) A wind farm in an urban power grid is internally composed of the same model. Thus, the wind farms are expanded into a single wind turbine with equivalent capacity.
2) The controller and other parameters of the same model are the same.
3) Wind turbines have the same control strategy within one wind farm.
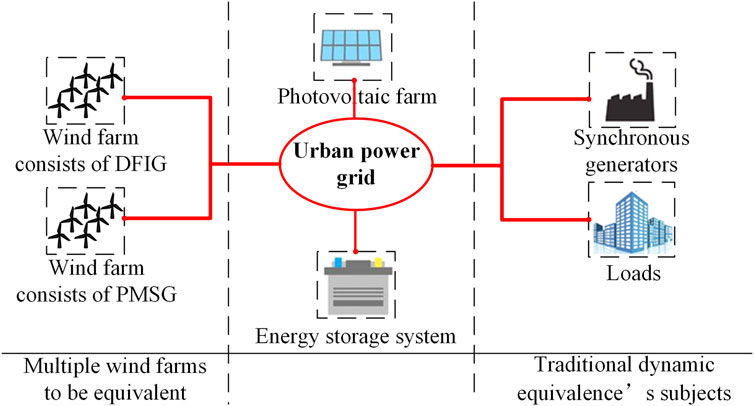
FIGURE 1. Schematic structure of WFs in urban power gird.
A typical structure of a DFIG is shown in Figure 2.
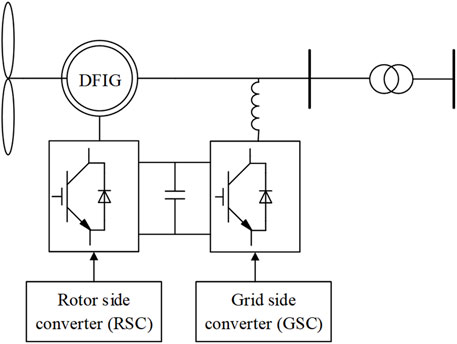
FIGURE 2. Basic structural diagram of a doubly fed induction generator.
The voltage equation and the flux-linkage equation of DFIG in the stator three-phase stationary coordinate system can be expressed as follows:
where,
A typical structure of a PMSG is shown in Figure 3.
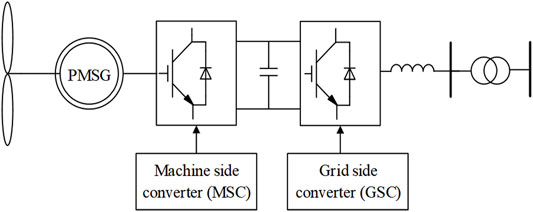
FIGURE 3. Basic structural diagram of a permanent magnet wind power generator.
PMSGs do not have rotor excitation windings, so only the stator voltage equation needs to be considered. The voltage equation and the flux-linkage equation of PMSG in the stator three-phase stationary coordinate system can be expressed as follows:
where,
The converter models of the two types of wind turbines are the same since both sides of the converter are connected in a back-to-back structure. The converters on both sides are decoupled in the d-q coordinate system through their control loops and the DC link. Thus, we enable the conversion from the ac component in three-phase stationary coordinates to the DC component in d-q-0 coordinates, making the problem easier to analyze.
The overall control block diagram of the rotor side converter and machine side converter of the wind turbines is shown in Figure 4. The converter is controlled by a double closed-loop structure of outer loop control and inner loop control together. In the outer loop power control, the input active power (Pref) is obtained through the maximum power control. The reactive power is obtained as its input, and the inner loop current input is adjusted through PI controller to obtain the rotor side and machine side current values
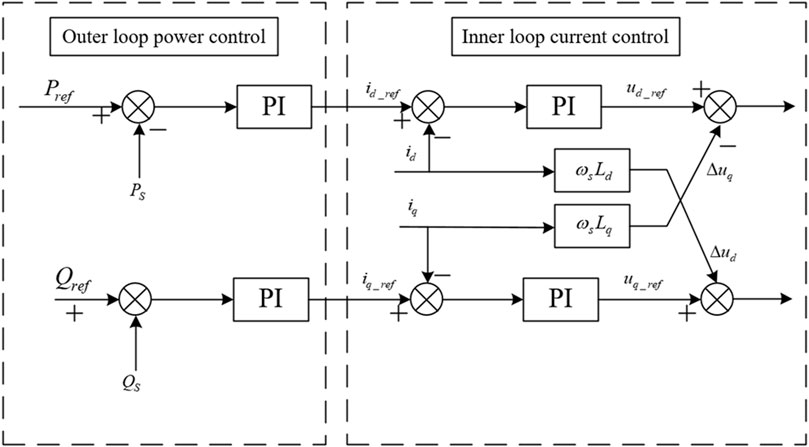
FIGURE 4. Control block diagram of the rotor side converter and machine side converter.
The overall control block diagram of the grid side converter is shown in Figure 5. The control process of the grid side converter is similar. It is also controlled by a double closed loop structure similar to the rotor side converter. In the outer loop power reactive control, the DC voltages
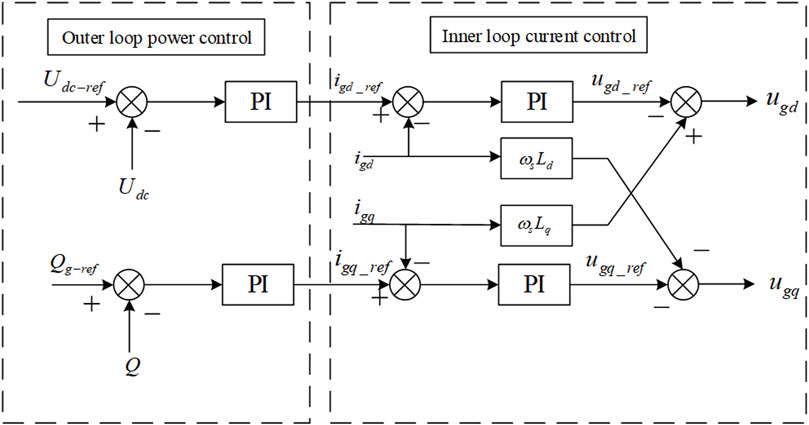
FIGURE 5. Control block diagram of the grid side converter.
Take a DFIG as an example. When the grid voltage dip fault occurs, the composition contains DC attenuation components, rotor frequency attenuation components, and positive/negative sequence components that can affect the dynamic characteristics of the DFIG.
Assuming that a fault occurs in the grid at t = 0, resulting in a voltage drop, for any grid voltage drop type, the port voltage of the turbine can be expressed as a combination of positive sequence voltage and negative sequence voltage after the fault instant.
where,
The equation for the stator fault current is shown below. These equations show that the short-circuit current is correlated with the rotor speed and the degree of voltage dip for DFIG in the same area under the same fault.
where
From the wind turbine perspective, the rotor speed variation represents the transient response characteristics during the electromagnetic transient process of DFIG ignoring the mechanical motion. However, in the operation of the urban power grid, the wind turbine is connected to the main grid through power electronics. The rotor angle variation curve cannot be directly obtained. We provide a clustering indicator in practical applications.
The active power output of DFIG is shown as follow:
where
In contrast to DFIG, PMSG is connected to the grid through full-scale back-to-back converters. The machine side converter (MSC) controls the speed and power of the generator, and the grid side converter (GSC) realizes the conversion of mechanical energy to electrical energy. A DC filter capacitor between the two converters decouples between the machine side converter and the network side converter, separating the generator from the grid.
When the voltage of PCC falls from
However, the instantaneous current is
Considering the power equilibrium:
From the equation, it can be seen that the extra power
The wind farm dynamic equivalent model aims to study the external characteristics of the wind farm, which are closely related to the control characteristics of its converter. For example, the grid side converter is controlled by a constant DC voltage
The mathematical model of the net-side converter can be expressed as:
where
Neglecting the losses in the DC link and the converter, the active and reactive power output from the grid side can be expressed as:
where
The active power input to the grid from the grid side converter is related to the DC voltage. In order to stabilize the DC voltage, the output of the DC voltage controller can be used as the reference value of the d-axis current component to realize the control of the DC voltage. From the equation, we can infer that the active power output from the PMSG can characterize the variation of the DC voltage. As analyzed above, the DC voltage is positively correlated with the voltage value of PCC. The active power can characterize the output characteristics of the PMSG. Therefore, the dynamic coherency of PMSG can be measured by considering both the degree of voltage dip at the PCC and the generator output active power.
According to the above analysis, although the operating principles and mathematical-physical models of DFIG and PMSG are significantly different, they can be clustered using the same indicators. From the grid side, the PCC voltage transient curve of the wind turbine affects its dynamic characteristics; from the wind turbine side, the active power is used to characterize its output characteristics. Combining these two indicators, we can use the same indicators to classify different types of wind turbines by the same regulation, respectively.
For synchronous generators, the swings of their rotors under different disturbances can act as the criterion for coherent identification, as shown in following equation.
where
This criterion cannot apply directly to wind farms because converters play crucial roles in energy conversion and separate wind generators and grids. However, the core idea is still attractive since swings of rotors can represent generators dynamics, and a 5°to 10°deviation is considered acceptable for a coherent group. We have the notion of inherent attributes for wind farms and then introduce an index of similarity to utilize fully.
The dynamic characteristics of wind farms have temporal deviations, but the overall profiles can have a similarity. To describe this character, this paper introduces the dynamic timing warping (DTW) to measure the time series and derive an index of similarity.
There are two trajectory time series
Define the warping path W as shown in the following equation to represent an alignment or mapping of sequences X and Y, as shown in Figure 6.
1) Boundedness constraint. The starting point of the path is
2) Continuity and monotonicity constraints. If

FIGURE 6. Principle diagram of warping path. The warping path needs to satisfy the following constraints.
Although many paths are satisfied with the above constraints, the one with the smallest cumulative distance is determined as the DTW distance between sequences X and Y. The cumulative distance
where
As shown in the following figure, Figure 7A shows the scenario when the Euclidean distance is used to measure the distance of two time series containing oscillations, while Figure 7B shows the application of DTW distance. It is straightforward to see that the DTW distance better measures the similarity in the oscillate time series.
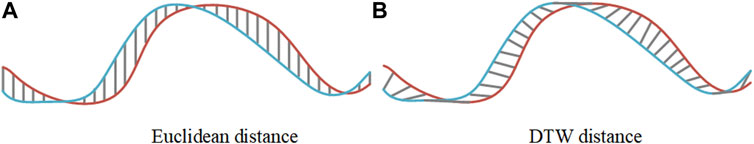
FIGURE 7. Difference between DTW distance and Euclidean distance. (A) Euclidean distance; (B) DTW distance.
Although the DTW distance can roughly determine whether the dynamic characteristics of the wind farms are consistent with each other, there is still a need for a quantitative index for a more precise clustering. The transient voltage at PCC and active power are sampled to calculate the DTW distance to describe the difference. A larger DTW distance implies a lower degree of similarity, while a smaller DTW distance implies a higher degree of similarity. Some issues have emerged. For example, the units of active power and transient voltage at PCC are not the same, and also the fluctuation range in case of faults is not the same. Therefore, before performing the DTW distance calculation, we normalize the two-time series within the interval [0,1], respectively, which helps quantify the index for clustering.
Considering the weights of the active power and the transient voltage at PCC during the dynamic process, the combined DTW distance of the two indicators can be written as follow:
Where
It is usually considered that voltage and active power are weighted equally, which we need simulation results to validate. Separate commercial models of the two wind turbines are used to build a single machine infinite bus system to compare their output characteristics. When the same three-phase short-circuit fault occurs, the voltage at PCC and active power of PMSG and DFIG without low-voltage ride-through protection and crowbar protection are shown in Figure 8 and Figure 9.
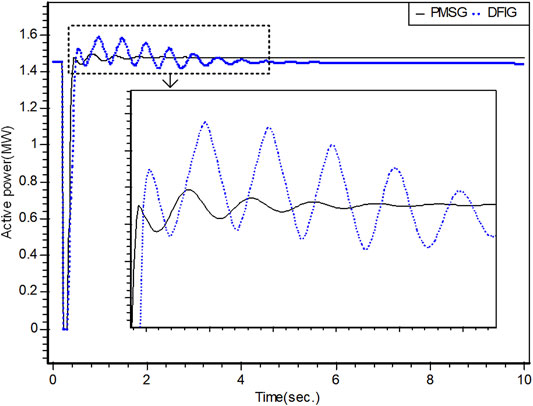
FIGURE 8. Active power of DFIG and PMSG.
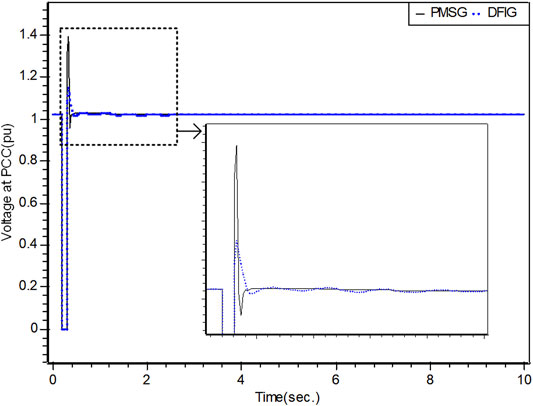
FIGURE 9. Voltages at PCC of DFIG and PMSG.
The active power fed into the grid by the PMSG decreases to zero and stays during the fault. After the fault ends, the active output rises instantly above the rated value and resumes stable operation after an oscillation. It is mainly because after a three-phase short-circuit fault occurs, the PMSG inverter controls the d-axis voltage to track the grid voltage down to zero, so the active power output drops rapidly. The voltage will be restored after the fault is cleared, and the outlet current cannot change abruptly. As to DFIG, the current fluctuation is relatively large, causing the active power to fluctuate above the rated value at the instant.
Although the output characteristics are different, the general profile is similar. DFIG and PMSG have similar control strategies. At the same time, the grid itself has certain limitations, such as low voltage ride-through and other control measures, which will limit the output characteristics to a certain safety range. Therefore, in the paper, the same weights are used to calculate the combined DTW distance of PMSG and DFIG. Thus, the combined DTW distance D, considering both indicators, can be calculated as follow:
Usually, we focus on the transient characteristic profile within 10s after the fault. The frequency is 50 Hz, which means 500 cycles are sampled for 10 s. The sampling step is typically 0.5 to 1 cycle. In order to save some computation time and reduce the cumulative error, the sampling step used in this paper is 1 cycle, so there are 500 sampling points. In this paper, we cluster the two wind farms into the same group when the combined DTW distance obtained from 500 sampling points is less than 15%, which means less than 75.
In order to obtain a reliable equivalent model, there are two processes of dynamic equivalence of multiple wind farms in an urban power grid: coherency clustering and aggregation of coherent wind farms. This section provides an overview of the process of dynamic equivalence of multiple wind farms in urban power grids.
The above sections have discussed the attributes representing the characteristics of wind farms and the index of wind farms’ similarity, respectively. This paper put the comprehensive constraints for wind farms in an urban power grid for the subsequent aggregation of wind farms and network simplification.
1) Since the models of DFIG and PMSG have large differences, wind farms of different types are not clustered into one group.
2) Considering geographic locations and topology constraints, we select 220 kV voltage level stations as the source. The wind farms in different topology regions can not be clustered into one group.
3) If two groups of wind farms belong to the same topological region, they may be clustered into one group only if the oscillations are similar.
Deviations in the power flow before and after dynamic equivalence and excessive connection lines can be greatly avoided with the above constraints.
After confirming the steady-state consistency, the active power and voltage at PCC are used as characteristics for clustering, as described above. It meets the steady-state and dynamic consistency requirements simultaneously and reduces the comparison workload, saving much time. After the fault, the transient characteristic data of 10 s are collected by continuously setting different faults.
In the collected data, oscillations and noises are inevitable. Since the DTW distance is sensitive to noises, it may not correctly identify the peak and trough. The wavelet transform (WT) is used to reduce noises. A relatively smooth time series can be obtained to meet the data requirements of the DTW distance. The wavelet-based threshold noise removal method is used to process the signal noises, which can effectively filter out the noises and guarantee the maximum effective signal without loss.
After processing the noise by wavelet transform, the collected data are normalized within the interval [0,1]. The DTW distance measures the similarity between the active power and the transient voltages at PCC of the wind farms. Setting the active power and the transient voltage at PCC to be of equal importance, Equation 22 obtains the combined DTW distance. If the combined DTW distance is less than 75, we can cluster the two wind farms into a group and vice versa.
The index for similarity proposed in this paper is straightforward to access. The initial coherent groups are decided by setting one fault. However, with different fault types and fault locations, the similarity of the output characteristics of the wind farms changes. Setting only one type of fault perturbation does not give accurate cluster results. Different faults should occur, and secondary clustering is performed based on the initial group for better accuracy.
After clustering, the wind farms in the same group need to be aggregated into one equivalent model. Reference literature (Zhu et al., 2020b) has proposed a parameter aggregation method based on active power weights. This method is easy to implement and has good accuracy, then is used here.
The flow chart of the dynamic equivalence of multiple wind farms within urban power grids is shown in Figure 10.
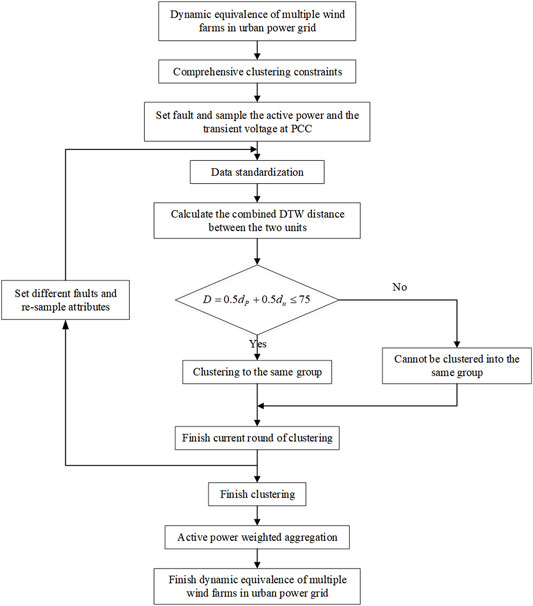
FIGURE 10. Process flow chart of dynamic equivalence among WFs.
We take an urban power grid integrated with many WFs in Yunnan province, China. As a relatively rich wind resource area, this grid contains 34 wind farms. It is representative of an urban power grid with multiple wind farms.
The topology of the system is shown in Figure 11. In order to satisfy the steady-state consistency before and after dynamic equivalence, preliminary groups are necessary, as shown by the wind farms divided by the red boxes in Figure 11. Thus, the preliminary results of clustering for these WFs can be obtained.
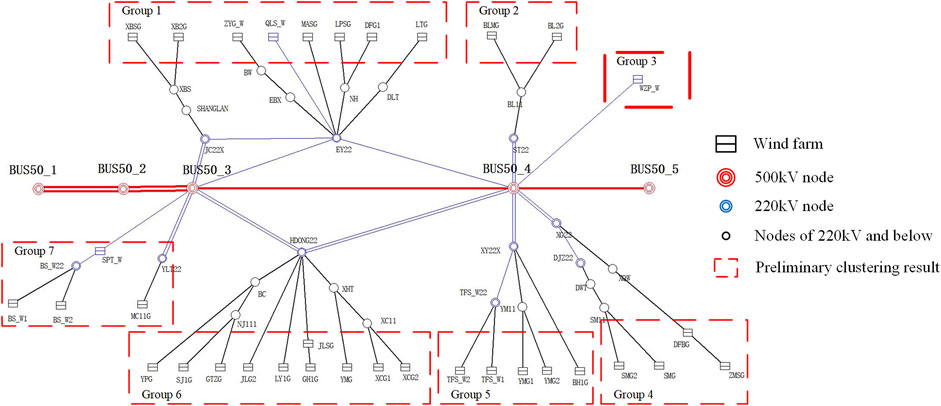
FIGURE 11. Geographical wiring diagram of WFs.
A further cluster based on the consistency of the dynamic response is carried out. As mentioned above, active power and transient voltage at PCC are selected as the clustering indicators.
We show the results of the case. For the initial clustering, a three-phase fault occurs in line BUS50-3- BUS50-4 at 2 s and disappears at 2.1 s. The DTW distances of WFs in Group 1 are shown in Table 1. According to the table, the DTW distance between QLS_W and all the rest of the wind farms is less than 75. Therefore, all WFs within Group 1 are coherent. As to WFs in Group 2, BL2G does not contribute to the power, should not be in this group. Furthermore, Group 3 contains only one wind farm and does not require further clustering. According to Table 2, we can learn that in Group 4, the combined DTW of ZMSG and DFBG is 9.58, which is less than 75 and can be divided into a group. The combined DTW of SMG and SMG2 is 49.62, which is less than 75 and can be divided into a group. In Group 5, as shown in Table 3, TFS_W1 coheres with TFS_W2, while YMG1, YMG2, and BH1G can be clustered in one group. According to Table 4, the DTW distance between LYG1 and all the rest of the wind farms, except XCG2, is less than 75. Therefore, all WFs in Group 6 are coherent. In Group 7, SPT_W, as shown in Table 5, cohere with BS_W1 and BS_W2, but has differences with MC11G. Therefore, MC11G forms a group by itself.
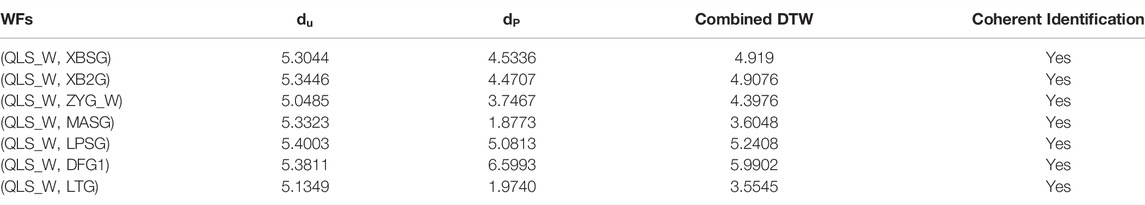
TABLE 1. Results of combined DTW distance in Group 1.
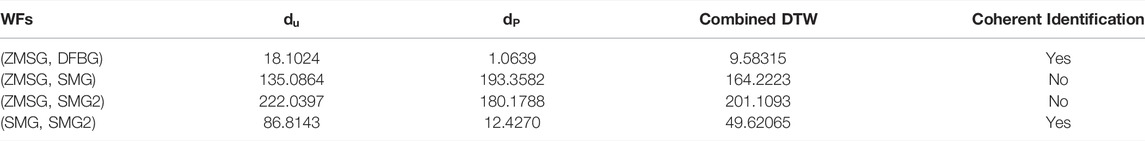
TABLE 2. Results of combined DTW distance in Group 4.
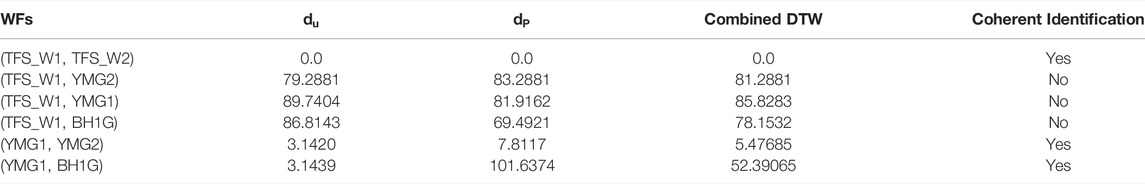
TABLE 3. Results of combined DTW distance in Group 5.
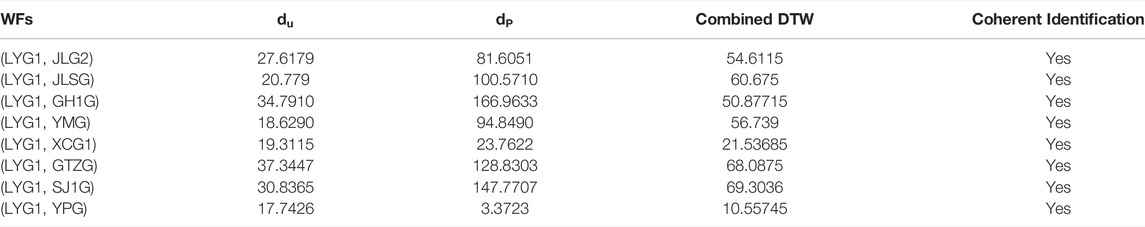
TABLE 4. Results of combined DTW distance in Group 6.

TABLE 5. Results of combined DTW distance in Group 7.
Setting only one fault perturbation does not give accurate cluster results. Different faults should occur for a double-check, and secondary clustering is performed based on the initial group for better accuracy. The final results of the clustering are shown in Figure 12.
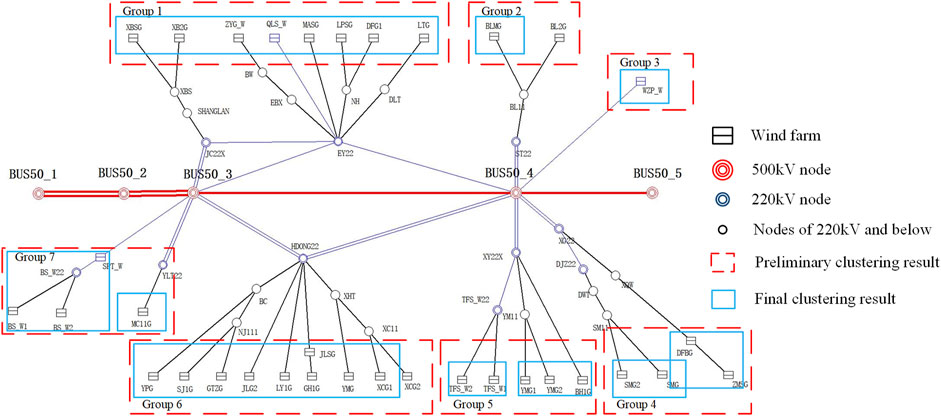
FIGURE 12. Results of clustering among WFs.
In this case, the wind farms are divided into 10 groups, which is about 70% less than the original 34 wind farms. This method will greatly simplify the wind power simulation scale of the original system.
It is necessary to verify the effect of wind farms’ dynamic equivalence compared with the original system. Besides preliminary and final results, the undesirable clustering results are also compared to verify the importance of rational clustering. After clustering and aggregating wind farms in each group, comparisons of the dynamic equivalence are shown in Figure 13 and Figure 14.
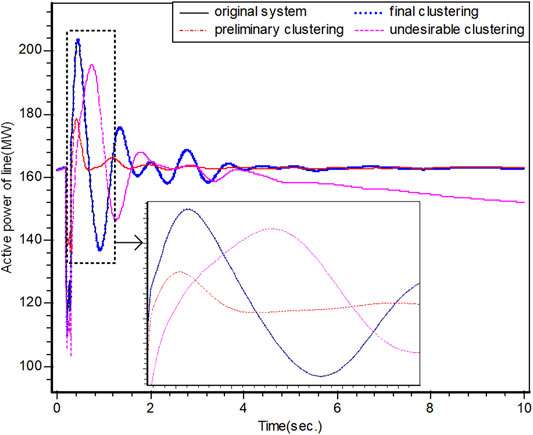
FIGURE 13. Active power of line SHANGLAN to JC22X.
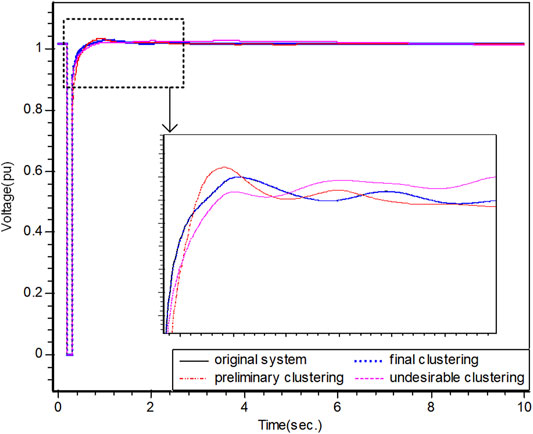
FIGURE 14. Voltage of bus BUS50_4.
It can be seen in the figures that the active power is sensitive to the clustering results, while the bus voltages do not have major differences. However, tracks of the original system and final clustering results maintain a high degree of overlap. The preliminary clustering results are better than the undesirable ones, but still have more considerable inaccuracy than the final ones in Figure 13.
This result successfully indicates that the proposed method can maintain the dynamic characteristics of the original system. Therefore, the index proposed in this paper is reasonable and precise. With the proposed method, the scale of the grid can be reduced while retaining high fidelity. The equivalent system will save time in the modeling and simulation of dynamic analysis.
This paper proposed a new dynamic equivalence method for multiple wind farms in an urban power grid. From the mathematical-physical models and operational control characteristics of DFIG and PMSG, the active power and the transient voltage at PCC are found as the clustering attributes. Thus, we introduce DTW distance to measure the similarity among wind farms. The clustering results of the index quantify the coherency between wind farms in a more refined way. The dynamic-state consistency and the steady-state consistency are both taken into account. Comprehensive clustering constraints ensure that the power flow and the basic structure of the urban power grid remain unchanged. The proposed method is validated to effectively reduce the power system size and the number of wind farms. The transient characteristics, including power and voltage of the aggregated system, are consistent with the ones in the original system. Simulation results prove the feasibility and accuracy of the proposed method.
This work mainly focuses on the dynamic clustering of wind farms in an urban power grid. The attributes with high correlation can be determined by analyzing the working principle for clustering and modeling. The method can also be extended to resources containing converters such as PV in our future work.
The original contributions presented in the study are included in the article/Supplementary Material, further inquiries can be directed to the corresponding authors.
LZ and SH conceived of the presented idea. ZW contributed significantly to analysis and manuscript preparation. MX carried out the experiments. YH verified the analytical methods. ML and MX encouraged LZ and SH to investigate the dynamic equivalence of multiple wind farms and supervised the findings of this work. ZW and YH took the lead in writing the manuscript. All authors discussed the results and contributed to the final manuscript.
This work is supported by Guangdong Provincial Key Laboratory of Intelligent Operation and Control for New Energy Power System (No. GPKLIOCNEPS-2021-KF-01).
The authors declare that the research was conducted in the absence of any commercial or financial relationships that could be construed as a potential conflict of interest.
All claims expressed in this article are solely those of the authors and do not necessarily represent those of their affiliated organizations, or those of the publisher, the editors and the reviewers. Any product that may be evaluated in this article, or claim that may be made by its manufacturer, is not guaranteed or endorsed by the publisher.
Dorfler, F., and Bullo, F. (2013). Kron Reduction of Graphs with Applications to Electrical Networks. IEEE Trans. Circuits Syst. I 60, 150–163. doi:10.1109/tcsi.2012.2215780
Fang, R., and Wu, M. B. I. (2016). Dynamic Equivalence of Wind Farm Considering Operational Condition of Wind Turbines. Rohde \& Schwarz; Springer, 827–830. IEEE; MEDs Technologies; CST; Infineon; Rolls Royce; Plexim; Keysight Technologies.
Fernández, L. M., García, C. A., Saenz, J. R., and Jurado, F. (2009). Equivalent Models of Wind Farms by Using Aggregated Wind Turbines and Equivalent Winds. Energy Convers. Manag. 50, 691–704.
Fernández, L. M., Jurado, F., and Saenz, J. R. (2008). Aggregated Dynamic Model for Wind Farms with Doubly Fed Induction Generator Wind Turbines. Renew. Energy 33, 129–140.
García-Gracia, M., Comech, M. P., Sallán, J., and Llombart, A. (2008). Modelling Wind Farms for Grid Disturbance Studies. Renew. ENERGY 33, 2109–2121. doi:10.1016/j.renene.2007.12.007
Liu, M., Pan, W., Zhang, Y., Zhao, K., Zhang, S., and Liu, T. (2019). A Dynamic Equivalent Model for DFIG-Based Wind Farms. IEEE Access 7, 74931–74940. doi:10.1109/access.2019.2918359
Meng, Z., Xue, F., and Li, X. (2013). Wind Speed Equalization-Based Incoming Wind Classification by Aggregating DFIGs. J. Mod. Power Syst. Clean. Energy 1, 42–48. doi:10.1007/s40565-013-0007-1
Muljadi, E., and Parsons, B. (2006). Comparing Single and Multiple Turbine Representations in a Wind Farm Simulation. Preprint 0003–01.
Shao, H., Cai, X., Yan, H., Zhou, J., Qin, Y., and Zhang, Z. (2021). PMSM Wind Farm Aggregation Algorithm Based on Power Equivalence Principle. Front. Energy Res. 9. 10-07 2021. doi:10.3389/fenrg.2021.771009
Tian, J., Zhou, D., Su, C., Chen, Z., and Blaabjerg, F. (2017). Reactive Power Dispatch Method in Wind Farms to Improve the Lifetime of Power Converter Considering Wake Effect. IEEE Trans. Sustain. Energy 8, 477–487. doi:10.1109/tste.2016.2607146
Wang, B., Zhu, L., and Chen, D. (2018). Mechanism Research on the Influence of Large Scale Wind Power Integration on Power System Angle Stability. Energy Procedia 145, 295–300. doi:10.1016/j.egypro.2018.04.054
Wang, T., Gao, M., Mi, D., Huang, S., and Wang, Z. (2020). Dynamic Equivalent Method of PMSG-Based Wind Farm for Power System Stability Analysis. IET Gener. Transm. & Distrib. 14, 3488–3497. doi:10.1049/iet-gtd.2020.0006
Wang, T., Huang, S., Gao, M., and Wang, Z. (2021). Adaptive Extended Kalman Filter Based Dynamic Equivalent Method of PMSG Wind Farm Cluster. IEEE Trans. Ind. Appl. 57, 2908–2917. doi:10.1109/tia.2021.3055749
Wang, Y., Li, Y. G., Xie, H., Wu, B. Y., and Yang, Y. N. (2021). Cluster Division in Wind Farm through Ensemble Modelling. IET Renew. Power Gener. 16 (7), 1299–1315. doi:10.1049/rpg2.12276
Weng, H., and Xu, Z. (2012). Dynamic Reduction of Large-Scale AC/DC Power Systems via Retaining the Trunk Network. Int. J. Electr. Power & Energy Syst. 43, 1332–1339. doi:10.1016/j.ijepes.2012.07.002
Zhou, Y., Zhao, L., Matsuo, I. B. M., and Lee, W. A Dynamic Weighted Aggregation Equivalent Modeling Approach for the DFIG Wind Farm Considering the Weibull Distribution for Fault Analysis. IEEE Trans. Industry Appl. 55, 5514–5523. doi:10.1109/tia.2019.2929486
Zhu, L., Zhang, J., Zhong, D., Wang, B., Wu, Z., Xu, M., et al. (2020). A Study of Dynamic Equivalence Using the Similarity Degree of the Equivalent Power Angle in Doubly Fed Induction Generator Wind Farms. IEEE Access 8, 88584–88593. doi:10.1109/access.2020.2993115
Zhu, L., Zhong, D., Wang, B., Lin, R., and Xu, M. (2020). Understanding Subsynchronous Oscillation in DFIG-Based Wind Farms with Rotor-Side Converter Control Based on the Equivalent RLC Model. IEEE Access 8, 65371–65382. doi:10.1109/access.2020.2983727
Zin, A., Kok, B. C., Mustafa, M. W., Lo, K. L., and Ariffin, A. B. I. (2003). “Time Domain Dynamic Aggregation of Generating Unit Based on Structurepreserving Approach,” . Malaysia Sect; Energy Commiss in Proceedings. National Power Engineering Conference, 2003 (IEEE), 154–160}. IEEE Power Engn Soc, Malaysia Chapter.
Keywords: urban power grid, dynamic equivalence, dynamic timing warping, doublyfed induction generator, permanent magnet direct-drive synchronous generator
Citation: Zhu L, Huang S, Wu Z, Hu Y, Liao M and Xu M (2022) A Study of Dynamic Equivalence Method for Multiple Wind Farms in Urban Power Grids. Front. Energy Res. 10:908207. doi: 10.3389/fenrg.2022.908207
Received: 30 March 2022; Accepted: 29 April 2022;
Published: 25 May 2022.
Edited by:
Kaiqi Sun, Shandong University, ChinaReviewed by:
Zhijun Qin, Guangxi University, ChinaCopyright © 2022 Zhu, Huang, Wu, Hu, Liao and Xu. This is an open-access article distributed under the terms of the Creative Commons Attribution License (CC BY). The use, distribution or reproduction in other forums is permitted, provided the original author(s) and the copyright owner(s) are credited and that the original publication in this journal is cited, in accordance with accepted academic practice. No use, distribution or reproduction is permitted which does not comply with these terms.
*Correspondence: Lin Zhu, emh1bEBzY3V0LmVkdS5jbg==; Zhigang Wu, ZXB6Z3d1QHNjdXQuZWR1LmNu
Disclaimer: All claims expressed in this article are solely those of the authors and do not necessarily represent those of their affiliated organizations, or those of the publisher, the editors and the reviewers. Any product that may be evaluated in this article or claim that may be made by its manufacturer is not guaranteed or endorsed by the publisher.
Research integrity at Frontiers
Learn more about the work of our research integrity team to safeguard the quality of each article we publish.