 Li Hao
- 1Electrical Engineering and New Energy, China Three Gorges University, Yichang, China
- 2Hubei Provincial Key Laboratory for Operation and Control of Cascaded Hydropower Station, China Three Gorges University, Yichang, China
Aiming at the problem of pollution insulator discharge mode monitoring in high voltage line, a new one-dimensional convolutional neural network structure (1D-CNN) was designed, and a pollution insulator discharge mode monitoring method based on acoustic emission signal and 1D-CNN was proposed. Firstly, the data was collected in laboratory of acoustic emission signal under different discharge after sliding access way to expand the sample quantity. Thereafter, the sample time and frequency domain was used along with a third octave data as input, using convolution neural network to discharge signal samples adaptive feature extraction and feature dimension reduction. Then, appropriate stride convolution alternative pooling layer was used in order to reduce the training model parameters and the amount of calculation. Finally, Softmax function was used to classify the predicted results. The identified results show that the model can achieve a recognition rate of more than 99.84%, which effectively solves the process of manual data preprocessing in the traditional insulator pollution degree monitoring method. Moreover, at the same time it can be effectively applied to the pollution insulator discharge mode monitoring task.
Introduction
Among the power system accidents that have occurred in my country in recent years, the insulator pollution flashover accident is one of the main disasters. In the atmospheric environment, the pollution in the air will adhere to the surface of the insulator and become damp, resulting in a pollution flashover accident (Ahmadi-Joneidi et al., 2013; Wang et al., 2014), which seriously affects the safe and smooth operation of the power grid and causes a lot of economic loss. The contamination discharge of insulators is accompanied by the generation of acoustic signals, and the intensity of the acoustic signals changes with the degree of discharge, which can better characterize the external insulation state of the insulator under the current operating state (Gencoglu and Cebeci, 2009; Su et al., 2009; Moula et al., 2013; Li et al., 2021b). Therefore, in practical engineering, the state evaluation of the external insulation state of the insulator can be realized by analyzing and processing the acoustic signals of the insulator discharge under different pollution states.
Scholars at home and abroad have carried out a lot of explorations in the acquisition, denoising, feature selection and extraction of the discharge acoustic signals of polluted insulators under operating conditions, and the establishment of on-line diagnosis and prediction models for insulator pollution. Literature (Tian et al., 2016) believes that the insulator pollution discharge consists of three stages, namely corona discharge, partial discharge and arc discharge, and the characteristics of the acoustic emission signal generated by the discharge are obviously different. Reference Tian et al. (2015) proposes to perform empirical mode decomposition on complex acoustic emission signals, and adaptively decompose the original acoustic signal into several components in different frequency bands, that is, eigenmode components. The energy distribution is compared and identified. In the literature (Wang and Nie, 2016), by studying the time-frequency characteristics of acoustic signals at different fouling degrees, it was found that the acoustic signal contains four characteristic quantities in both the mean value in the time domain and the spectral characteristics in the frequency domain, and the four characteristic quantities, the mean value, the maximum value, the standard deviation and the amplitude of the real part of the FFT of the acoustic signal in the time domain, were used for correlation analysis of the development process of insulator fouling discharge. In the literature (Wang et al., 2021), after manually simulating the effects of different soluble fouling adhesion densities and gray densities on the acoustic emission signals of glass insulators, a generalized regression neural network-based insulator hazard prediction model was established with the mean value of signal amplitude and the area of the maximum IFT semi-perimeter envelope as the main input feature quantities, and more accurate prediction results were obtained. In order to improve the prediction accuracy, the traditional machine learning classification method needs to preprocess the data to extract the data features and select an appropriate classification method.
For these series of problems, this paper considers Deep learning techniques to solve them. In recent years, many scholars have applied deep learning to the field of fault diagnosis and achieved very good results (Dong et al., 2014; Banik et al., 2016; Li et al., 2020; Yang et al., 2022a). Among them, recurrent neural networks (RNN) and convolutional neural networks (CNN) are widely used, and convolutional neural networks have been used by many scholars to build fault diagnosis models based on the feature processing of fault signal-time spectrograms due to their powerful processing ability of two-dimensional images (Li et al., 2019; Li et al., 2021a; Li et al., 2021b). Li et al. (2021c), proposed the bilinear transformation, effective data decomposition techniques, long-short-term-memory recurrent neural networks (LSTM-RNNs), and error decomposition correction methods. In the proposed approach, the angular wind direction data is firstly transformed into time-series to accommodate the full range of yaw motion. Then, the continuous transformed series are decomposed into a group of subseries using a novel decomposition technique. Moreover, Li et al. (2021d) utilized a data-driven approach for condition monitoring of generator bearings using temporal temperature data. During the analysis, four algorithms, the support vector regression machine, neural network, extreme learning machine, and the deep belief network are applied to model the bearing behavior. Comparative analysis of the models has demonstrated that the deep belief network is most accurate. It has been observed that the bearing failure is preceded by a change in the prediction error of bearing temperature. Convolutional neural networks tend to achieve recognition rates of more than 99% in the direction of fault diagnosis, but the current research in the direction of insulator fouling monitoring usually only uses traditional machine learning classification. Therefore, this paper proposes a one-dimensional CNN-based fouled insulator discharge pattern recognition algorithm, which does not require complex and time-consuming manual feature extraction, but simply takes the un-preprocessed time-frequency discharge signal as input, and the model uses the powerful feature learning capability of CNN to directly train the input signal as learning samples, and completes adaptive feature learning by combining with fully connected layers to realize the model for insulator fouling degree. The model uses the powerful feature learning capability of CNN to directly use the input signal as the learning sample for training, and completes the adaptive feature learning in combination with the fully connected layer to realize the model’s demand for insulator fouling degree monitoring, and gets good results after experimental verification.
Convolutional Neural Networks
Convolutional Neural Network Operations
CNNs usually include an input layer, a convolutional layer, a pooling layer, a fully connected layer and an output layer (Bashivan et al., 2015; Ye et al., 2021; Zhang L. et al., 2021). The convolutional layer and adjacent layers use local links and weight sharing to perform operations, while the pooling layer can also largely reduce the dimensionality of the input to prevent overfitting of the model during training and improve the generalization of the model. The pooling layer can also largely reduce the input dimension, prevent overfitting of the model during training, and improve the generalization capability of the model. The model uses alternating convolutional and pooling layers to extract features from the input data, and the learning ability of the CNN reliably increases with the number of layers of the network. The convolution operation procedure (Sajjad et al., 2019; Zhang et al., 2022) is illustrated as below.
In the formula:
The activation function is set after the convolutional layer, and when the data is extracted by features, the activation function can increase its nonlinear factor. In this paper, the LeakyReLU function (Zhang W. et al., 2021) is used. The LeakyReLU function solves the neuron death problem by giving all negative values of the inputs a slope greater than 0. The schematic diagram of LeakyReLU is as follows
Among them,
The pooling layer usually acts after the convolution layer to reduce the feature dimensionality and prevent overfitting. The pooling layer consists of two types of pooling, maximum pooling and average pooling, where the maximum pooling equation is as follows.
In the formula:
The Softmax classifier is most widely used in the output classification operation of the output layer (Zhao et al., 2017; Yang, 2021). The process is to output the logits values obtained from the convolution layer as a probability distribution and then perform pattern recognition, and the Softmax function operates as follows.
In the above stated formula:
Principle of One-Dimensional Convolutional Neural Network
The one-dimensional convolutional neural network can perform feature recognition on the part of the data sequence, use the convolution kernel to perform input transformation on the input sequence segment, and make the sequence features of a part of the sequence which can be saved in other locations of the sequence, making the one-dimensional convolutional neural network. The processing principle for different positions of the sequence is invariant (for time shift) (Toyoda and Wu, 2019; Madhiarasan, 2020; Le et al., 2021; Yang et al., 2021; Laghridat et al., 2022). One-dimensional convolution can extract partial sequence segments from time series and through the interaction of convolution and pooling, adaptive line feature extraction and dimensionality reduction are performed on the data.
One-Dimensional Convolutional Neural Network Insulator Monitoring Model
1D-CNN Model Overview
The transition coupling of different discharge stages of dirty insulators makes the discharge acoustic signals of dirty insulators uncertain, complex and big data. Because the core of the discharge pattern recognition of dirty insulators is to distinguish the pattern expression in the specific discharge signal under different discharge patterns so as to realize the recognition of the discharge pattern. The advantage of the recognition method based on CNN algorithm lies in the feature extraction and classification of massive data.
Therefore, this paper proposes a discharge mode monitoring algorithm for dirty insulators based on one-dimensional convolutional neural network. It consists of a convolution layer and an output layer. The convolution layer implements the adaptive feature extraction operation on the discharge signal data, and the nonlinear robust feature with the gradually decreasing matrix width is obtained through the convolution operation. Unlike 2D-CNN processing image data, the pooling layer does not compress the convolutional data ideally. Therefore, this paper does not use the pooling layer, but uses stridden convolution with a suitable number of steps in the convolutional layer instead of the pooling layer to perform the compression operation. The output layer is composed of a fully connected layer, and every two connected layers are connected by a finite number of neurons, and the number of nodes is the same as the number of discharge types.
The cross-entropy loss function is used in the training process of the model, and the Adam optimizer (Nie et al., 2016; Wu et al., 2020; Anjaiah et al., 2022; Yang et al., 2022b) with fast convergence speed and stable convergence process is used to optimize the model based on gradient descent. At the same time, the model uses the Softmax function to output the cross-entropy between the probability distribution of the acoustic emission signal type and the probability distribution of the discharge type of the dirty insulator as the cost function. The formula for calculating cross entropy is stated below.
In the formula:
Data Pre-Processing
The data pre-processing mainly includes: data enhancement of the raw acoustic signal data using data window sliding fetch, generation of training and test sample sets, labeling of discharge types, and introduction of the 1/3 octave concept to amplify the differential features of different discharge mode signals in the high or low frequency bands.
The process of network training in Deep learning requires sufficient data samples, and the experimental data used in this paper are limited, in order to expand the number of samples while preserving the correlation between adjacent timing signals of the same discharge signal. In this paper, a sliding window fetching method is proposed to divide the data into small samples to achieve the enhancement of the number of data samples.
Different from other models that only use signal time-frequency features as model input, this paper introduces the concept of octave. There are two main ways of expressing frequency. One is equal-width frequency range, which means that the coordinate difference between adjacent frequencies on the X-axis is constant. The other is octave, which means that the ratio of adjacent frequency coordinates on the X-axis is a fixed constant. Generally speaking, when we analyze the spectral characteristics of the signal, we do not study all the frequencies in the signal one by one, but the octave is to divide the signal into frequency bands to display the sound pressure levels of different frequency bands of the signal data. Since the gap between the discharge signals of different pollution levels often exists in the high frequency or low frequency band, this paper uses the 1/3 octave amplitude feature as a feature input of the model and the 1/3 octave frequency of the three discharge modes is used.
One-Dimensional Convolutional Neural Network Intelligent Monitoring Process
The proposed one-dimensional convolutional neural network fouling insulator discharge pattern monitoring process is shown in Figure 1. The original data signal collected from the experiment is augmented by the sliding window method for the number of samples and divided into training set and test set; the one-dimensional convolutional neural network model is established on Pytorch version 1.11.0, and the model is trained by gradient descent using mini batch after inputting sample data from the training set, where the hyperparameter of batch size is 64. The accuracy and loss function curves of the training set and test set are recorded and the predicted discharge pattern is output after the model is completed training. The accuracy and loss function curves of the training set and test set are recorded and the predicted signal discharge patterns are output, and finally the model performance is evaluated visually using the t-distribution Stochastic Neight-bor Embedding (t-SNE) and the test set confusion matrix.
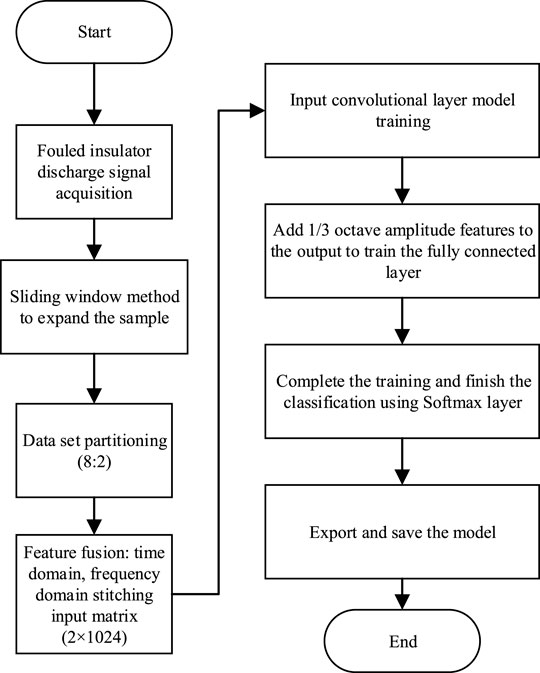
FIGURE 1. Fouled insulator discharge mode monitoring process.
Fouled Insulator Discharge Pattern Monitoring Experiment
Experimental Design and Data Description
In order to verify the effect of the monitoring model proposed in this paper, a large number of discharge tests of fouled insulators were conducted in the high-voltage test chamber, mainly collecting sound data of corona discharge, surface discharge and breakdown arc discharge of insulators when fouled insulators were subjected to processing frequency or shock voltage, and recording the corresponding discharge phenomena. The test equipment includes: frequency voltage generator, shock voltage generator, oscilloscope, sound acquisition device and various types of fouling production tools (brush, sodium chloride, diatomaceous earth, test, spray pot and pure water).
In this experiment, the sound signals of 2 wet porcelain insulators with different degrees of fouling discharging at 10 different locations were collected and the equivalent attached salt densities was used to measure the degree of fouling of insulators. Each insulator specimen was coated with sodium chloride and diatomaceous earth, after calculated weighing, plus an appropriate amount of distilled water, and mixed thoroughly in a porcelain bowl. In order to increase the degree of adhesion an appropriate amount of dextrin could be added, and finally evenly applied to the surface of the insulator with a brush. The fouled insulator specimens made in this way can be tested without sampling, and this easy-to-operate pollution method is mostly used in China. Since sodium chloride is water-absorbent, it can be fully dried before weighing, and then weighed with a balance to ensure the experimental accuracy.
The ratio of gray density to salt density of the actual operating insulators varies greatly, and the actual local accumulation of dirt, the gray to salt ratio is taken as 5:1. Under this gray to salt ratio, the mass of salt and ash to be painted on the whole insulator surface with different attached salt density is shown in Table 1 below. The above-mentioned stain coated in porcelain insulator 2 pieces as a group, apply the industrial frequency voltage, the amplitude is the rated voltage of insulator string, record the industrial frequency voltage experiment results, then use the voltage reduction method, time 2 min each time, determine the flashover voltage, record the discharge sound.

TABLE 1. 1D-CNN algorithm and other algorithms accuracy comparison table.
The acoustic emission signals of three discharge states, namely corona, surface discharge and arc, were collected at a sampling frequency of 131072 HZ. 655360 data points were included for the corona and surface discharge states, and 1,048,000 data points were included for the arc discharge state. After a simple frequency domain analysis, it was found that the sampling frequency was too high and the actual main frequency was very low. So sparse sampling was performed, i.e., every 100 data points were sampled once. Each data is sampled by sliding window sampling method with 1024 data points as a sample and 50 data points as a step to achieve sample set expansion, and for each insulator fouling discharge mode 80% of the data set is randomly selected for training and 20% of the data set is used for testing. Therefore, the sparsely sampled and expanded data set consists of 4930 training samples and 1266 test samples, and the category labels are set to 0, 1, and 2. The input to the convolution layer of each model is the time-domain signal of one sample plus the Fourier-transformed frequency-domain signal splicing matrix (2 × 1024), and the 1/3-octave amplitude features of the sample are spliced with the convolution output feature matrix and input to the full connected layer for training. The size and number of convolutional kernels in the four convolutional layers of the network model are set to 16 × 1, 16 × 1, 8 × 1, 8 × 1 and 16, 16, 8 and 8, respectively, and the convolutional kernel step size is set to 2. Data normalization is performed using Batch Normalization and supplemented with padding as input mapping.
Analysis of Experimental Results
The output size of each network layer of the 1D-CNN model proposed in this paper is shown in Figure 2. The variation of the accuracy of the 1D-CNN algorithm with the number of iterations analyzed are the recognition rate and loss function value of the fouled insulator discharge state of the test set samples, respectively. As the number of iterations increases, the accuracy of the test set output of the model also gradually increases and the value of the loss function gradually decreases. After iteration, the accuracy of the test set reaches 99.84% and is similar to that of the training set, and there is no overfitting phenomenon.
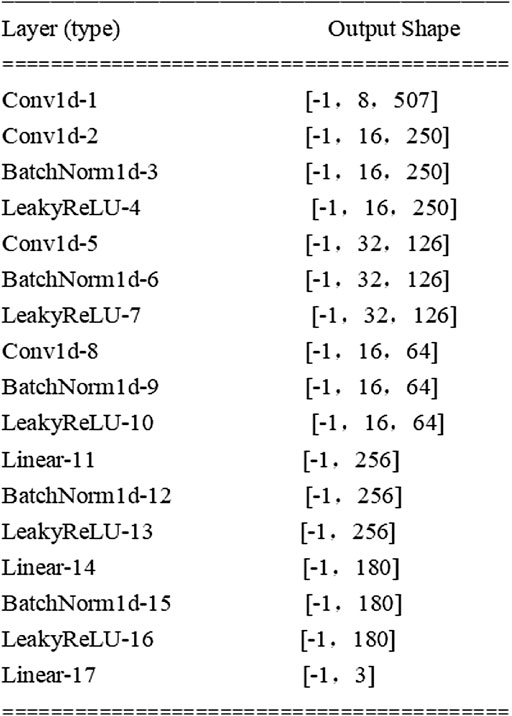
FIGURE 2. 1D-CNN output size of each network layer.
In this paper, the performance of the 1D-CNN algorithm for data processing was also visualized and analyzed. In this paper, the t-distribution domain embedding algorithm was used to visualize and analyze the features of the fouled insulator discharge signal after convolution with different convolution layers in a 2-D distribution, as shown in Figure 3.
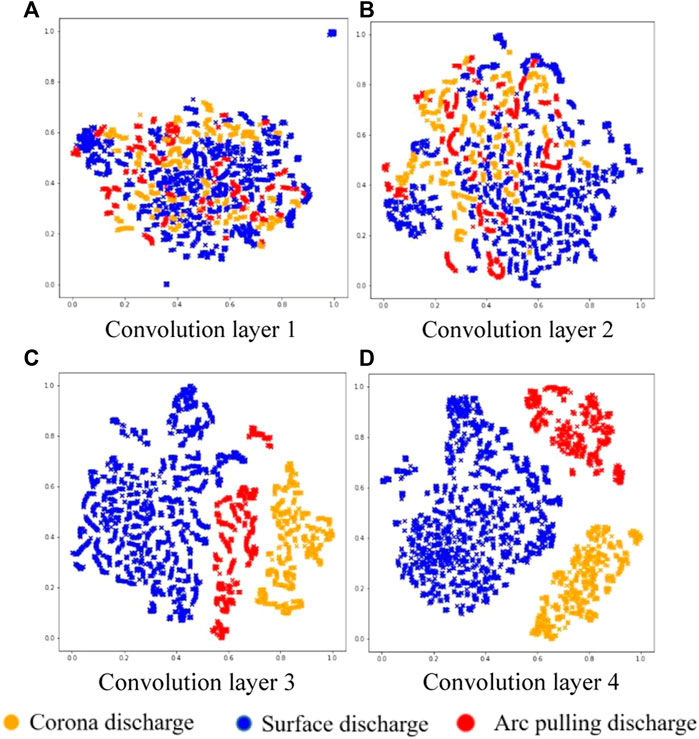
FIGURE 3. Visualization results of discharge signal data samples. (A) Convolution layer 1 123 (B) Convolution layer 2. (C) Convolution layer 312 3 (D) Convolution layer 4.
In order to better evaluate the recognition effect of the model, this paper also used the validation set to input into the trained convolutional neural network model for simulation validation, where the accuracy of the surface discharge state in the data samples of fouled insulators reached 100%, and the accuracy of the corona discharge and arc discharge states also reached 99.13% and 99.6%, respectively.
To compare the classification effectiveness of the algorithms studied in this paper with manually extracted features plus machine learning classification algorithms and other Deep learning algorithms, XGBoost, Back Propagation Neural Network (BPNN) and 1D-CNN algorithms were selected for comparison through experiments. XGBoost and BP are common algorithms in machine learning and Deep learning, respectively. Among them, XGBoost algorithm is to classify the statistical features of the time-frequency domain of the discharge signal, and BPNN is to input the time-frequency and 1/3 octave data into the BP network for classification, both of which are commonly used classification algorithms. The final accuracy obtained by experimentally comparing the three discharge pattern recognition algorithms is shown in Table 1.
Conclusion
In this paper, we proposed an algorithm of fouling insulator discharge pattern recognition based on acoustic signal and 1D-CNN for fouling insulator discharge pattern monitoring model. And the experiments were designed to collect the acoustic emission signal data of fouled insulator discharge under different modes, and the practicality and accuracy of this model were verified by using this as a sample simulation. It solves the complexity of the previous manual production of features, and becomes a new direction to solve the problem of insulator fouling degree monitoring.
The main contributions of this study are.
(1) A novel one-dimensional convolutional neural network structure (1D-CNN) was designed, and an insulator fouling detection model based on acoustic signals and 1D-CNN was proposed, which enabled the model to adaptively extract and classify features from time-frequency signal data and obtained a high recognition accuracy.
(2) In the case of limited data, the sliding window method was used to divide the data for fetching, and the concept of 1/3 octave range was introduced to optimize the training process of the model.
(3) The performance of the convolutional layer in the 1D-CNN algorithm was visualized using the t-SNE visualization algorithm, and the intrinsic mechanism of the 1D-CNN algorithm was explored.
(4) Through comparison tests with the traditional XGBoost and BPNN algorithms, the superiority of the proposed model in terms of accuracy was verified, and it could be effectively used for the early warning of fouling insulator flicker.
Data Availability Statement
The raw data supporting the conclusion of this article will be made available by the authors, without undue reservation.
Author Contributions
LH, CZ and CX conceived the experimental ideas and designed and implemented the experiments under the leadership of LZ. XY compiled the data and LH wrote the manuscript.
Funding
This project was supported by the Key Project of Science and Tech-nology Research Plan of Education of Hubei under Grant D20201203.
Conflict of Interest
The authors declare that the research was conducted in the absence of any commercial or financial relationships that could be construed as a potential conflict of interest.
Publisher’s Note
All claims expressed in this article are solely those of the authors and do not necessarily represent those of their affiliated organizations, or those of the publisher, the editors, and the reviewers. Any product that may be evaluated in this article, or claim that may be made by its manufacturer, is not guaranteed or endorsed by the publisher.
Acknowledgments
The authors would like to thank the reviewers for their valuable comments and suggestions to improve the quality of this paper.
References
Ahmadi-Joneidi, I., Majzoobi, A., Shayegani-akmal, A. A., Mohseni, H., and Jadidian, J. (2013). Aging Evaluation of Silicone Rubber Insulators Using Leakage Current and Flashover Voltage Analysis. IEEE Trans. Dielect. Electr. Insul. 20, 212–220. doi:10.1109/TDEI.2013.6451360
Anjaiah, K., Dash, P. K., and Sahani, M. (2022). A New Protection Scheme for PV-Wind Based DC-ring Microgrid by Using Modified Multifractal Detrended Fluctuation Analysis. Prot. Control Mod. Power Syst. 7, 8. doi:10.1186/s41601-022-00232-3
Banik, A., Dalai, S., and Chatterjee, B. (2016). Autocorrelation Aided Rough Set Based Contamination Level Prediction of High Voltage Insulator at Different Environmental Condition. IEEE Trans. Dielect. Electr. Insul. 23, 2883–2891. doi:10.1109/tdei.2016.7736849
Bashivan, P., Rish, I., Yeasin, M., and Codella, N. (2015). Learning Representations from EEG with Deep Recurrent-Convolutional Neural Networks. arXiv. 1511.06448 [Preprint]Available at: https://arxiv.org/abs/1511.06448 (Accessed Feb 29, 2016).
Dong, B., Jiang, X., Zhang, Z., Hu, J., Hu, Q., and Shu, L. (2014). Effect of Environment Factors on Ac Flashover Performance of 3 Units of Polluted Insulator Strings under Natural Fog Condition. IEEE Trans. Dielect. Electr. Insul. 21, 1926–1932. doi:10.1109/tdei.2014.004214
Gencoglu, M. T., and Cebeci, M. (2009). Computation of AC Flashover Voltage of Polluted HV Insulators Using a Dynamic Arc Model. Euro. Trans. Electr. Power 19, 689–701. doi:10.1002/etep.249
Laghridat, H., Essadki, A., and Nasser, T. (2022). Coordinated Control by ADRC Strategy for a Wind Farm Based on SCIG Considering Low Voltage Ride-Through Capability. Prot. Control Mod. Power Syst. 7, 7. doi:10.1186/s41601-022-00227-0
Le, S., Wu, Y., Guo, Y., and Vecchio, C. D. (2021). Game Theoretic Approach for a Service Function Chain Routing in NFV with Coupled Constraints. IEEE Trans. Circuits Syst. II 68 (12), 3557–3561. doi:10.1109/TCSII.2021.3070025
Li, H., Deng, J., Feng, P., Pu, C., Arachchige, D. D. K., and Cheng, Q. (2021). Short-Term Nacelle Orientation Forecasting Using Bilinear Transformation and ICEEMDAN Framework. Front. Energy Res. 9, 780928. doi:10.3389/fenrg.2021.780928
Li, H., Deng, J., Yuan, S., Feng, P., and Arachchige, D. D. K. (2021). Monitoring and Identifying Wind Turbine Generator Bearing Faults Using Deep Belief Network and EWMA Control Charts. Front. Energy Res. 9, 799039. doi:10.3389/fenrg.2021.799039
Li, Z., Jiang, W., Abu-Siada, A., Li, Z., Xu, Y., and Liu, S. (2021). Research on a Composite Voltage and Current Measurement Device for HVDC Networks. IEEE Trans. Ind. Electron. 68, 8930–8941. doi:10.1109/TIE.2020.3013772
Li, Z., Tao, Y., Abu-Siada, A., Masoum, M. A. S., Li, Z., Xu, Y., et al. (2019). A New Vibration Testing Platform for Electronic Current Transformers. IEEE Trans. Instrum. Meas. 68 (3), 704–712. doi:10.1109/TIM.2018.2854939
Li, Z., Xiang, X., Hu, T., Abu-Siada, A., Li, Z., and Xu, Y. (2020). An Improved Digital Integral Algorithm to Enhance the Measurement Accuracy of Rogowski Coil-Based Electronic Transformers. Int. J. Electr. Power & Energy Syst. 118, 105806. doi:10.1016/j.ijepes.2019.105806
Li, Z., Yu, C., Abu-Siada, A., Li, H., Li, Z., Zhang, T., et al. (2021). An Online Correction System for Electronic Voltage Transformers. Int. J. Electr. Power & Energy Syst. 126, 106611. doi:10.1016/j.ijepes.2020.106611
Madhiarasan, M. (2020). Accurate Prediction of Different Forecast Horizons Wind Speed Using a Recursive Radial Basis Function Neural Network. Prot. Control. Mod. Power Syst. 5, 230–238. doi:10.1186/s41601-020-00166-8
Moula, B., Mekhaldi, A., Teguar, M., and Haddad, A. (2013). Characterization of Discharges on Non-uniformly Polluted Glass Surfaces Using a Wavelet Transform Approach. IEEE Trans. Dielect. Electr. Insul. 20, 1457–1466. doi:10.1109/TDEI.2013.6571469
Nie, D., Zhang, H., Adeli, E., Liu, L., and Shen, D. (2016). “3D Deep Learning for Multi-Modal Imaging-Guided Survival Time Prediction of Brain Tumor Patients,” in International Conference on Medical Image Computing and Computer-Assisted Intervention (Cham: Springer), 212–220. doi:10.1007/978-3-319-46723-8_25
Sajjad, M., Khan, S., Hussain, T., Muhammad, K., Sangaiah, A. K., Castiglione, A., et al. (2019). CNN-based Anti-spoofing Two-Tier Multi-Factor Authentication System. Pattern Recognit. Lett. 126, 123–131. doi:10.1016/j.patrec.2018.02.015
Su, Z. A., Chen, J. S., and Wang, C. K. (2009). Application of Vibration Method in Bearing Noise Measurement. J. Harbin Bear. 30, 59–62. doi:10.3969/j.issn.1672-4852.2009.02.030
Tian, S., Jin, Y., Shu, N., Shao, C., and Zhang, Y. (2016). China Electr. power 49 (07), 15–19+38. doi:10.11930/j.issn1004-9649.2016.07.015.05
Tian, X., Meng, F., and Tian, S. (2015). Identification of Pollution Insulator Discharge Based on Energy Distribution of Empirical Mode Decomposition and Grey Similarity Correlation Degree [J]. Smart power grid 3 (04), 298–302. doi:10.14171/j.2095-5944.sg.2015.04.004
Toyoda, M., and Wu, Y. (2019). Mayer-type Optimal Control of Probabilistic Boolean Control Network with Uncertain Selection Probabilities[J]. IEEE Trans. Cybern. 51 (6), 3079–3092. doi:10.1109/TCYB.2019.2954849
Wang, C., Li, T., Peng, Q., Tu, Y., Zou, L., and Zhang, S. (2014). “Study of Composite Insulator Leakage Current Characteristics in Contamination and Humidity Conditions,” in 2014 IEEE Conference on Electrical Insulation and Dielectric Phenomena (CEIDP), 353–356. doi:10.1109/CEIDP.2014.6995783
Wang, H., and Nie, J. (2016). Time-frequency Characteristics Analysis of Fouling Discharge Sound Signals of High-Voltage Insulators[J]. Electroceramic Light. arrester (02), 12–17. doi:10.16188/j.isa.1003-8337.2016.02.003
Wang, Y., Shi, W., Xing-bo, H., Jiang, X., Zhang, C., and Zhang, Z. (2021). Fouling Flash Prediction Model for Glass Insulators Based on Acoustic Emission Characteristics[J]. Power Constr. 42 (05), 138–144. doi:10.12204/j.issn.1000‐7229.2021.05.015
Wu, Y., Guo, Y., and Toyoda, M. (2020). Policy Iteration Approach to the Infinite Horizon Average Optimal Control of Probabilistic Boolean Networks. IEEE Trans. Neural Netw. Learn Syst. PP (7), 2910–2924. doi:10.1109/TNNLS.2020.3008960
Yang, N. (2021). “A Comprehensive Review of Security-Constrained Unit Commitment,” in Journal of Modern Power Systems and Clean Energy, 1–14. doi:10.35833/MPCE.2021.000255
Yang, N., Qin, T., Wu, L., Huang, Y., Huang, Y., Xing, C., et al. (2022). A Multi-Agent Game Based Joint Planning Approach for Electricity-Gas Integrated Energy Systems Considering Wind Power Uncertainty. Electr. Power Syst. Res. 204, 107673. ISSN 0378-7796. doi:10.1016/j.epsr.2021.107673
Yang, N., Yang, C., Wu, L., Shen, X., Jia, J., Li, Z., et al. (2022). Intelligent Data-Driven Decision-Making Method for Dynamic Multisequence: An E-Seq2Seq-Based SCUC Expert System. IEEE Trans. Ind. Inf. 18, 3126–3137. doi:10.1109/TII.2021.3107406
Yang, N., Yang, C., Xing, C., Ye, D., and Jia, J. (2021). Deep Learning-Based SCUC Decision-Making: An Intelligent Data-Driven Approach with Self-Learning Capabilities. IET Gener. Transm. Distrib., 1–12. doi:10.1049/gtd2.12315
Ye, J., Zhao, D., and Zhang, L. (2021). Research on Combined Electricity and Heating System Scheduling Method Considering Multi-Source Ring Heating Network[J]. Front. Energy Res., 826. doi:10.3389/fenrg.2021.800906
Zhang, L., Cheng, L., and Alsokhiry, F. (2022). A Novel Stochastic Blockchain-Based Energy Management in Smart Cities Using V2S and V2G[J]. IEEE Trans. intelligent Transp. Syst., 1–8. doi:10.1109/tits.2022.3143146
Zhang, L., Xie, Y., Ye, J., Xue, T., Cheng, J., Li, Z., et al. (2021). Intelligent Frequency Control Strategy Based on Reinforcement Learning of Multi-Objective Collaborative Reward Function. Front. Energy Res. 9, 587. doi:10.3389/fenrg.2021.760525
Zhang, W., Yan, W., Yuan-yuan, L., Jiang, J., Zhang, K., and Zhang, Y. (2021). Intrusion Detection Algorithm Based on CA-ResNet Network and NADAM Optimization [J]. J. Chongqing Normal Univ. Nat. Sci. Ed. 38 (04), 97–106. doi:10.11721/cqnuj20210418
Zhao, Z., Fan, X., Qi, Y., and Zhai, Y. (2017). “Multi-angle Insulator Recognition Method in Infrared Image Based on Parallel Deep Convolutional Neural Networks,” in Computer Vision. Editors J. Yang, Q. Hu, M.-M. Cheng, L. Wang, Q. Liu, and X. Baiet al. (Singapore: Springer Singapore), 303–314. doi:10.1007/978-981-10-7305-2_27
Keywords: discharge of polluted insulator, convolutional neural network, acoustic emission signal, fault diagnosis, deep learning
Citation: Hao L, Zhenhua L, Ziyi C, Xingxin C and Xu Y (2022) Insulator Fouling Monitoring Based on Acoustic Signal and One-Dimensional Convolutional Neural Network. Front. Energy Res. 10:906107. doi: 10.3389/fenrg.2022.906107
Received: 28 March 2022; Accepted: 12 April 2022;
Published: 23 May 2022.
Edited by:
Xun Shen, Tokyo Institute of Technology, JapanReviewed by:
Sandeep Kumar Duran, Lovely Professional University, IndiaGaurav Sachdeva, DAV University, India
Copyright © 2022 Hao, Zhenhua, Ziyi, Xingxin and Xu. This is an open-access article distributed under the terms of the Creative Commons Attribution License (CC BY). The use, distribution or reproduction in other forums is permitted, provided the original author(s) and the copyright owner(s) are credited and that the original publication in this journal is cited, in accordance with accepted academic practice. No use, distribution or reproduction is permitted which does not comply with these terms.
*Correspondence: Li Zhenhua, lizhenhua1993@163.com