 Pengfei Chen
 Honggang Chang
94% of researchers rate our articles as excellent or good
Learn more about the work of our research integrity team to safeguard the quality of each article we publish.
Find out more
ORIGINAL RESEARCH article
Front. Energy Res., 24 May 2022
Sec. Advanced Clean Fuel Technologies
Volume 10 - 2022 | https://doi.org/10.3389/fenrg.2022.905187
This article is part of the Research TopicThe Challenge and Opportunity of CCUS in the Development of Unconventional ResourceView all 15 articles
Drag reduction (DR) is critical to the success of hydraulic fracturing operations with slickwater, and it is a challenge to accurately predict DR due to the problem of high injection rates. Although a practical pipe diameter model is frequently used to predict the field DR based on laboratory experimental data, there exist many limitations. This study, on account of dynamic similarity, shows two novel general models for the prediction of field DR, and such two models can give reliable predictions when the laboratory and field Reynolds numbers (Re) are the same. For general model 1, the DR can be predicted by using the laboratory volumetric flow rate, pipe diameter and pressure drop, and the field volumetric flow rate, with a deviation ranging from −10 to 10%. For general model 2, it is simpler than general model 1, and the DR can be predicted by using the laboratory pipe diameter and the field volumetric flow rate, with a deviation ranging from −6 to 6%. The two novel general models can be used for more scenarios than the existing reported ones.
As a widely distributed clean and efficient energy source, shale gas has been highly valued by the international energy market and various countries (Peng et al., 2019a). Since the early 21st century, the boom in shale gas development in the United States has significantly advanced the global shale gas development. Since then, the energy landscape in the world has changed gradually (Yuan et al., 2015; Shi et al., 2020). As far as we know, China has abundant shale gas resources and an increasing demand for natural gas. Therefore, a large-scale commercialized development (Ma et al., 2018; Pang, 2018) of hydraulic fracturing shale reservoirs can be expected. Hydraulic fracturing is a necessary technology for developing shale gas (Yu et al., 2020). During the hydraulic fracturing process, the proppant-carrying fracturing fluid is injected into a well at a high pressure and rate to fracture the reservoir rocks. To reduce the friction loss due to tubular roughness, slickwater with drag reducers is often used since it has desirable hydraulic features (Barbot et al., 2013; Shaffer et al., 2013; Al-Muntasheri, 2014; Engle and Rowan, 2014). Numerous studies have focused on various parameters affecting drag reduction (Gallego and Shah, 2009; Chai et al., 2019). Four main parameters can affect the drag reduction of slickwater, including the drag-reducing agent concentration, fluid flow Reynolds number (Re), relative pipe roughness, and water quality (Yang et al., 2019). Meanwhile, two main underlying mechanisms of drag reduction have been identified (Habibpour and Clark, 2017; Habibpour et al., 2017). The first mechanism introduced by Lumley is based on the elongation of coiled polymer molecules, hence increasing the thickness of the viscous sublayer; the other mechanism is the elastic properties of polymers.
Although we have known a lot of the slickwater parameters affecting drag reduction, accurate prediction of drag reduction still remains a challenge. Allahdadi Mehrabadi and Sadeghy (2008) obtained a good drag reduction prediction model called the κ-ε turbulence model for low Reynolds numbers. Al-Sarkhi et al. (2011) developed two correlations to predict the effect of drag-reducing polymers on the friction factor of the two-phase flow for any pipe diameter. Karami and Mowla (2013) presented a general model for predicting drag reduction in crude oil pipelines. Recently, Zhou et al. (2011) proposed a practical pipe diameter model by introducing an effective pipe radius (reff) which is defined as follows:
where ρ is the fluid density, μ is the fluid viscosity, and vf is the flow velocity calculated as (dΔp/4ρl)1/2. To upscale the laboratory experimental results of the drag reduction of slickwater to the field application, two conditions must be met: first, the reff value of the field pipe (tubing/casing) must be in the same range as the laboratory pipe; second, the slope of reff versus v of the field must match the laboratory setup, where v is the average fluid velocity. We found that as long as the slopes of effective pipe radius versus velocity from the laboratory pipe and the field pipe are numerically close, field drag reduction can be predicted by a modified correlation between DR and velocity established in the laboratory (Zhao et al., 2018; Chen et al., 2021). In this study, two novel general models are proposed using the Reynolds criterion to simplify the prediction condition.
The models presented in this study are based on the similarity principle so as to upscale the laboratory experimental results to the field application. Due to laboratory setting constraints that are different from those in the field application, the experimental results can be upscaled to the field application only under some specific conditions. The laboratory measurements can accurately represent the flow dynamics of the corresponding prototype. Therefore, the similarity between the model and the prototype must be satisfied. There are three types of similarity principles: geometric similarity, kinematic similarity, and dynamic similarity. It is relatively easy to achieve the geometric and kinematic similarities, while the dynamic similarity requires an equal ratio of forces acting on the two systems. Usually, dynamic similarity can be achieved by equating such flow dynamic dimensionless variables as Froude number and Reynolds number. In this study, we chose the Reynolds number as the inherent parameter because it can be easily measured in both the laboratory condition and the field application condition. Reynolds number (Re) is a dimensionless number that is commonly used to characterize flow patterns in different fluid flow situations (Peng et al., 2019b). Because of the similarity of flow viscosity between the prototype and the model, the Reynolds number of the field fracturing flow model should be equal to that of the lab drag reduction experiment model, according to the similarity of flow dynamics.
In previous studies, we have developed a modified Virk’s correlation to accurately characterize the friction factor (λ) under different Reynolds numbers in the turbulent flow pattern for the polyacrylamide polymer drag-reducing agent using laboratory data. The unified model is shown in Eq. 1.
This equation can be changed to Eq. 2.
where Relab is the Reynolds number based on the laboratory data, Dlab is the lab pipe diameter, and λlab is the friction factor from the laboratory data. For a given pipe diameter in the field, a similar relationship between the field Re (Refie) and the field λ (λfie) can be obtained by Eq. 3.
The Reynolds numbers of the lab and field can be equated by Eq. 4:
For a slickwater solution, the λlab and λfie can be determined by the Hagen–Poiseuille equation, respectively, as follows:
where ∆Plab is the pressure drop in the laboratory experiment, ρ is the density of slickwater, Llab is the pipe length in the laboratory experiment, Qlab is the volumetric flow rate in the laboratory experiment, ∆Psie is the field friction of slickwater, Lfie is the well depth, and Qfie is the field volumetric flow rate.
Eq. 5 and 6 are substituted into Eq. 4 to get the predicted ∆Pfie by Eq. 7:
For the given Lfie, Qfie, and Dfie, ∆Pfie can be calculated according to the process shown in Figure 1.
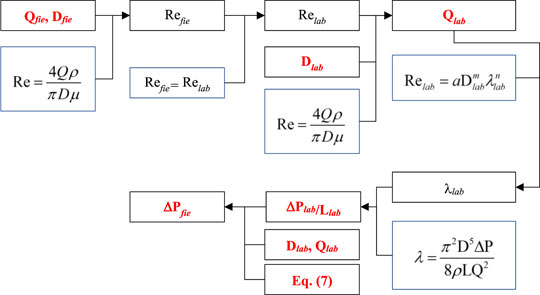
FIGURE 1. Calculation process of ∆Pfie prediction according to Eq. 7.
The field friction of pure water (∆Ppw) can be calculated by Eq. 8, which is obtained by the friction-gradient flow rate diagram of water, as shown in Supplementary Figure S1 in Supporting Information.
The drag reduction (DR) is defined as follows:
Eq. 7 and 8 are substituted into Eq. 9 to get the DR:
The drag-reducing agent, having an average molecular weight of 1.05×10⁷ and a hydrolysis degree of 21.5%, was provided by Chengdu Ringt Technology Development Co., Ltd. In the laboratory experiment, an aqueous solution of 0.1 wt% drag-reducing agent and deionized water as the solvent were used. The experimental setup used to study the drag reduction performance is shown in Supplementary Figure S2 in Supporting Information. The laboratory flow loop was composed of a mixing tank (20 L), a cavity progressive pump (XBY, model: G FG 25-2, range: 0–2 m3h−1), a steel pipe (relative roughness: 3.2), a heater, and a flow meter (SINCERITY, model: DMF-1-M, range: 0–35 kg min−1, accuracy: 0.10–0.20% relative error of the flow meter). It also had two pressure sensors (Sailsors Instruments Ltd., model: V4Db7E, range: -700 to 700 kPa, output: 4–20 mA DC, accuracy: ±0.5% full scale).
The drag reduction experiments in the laboratory were conducted, following the procedures detailed in the literature (Zhao et al., 2018).
1) Drag-reducing agent and experimental equipment
The drag-reducing agent used in the experiment was the high molecular weight polyacrylamide emulsion prepared by inverse emulsion polymerization. It was a linear polymer with a molecular weight of 1.05×10⁷ and a concentration of 31.2 wt%. The dosage of the linear polymer was 0.1wt%. All experiments were carried out at room temperature. The loop included a 50-L container, and it can circulate at different rates up to 50 L/min under the action of the pump. First, the liquid flowed from the mixing tank through the flow meter having a maximum capacity of 10 t/h and an accuracy of ±0.1%. Then, the liquid flowed through the pipeline, and the pressure was measured by using the pressure sensors with a range of 0–14 MPa. A 30-m long pipe with a diameter of 0.08 m was used in the system. A 50-L container was used to prepare the drag-reducing agent solution, and the solution can be recycled. Then, experiments were conducted at different flow rates.
2) Experimental procedures
1) The water was added to a mixing tank and allowed to circulate for 5 min, followed by filling the pipeline with water and checking the flow meter and pressure sensor to ensure proper and stable range.
2) The water was circulated for 5 min, and the pressure difference (Δ P0) per second and the flow rate were recorded.
3) A drag-reducing agent was added to the water and allowed to circulate for 5 min, followed by recording the pressure difference (Δ P1) per second and the flow rate.
4) The system was cleaned with water.
5) The drag reduction was calculated.
6) The drag reduction performance was evaluated by Reynolds number, shear rate, friction coefficient, and average velocity.
Figure 2 shows the changes of Relab with λlab of slickwater in pipes with a diameter of 7.8 and 10.15 mm, respectively. We applied numerical regression to the experimental data and obtained the correlation Eq. 11 with coefficients of a = 0.0011, m = 1.76, and n = −2.8.
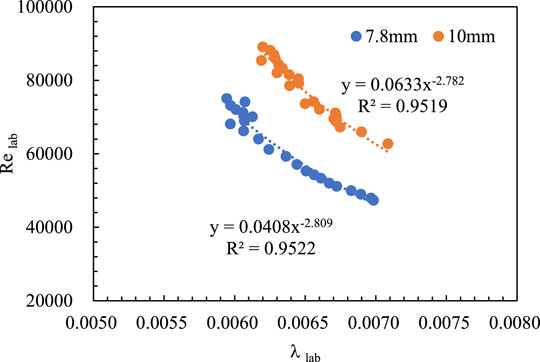
FIGURE 2. Changes in Relab with λlab of slickwater in pipes with a diameter of 7.8 and 10.15 mm, respectively.
Figure 3 shows the changes of Refie with λfie of slickwater in the pipe with a diameter of 114.3 mm. For this pipe, the correlation was obtained by Eq. 12.
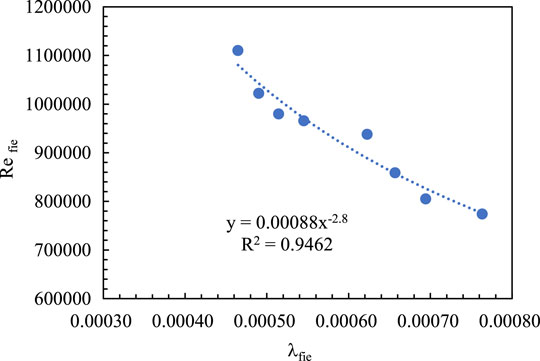
FIGURE 3. Changes in Refie with λfie of slickwater.
Eq. 11 and 12 should be substituted into Eq. 7 and 10 to obtain the predicted ∆Pfie and drag reduction (by general model 1), respectively, by Eq. 13 and 14:
For the pipe with a diameter of 114.3 mm, the field data, predicted ∆Pfie, and predicted DR are listed in Table 1. Since ∆Pfie predicted using Dlab of 10 mm was higher than that of Dlab of 7.8 mm, the DR predicted using Dlab of 10 mm was lower than that of Dlab of 7.8 mm. Figure 4 shows the DR prediction deviations. In general, the prediction deviation produced by using Dlab of 7.8 mm was lower than that of Dlab of 10 mm, and the deviation was -10–10%.
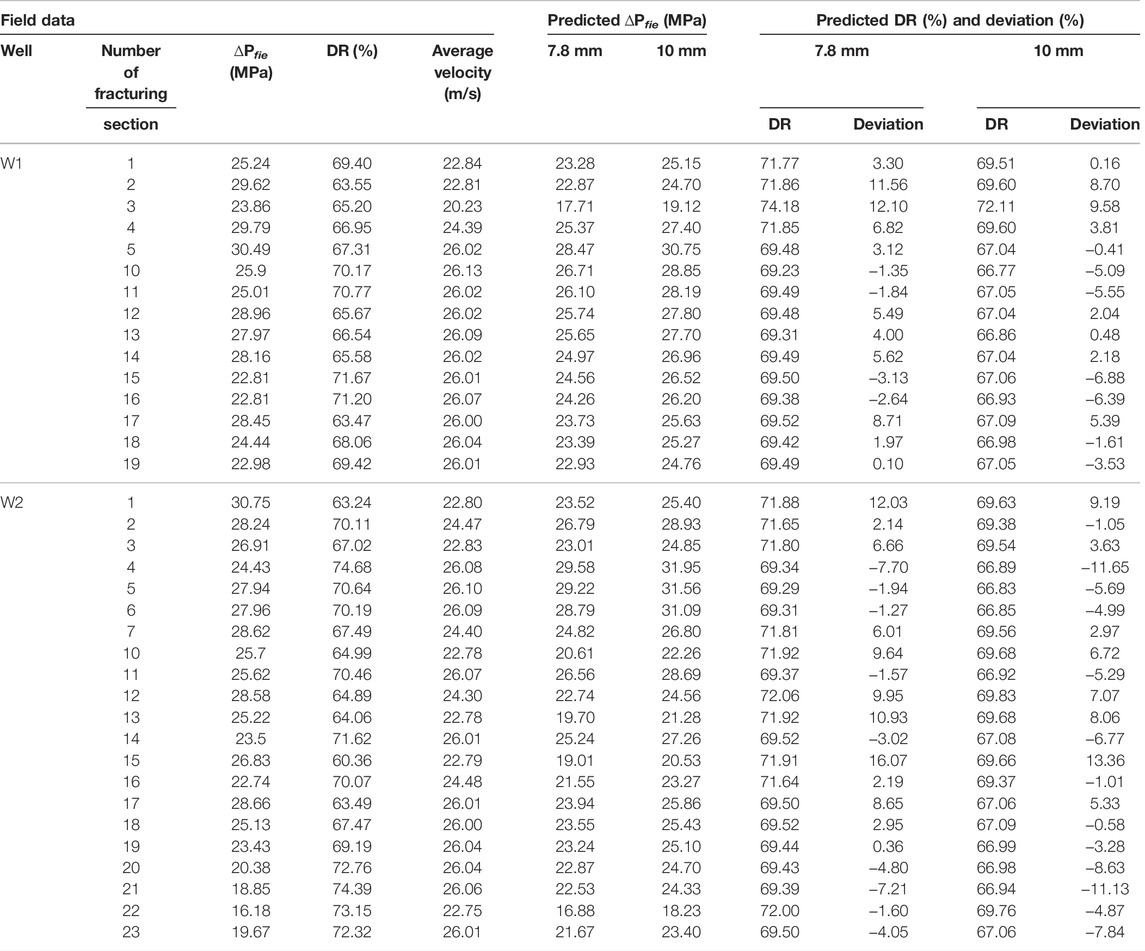
TABLE 1. Predicted DRs and deviations obtained by using general model 1.
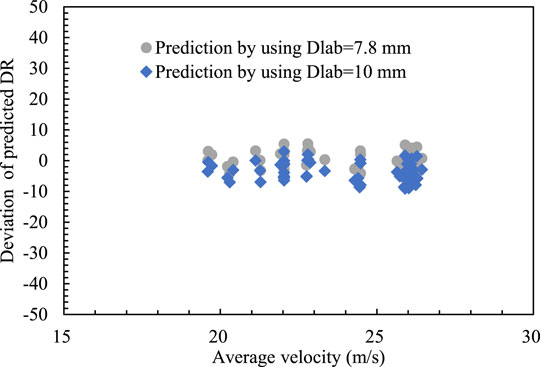
FIGURE 4. DR prediction deviations at different Dlab.
As shown in Figure 1 and Eq. 10, the DR prediction using general model 1 is very complicated. Many parameters in the model cannot be measured directly. Therefore, general model 1 should be further simplified. When Lfie and Dfie are known, ∆Pfie is a function of Relab, Dlab, and Vfie, as shown in Eq. 7. Therefore, Eq. 10 can be changed to Eq. 15as follows:
Relab is also a parameter that cannot be measured directly. Our laboratory experimental results showed that there was a linear relationship between ∆Plab/Vlab and Relab (Figure 5) within our experiment range. In addition, we also found that there was a linear relationship between ∆Plab/Vlab and ∆Plab (see Figure 6). As shown in Figure 5 and Figure 6, Relab and ∆Plab also have a linear relationship. In other words, d (ΔPlab/V)/d (ΔPlab) and Relab have multiple relationships. As a result, Eq. 15 can be converted to Eq. 16as follows:

FIGURE 5. Relationship between ∆Plab/Vlab and Relab.

FIGURE 6. Relationship between ∆Plab/Vlab and ∆Plab.
When Vfie is changed from 1.63 m/s to 32.5 m/s, the DR was calculated for different pipe diameters by adjusting the parameters in Eq. 16. The data used for parameter determination are shown in Table 2. Using numerical regression, we obtained general model 2, as shown in Eq. 17.
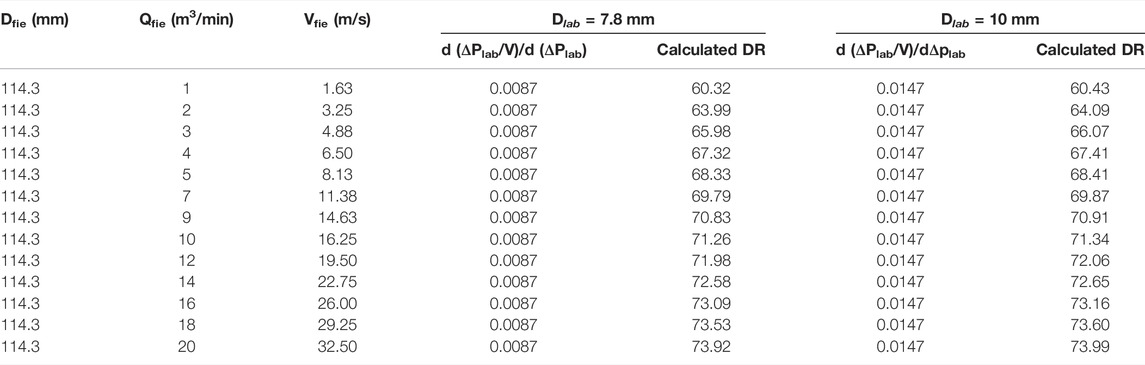
TABLE 2. Data used for parameter determination.
When the pipe diameter was 114.3 mm, the field data and the predicted ∆Pfie and DR were obtained using general model 2. Figure 7 shows the DR prediction with a deviation ranging from -6 to 6%.
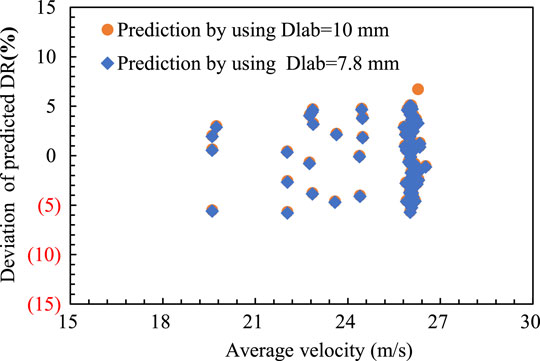
FIGURE 7. DR prediction deviations at different velocities.
This study presents models from regression and upscaling laboratory data to predict the field performance of slickwater. The potential deviation from the developed model comes from three different sources: 1) uncertainties of the laboratory measurements and their propagation to the regression correlation. To overcome the system deviation of measurement, multiple measurements on rates, diameters, and pressures were conducted, and the averaged values were used in the laboratory experimental results; 2) numerical regression on a laboratory experiment. To obtain the quantitative relationships between measured quantities and overcome the potential deviations, we applied weighted least squares with data uncertainties determined from experiments; 3) propagation of deviation during upscaling laboratory data to field applications. In this upscaling, we did not consider the potential impact of other differences such as different water quality and changes in fluid flow dynamics or thermodynamic properties, and all of them can contribute to the increased inaccuracy in the upscaling process.
Additionally, Eq. 16 shows that the friction resistance value predicted for the field is related to the linear relationship between the ratio of pressure difference to linear velocity and the differential pressure measured in the laboratory experiment, hydrodynamic radius, and linear velocity designed in the field. The calibration of the hydrodynamic radius is based on the water experiment, and the friction coefficient of water conforms to the Prandtl–Karman law in the hydraulic smooth area, which requires the accurate measurement of the stable pressure difference at different linear velocities under laboratory experimental conditions. Similarly, to establish an accurate linear relationship between the ratio of pressure difference to linear velocity and differential pressure, it is necessary to measure the stable pressure difference of the drag-reducing agent at different linear velocities. Therefore, the most important factor for accurate prediction of field friction is to obtain the stable pressure difference between water and drag-reducing agent solution at different linear velocities under laboratory experimental conditions.
Two novel general models are established to predict the field drag reduction using laboratory experimental data based on the dynamic similarity theory. When the laboratory and field Reynolds numbers are the same and the laboratory and field volumetric flow rates and pipe diameters are known, general model 1 can be used. When the field volumetric flow rates and the laboratory pipe diameter are known, general model 2 can be used. The two proposed mathematical models for field drag reduction prediction are validated by 42 data points. The validation results showed that both models can give high-accuracy predictions, with a deviation ranging from −10 to 10% using general model 1 and a deviation ranging from −6 to 6% using general model 2.
The original contributions presented in the study are included in the article/Supplementary Material; further inquiries can be directed to the corresponding author.
All authors listed have made a substantial, direct, and intellectual contribution to the work and approved it for publication.
This research was partially funded by one of the National Key Technology R&D Programs—Research and Application of Generic Technologies for National Quality Infrastructure (2018YFF0213800), specifically research on key technical standards of coalbed methane, shale gas and modern coal chemical industry and that on key technical standards of shale gas resource exploration, geological evaluation and development process.
Authors PC, HC, YF, YT, XH and WY were employed by PetroChina Southwest Oil and Gas Field Company.
All claims expressed in this article are solely those of the authors and do not necessarily represent those of their affiliated organizations, or those of the publisher, the editors, and the reviewers. Any product that may be evaluated in this article, or claim that may be made by its manufacturer, is not guaranteed or endorsed by the publisher.
Al-Muntasheri, G. (2014). A Critical Review of Hydraulic-Fracturing Fluids for Moderateto Ultralow-Permeability Formations over the Last Decade. SPE Prod. Operations 29, 1–18. doi:10.2118/169552-pa
Al-Sarkhi, A., Nakla, M. E., and Ahmed, W. H. (2011). Friction Factor Correlations for Gas-Liquid/liquid-Liquid Flows with Drag-Reducing Polymers in Horizontal Pipes. Int. J. Multiph. Flow 37 (5), 501–506. doi:10.1016/j.ijmultiphaseflow.2011.01.005
Allahdadi Mehrabadi, M., and Sadeghy, K. (2008). Simulating Drag Reduction Phenomenon in Turbulent Pipe Flows. Mech. Res. Commun. 35 (8), 609–613. doi:10.1016/j.mechrescom.2008.06.003
Barbot, E., Vidic, N. S., Gregory, K. B., and Vidic, R. D. (2013). Spatial and Temporal Correlation of Water Quality Parameters of Produced Waters from Devonian-Age Shale Following Hydraulic Fracturing. Environ. Sci. Technol. 47, 2562–2569. doi:10.1021/es304638h
Chai, Y., Li, X., Geng, J., Pan, J., Huang, Y., and Jing, D. (2019). Mechanistic Study of Drag Reduction in Turbulent Pipeline Flow over Anionic Polymer and Surfactant Mixtures. Colloid Polym. Sci. 297, 1025–1035. doi:10.1007/s00396-019-04525-2
Chen, P. F., Chang, H. G., Peng, T., Tang, Y. F., Liu, Y. Q., and Xiang, C. (2021). Synthesis and Performance Evaluation of a New Drag Reducer Based on Acrylamide/12-Allyloxydodecyl Acid Sodium. J. Appl. Polym. Sci. 138, e50314. doi:10.1002/app.50314
Engle, M. A., and Rowan, E. L. (2014). Geochemical Evolution of Produced Waters from Hydraulic Fracturing of the Marcellus Shale, Northern Appalachian Basin: a Multivariate Compositional Data Analysis Approach. Int. J. Coal Geol. 126, 45–56. doi:10.1016/j.coal.2013.11.010
Gallego, F., and Shah, S. N. (2009). Friction Pressure Correlations for Turbulent Flow of Drag Reducing Polymer Solutions in Straight and Coiled Tubing. J. Petroleum Sci. Eng. 65, 147–161. doi:10.1016/j.petrol.2008.12.013
Habibpour, M., and Clark, P. E. (2017). Drag Reduction Behavior of Hydrolyzed Polyacrylamide/xanthan Gum Mixed Polymer Solutions. Pet. Sci. 14, 412–423. doi:10.1007/s12182-017-0152-7
Habibpour, M., Koteeswaran, S., and Clark, P. E. (2017). Drag Reduction Behavior of Hydrolyzed Polyacrylamide/polysaccharide Mixed Polymer Solutions-Effect of Solution Salinity and Polymer Concentration. Rheol. Acta 56, 7–8. doi:10.1007/s00397-017-1024-1
Karami, H. R., and Mowla, D. (2013). A General Model for Predicting Drag Reduction in Crude Oil Pipelines. J. Petroleum Sci. Eng. 111 (21), 78–86. doi:10.1016/j.petrol.2013.08.041
Ma, Y. S., Cai, X. Y., and Zhao, P. R. (2018). China’s Shale Gas Exploration and Development: Understanding and Practice. Petroleum Explor. Dev. 45, 561–574. doi:10.1016/s1876-3804(18)30065-x
Pang, W. (2018). A Method for Determining the Contribution of Adsorption Gas to the Production of Shale Gas Wells. Pet. Drill. Technol. 46, 86–92.
Peng, Y., Zhao, J., Sepehrnoori, K., Li, Y., Yu, W., and Zeng, J. (2019). Study of the Heat Transfer in Wellbore during Acid/Hydraulic Fracturing Based on Semi-analytical Transient Model [J]. SPE J. 24 (2), 877–890. doi:10.2118/194206-pa
Peng, Y., Zhao, J., Sepehrnoori, K., Li, Z., and Xu, F. (2019). Study of Delayed Creep Fracture Initiation and Propagation Based on Semi-analytical Fractional Model. Appl. Math. Model. 72, 700–715. doi:10.1016/j.apm.2019.03.034
Shaffer, D. L., Arias Chavez, L. H., Ben-Sasson, M., Romero-Vargas Castrillón, S., Yip, N. Y., and Elimelech, M. (2013). Desalination and Reuse of High-Salinity Shale Gas Produced Water: Drivers, Technologies, and Future Directions. Environ. Sci. Technol. 47, 9569–9583. doi:10.1021/es401966e
Shi, W., Wang, X., Guo, M., Shi, Y., Feng, A., Liang, R., et al. (2020). Water Use for Shale Gas Development in China's Fuling Shale Gas Field. J. Clean. Prod. 256, 120680. doi:10.1016/j.jclepro.2020.120680
Yang, B., Zhao, J., Mao, J., Tan, H., Zhang, Y., and Song, Z. (2019). Review of Friction Reducers Used in Slickwater Fracturing Fluids for Shale Gas Reservoirs. J. Nat. Gas Sci. Eng. 62, 302–313. doi:10.1016/j.jngse.2018.12.016
Yu, P., Zhao, J., Sepehrnoori, K., and Li, Z. (2020). Fractional Model for Simulating the Viscoelastic Behavior of Artificial Fracture in Shale Gas[J]. Eng. Fract. Mech. 228, 106892. doi:10.1016/j.engfracmech.2020.106892
Yuan, J., Luo, D., and Feng, L. (2015). A Review of the Technical and Economic Evaluation Techniques for Shale Gas Development. Appl. Energy 148, 49–65. doi:10.1016/j.apenergy.2015.03.040
Zhao, J., Chen, P., Liu, Y., Zhao, W., and Mao, J. (2018). Prediction of Field Drag Reduction by a Modified Practical Pipe Diameter Model. Chem. Eng. Technol. 41, 1417–1424. doi:10.1002/ceat.201600570
Zhou, J., Sun, H., Stevens, R., Qu, Q., and Bai, B. (2011). “Bridging the Gap between Laboratory Characterization and Field Applications of Friction Reducers,” in SPE Production and Operations symposium. doi:10.2118/140942-ms
Λ: friction factor, dimensionless;
Re: Reynolds numbers, dimensionless;
Relab: recalculated by using laboratory data, dimensionless;
Dlab: pipe diameter in the laboratory experiment, mm;
Dfie: pipe diameter in the field application, mm;
λlab: λ calculated by using laboratory data, dimensionless;
∆Plab: pressure drop in the laboratory experiment, MPa;
ρ: density of slickwater, g/cm3;
Llab: pipe length in the laboratory experiment, mm;
Qlab: volumetric flow rate in the laboratory experiment, m3/min;
∆Pfie: field friction of slickwater, MPa;
Lfie: well depth, m;
Qfie: field volumetric flow rate, m3/min;
Vfie: linear velocity, m/s.
Keywords: drag reduction prediction, Reynolds criterion, slickwater fracturing, slickwater, general model
Citation: Chen P, Chang H, Fu Y, Tang Y, Huang X and Yu W (2022) Prediction of Drag Reduction in Slickwater Fracturing by Two General Models. Front. Energy Res. 10:905187. doi: 10.3389/fenrg.2022.905187
Received: 26 March 2022; Accepted: 19 April 2022;
Published: 24 May 2022.
Edited by:
Yu Peng, Southwest Petroleum University, ChinaReviewed by:
Guandong Su, National University of Singapore, SingaporeCopyright © 2022 Chen, Chang, Fu, Tang, Huang and Yu. This is an open-access article distributed under the terms of the Creative Commons Attribution License (CC BY). The use, distribution or reproduction in other forums is permitted, provided the original author(s) and the copyright owner(s) are credited and that the original publication in this journal is cited, in accordance with accepted academic practice. No use, distribution or reproduction is permitted which does not comply with these terms.
*Correspondence: Pengfei Chen, Y2hlbnBlbmdmZWlAcGV0cm9jaGluYS5jb20uY24=
Disclaimer: All claims expressed in this article are solely those of the authors and do not necessarily represent those of their affiliated organizations, or those of the publisher, the editors and the reviewers. Any product that may be evaluated in this article or claim that may be made by its manufacturer is not guaranteed or endorsed by the publisher.
Research integrity at Frontiers
Learn more about the work of our research integrity team to safeguard the quality of each article we publish.