 Zhang Shuyi1†
 Liu Pingkuo
95% of researchers rate our articles as excellent or good
Learn more about the work of our research integrity team to safeguard the quality of each article we publish.
Find out more
ORIGINAL RESEARCH article
Front. Energy Res. , 17 January 2023
Sec. Sustainable Energy Systems
Volume 10 - 2022 | https://doi.org/10.3389/fenrg.2022.904260
This article is part of the Research Topic Energy saving for sustainable cities View all 9 articles
Residential load is one of the important components of the seasonal peak load of the power grid, and it is increasing each year, with a huge demand response potential. With the development of the energy digital economy, the demand response of the new power system shows the characteristics of multi-stakeholder participation. The development mode based on the value co-creation has become a prominent support for market-oriented reform, and the need for the promotion of smart electricity use is increasingly prominent. In order to realize the in-depth exploration of residents’ demand response potential and the sustainable development of “value co-creation” of smart electricity consumption with the participation of multi-stakeholders, this study adopts both the social network analysis method and the counterfactual analysis approach to reveal the general characteristics of agents promoting the residents to participate in the value co-creation of smart electricity positively. The results show that 1) for social network, both the absolute resource advantage and the structural hole have obvious positive guidance on the agent; however, the incentive effect of the relative resource advantage is not significant; 2) for individual nodes , the role positioning of each agent has obvious guiding function for realizing the value co-creation; and 3) for interrelationship among main agents, the functional relationship has a significant degree of interdependence.
Power grid systems all over the world are confronted with challenges brought forward by a continued growth in demand, an increasing share of renewable energy sources and a pressure on power infrastructure construction. Moreover, the demand response of the new power system shows the characteristics of multi-stakeholder participation. Residents have technical support for participating in power grid peak shaving since the popularization of smart meters (Xu et al., 2018; Chakraborty et al., 2021) and smart homes (Wang et al., 2020; Alzahrani et al., 2021) and the application of home energy management systems (Zhang et al., 2021). However, the low participation rate of residents and unpredictable responses still bother the power system. In order to smooth the peak–valley difference of the power grid, energy is saved by improving the efficiency, the pressure of distribution network investment is alleviated, and the development requirements of the energy digital economy era is conformed; the State Grid Corporation of China is focusing on building its own smart power platform and launching smart power services, hoping to guide residents to actively participate in smart power consumption, and thus value co-creation behavior is formed (Nadeem et al., 2021; Nuria, 2021).
Many literature studies have conducted research on the incentive measures and behavioral motivation to guide residents’ demand response (DR) behaviors from different perspectives. DR is divided into price-based DR and incentive-based DR according to different user responses. In terms of price-based DR, Blaschke (2022) motivates households to adjust load patterns from the perspective of increasing energy tax; Rasheed and R-Moreno (2022) give personalized electricity price signals according to individual load demands to achieve precise incentives for loads effect, but the feasibility in practical application is not strong. In terms of incentive-based DR, Christoforos et al. (2022) evaluated different POS methods in different residential energy scheduling and controls, and it is valuable to dispatch and control distributed energy resources in practical applications. For the research on the motivation of residents to participate in DR, Nikolas et al. (2022) analyzed the interest of different groups of people in the DR scheme from the aspects of population and remuneration commodity preferences. Li et al. (2022) divided users into four categories according to their economic preferences and comfort and solved the problem of low motivation of movable loads, but the scope of influencing factors considered in these literature studies is too broad and does not have the pertinence of smart electricity consumption.
Moreover, it is worth noting that there are currently no studies that simultaneously study residents’ electricity consumption behavior, incentive measures, and reasons for the success of the measures. There are no articles that focus on the “people” who are in close contact with residents and consider the positive influence and mechanism of action of other agents closely related to smart electricity consumption behaviors around them.
Therefore, the questions we urgently need to answer from the perspective of network and behavioral motivation are: which agents in the value co-creation network can inspire residents to participate in the generation of smart electricity consumption behavior? What characteristics do these agents have? How to generate effective incentives for users?
There are two theoretical approaches used in this article. The social network refers to the relatively stable relationship system formed by the interaction between individual members of society, and this social interaction will affect people’s social behavior (Liu, 2004; Zhai and Zhao, 2021; archer). Counterfactual analysis innovatively attempts to use reverse reasoning methods by constructing possibility hypotheses that are contrary to the original conclusions, and realizing the verification of the correctness of the original conclusions, thus making the research more convincing (Du et al., 2020).
Therefore, this article is based on existing research results, comprehensively using the social network analysis method and the counterfactual analysis approach. We will consider the smart electricity service of the State Grid Corporation of China as an example to analyze the value co-creation network and the connections between the agents participating in the value co-creation. We will explore the main characteristics of agents that positively promote residents to participate in smart electricity value co-creation, the reasons for user motivation, and the value co-creation mechanism (Dong and Chen, 2021; Akbar Bhatti et al., 2021) from the effective behavior of residents, participating in smart electricity value co-creation.
(1) In order to ensure the feasibility of the research and realize the analysis of the typical structure at the theoretical level, the independent individuals in the value co-creation of smart electricity are divided according to the criteria of showing the same social attributes and role positioning. In order to facilitate the subsequent analysis of the relationship between agents, the agents are further divided into three categories: State Grid Corporation of China, residents, and third-party departments. The breakdown of various agents, their corresponding market positioning, and interest appeals are shown in Table 1:
(2) To describe the smart electricity network, it is also necessary to clarify the relationship between various stakeholders (Li et al., 2013). The relationship between the agents can be determined according to the theoretical analysis of the value chain and combined with the application of smart electricity service.
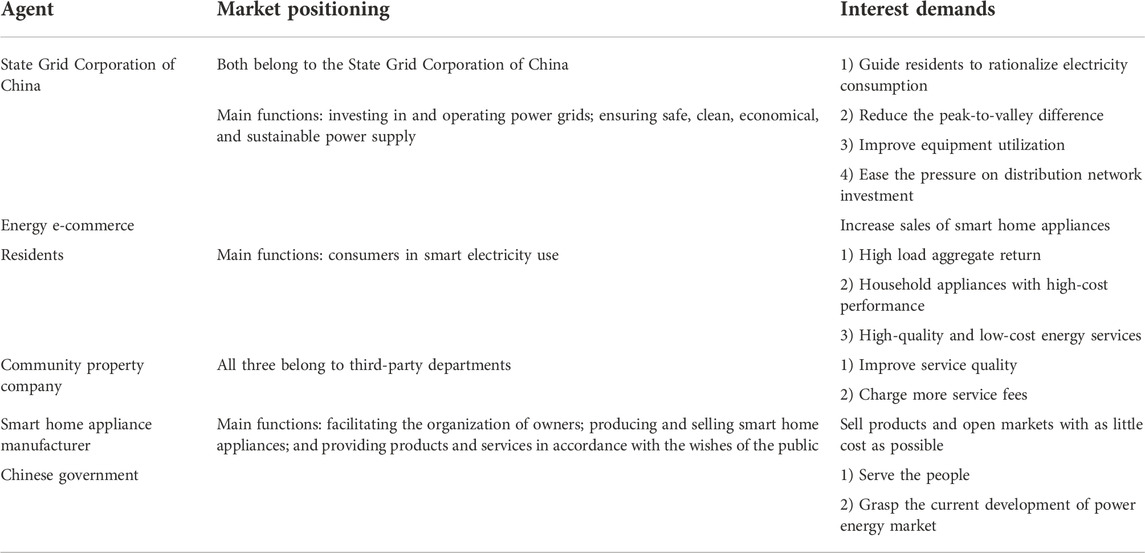
TABLE 1. Market position and interest demand of agent.
The theory of the value chain (Le et al., 2022) points out that the realization of value is ultimately determined by users. Therefore, the essence of the value chain is composed of a series of value-creating activities that can meet the needs of users. The activity of the smart electricity service carried out by the State Grid Corporation of China revolve around meeting the needs of residents, including product development, sales, and management, involving the flow of information, funds, services, and other resources among various agents. The schematic diagram is shown in Figure 1.
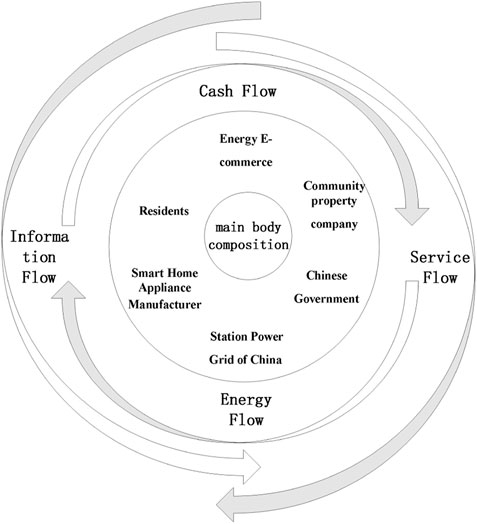
FIGURE 1. Inter-agent information, services, funds, and energy flow diagram.
The relationship between the various agents is established through the different needs generated in these processes. For example, the State Grid Corporation of China has the need to guide residents to use energy reasonably, relieve the pressure of power transmission and distribution on the distribution network, and the responsibility to ensure the safety of residents’ electricity consumption. Therefore, there has been a flow of information and service resources between the State Grid Corporation of China and the community properties that are closely related to the daily life of residents, as well as the Chinese government, which has a guiding role in the State Grid Corporation of China daily work. Therefore, the State Grid Corporation of China in turn forms a collaboration relationship with community properties, and a subordinate relationship with the Chinese government. The interrelationship table between agents is constructed based on this logic and is shown in Table 2:
(3) Social capital and value co-creation
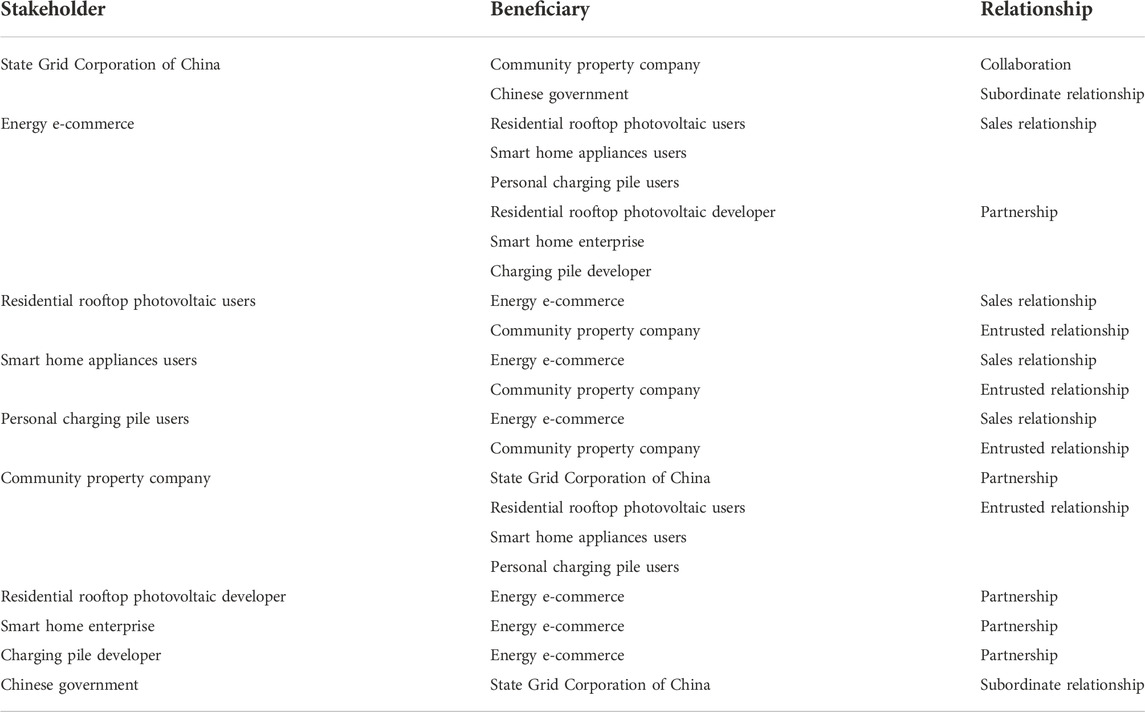
TABLE 2. Relationship between agents.
“Social capital” (Shin, 2021; Yoon and Kim, 2021) specifically refers to the smart electricity platform built by the State Grid Corporation of China, the electricity choice and consumption capacity of residents, and the products and services provided by third-party departments, etc. in the smart electricity value co-creation network.
The value co-creation of smart electricity consumption refers to the fact that the State Grid Corporation of China and third-party departments guide residents to actively participate in smart electricity consumption (Wu and Chen, 2012), so that the State Grid Corporation of China cuts peaks and fills valleys, residents achieve diversified electricity demand, and the third-party departments provide better services/sell products and other purposes.
In the value co-creation network, key nodes refer to the nodes that play a key role in guiding residents to participate in the promotion of smart electricity consumption. The following hypotheses are all proposed around the characteristics of the key nodes.
According to the resource dependence theory, the importance and scarcity of resources determine the degree of organization’s dependence on the environment (Fie, 2005; Song and Ji, 2018). Therefore, the advancement of value co-creation behavior comes from possessing the key resources needed by other agents. The following hypotheses are put forward:
H1. The key resources possessed by the agent can be used as social capital, which generates positive incentives for the ability to promote residents to participate in value co-creation.The more resources each agent participating in value co-creation occupies, the more likely it will have a greater influence and the stronger the ability to promote residents to participate in value co-creation behavior; conversely, the weaker the ability.
H2. The amount of resources occupied by the agent is positively correlated with the ability of residents to participate in value co-creation.Some agents in the value co-creation network have neither key resources nor richer resources but are in a key position in the network, which may play a positive role in promoting the participation of residents in value co-creation (Jiang et al., 2020).
H3. The agent at the key position node in the network has the advantage of structural holes, which has a positive incentive effect on the value co-creation behavior of residents.
According to China’s “National Economic Industry Classification and Code 2022” standard, as well as the role and main business of each company, the companies involved in the third-party sector are divided into two categories: manufacturing companies and service companies. According to the different types of enterprises, the key indicators of mastering resources are selected, and the enterprises with key resources are judged according to the weighted average score. The description of relevant indicators is shown in Tables 3, 4 (Guo, 2009; Song and Chuchun, 2011; Guo, 2018).

TABLE 3. Judgment standard of critical resources of manufacturing company.
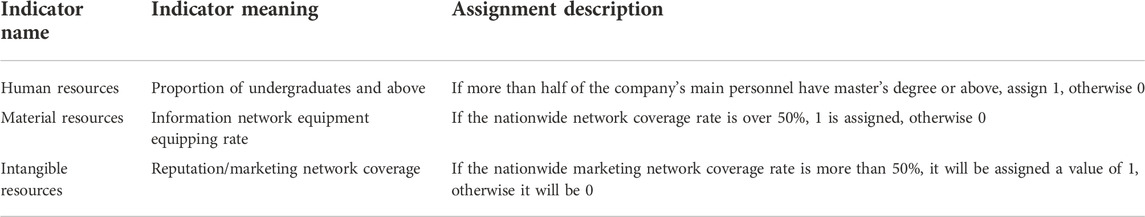
TABLE 4. Judgment standard of critical resources of service-oriented enterprise.
Depending on the importance of the data and striving for the reliability and accuracy of the data, brand operation, financial resources, and human resources are given weights of 0.4, 0.32, and 0.28, respectively; whereas human resources, material resources, and intangible resources are given weights of 0.45, 0.33, and 0.22, respectively.
The annual per capita consumption of residents in rooftop photovoltaics, smart home appliances, etc. is used as the definition of whether they occupy key resources.
where
It is assumed that the Chinese Government and the State Grid Corporation of China all occupy key resources. Since the Chinese Government is the policy maker and supervisory executor, the State Grid Corporation of China has transmission and distribution resources.
Based on the analysis of network characteristics such as the scope of the agent’s influence, the depth of the agent’s influence, the tightness of the connection between the agents and the network topology structure, the verification targets and judgment methods are clearly defined, and the characteristics of the smart electricity value co-creation network are realized, as shown in Figure 2.
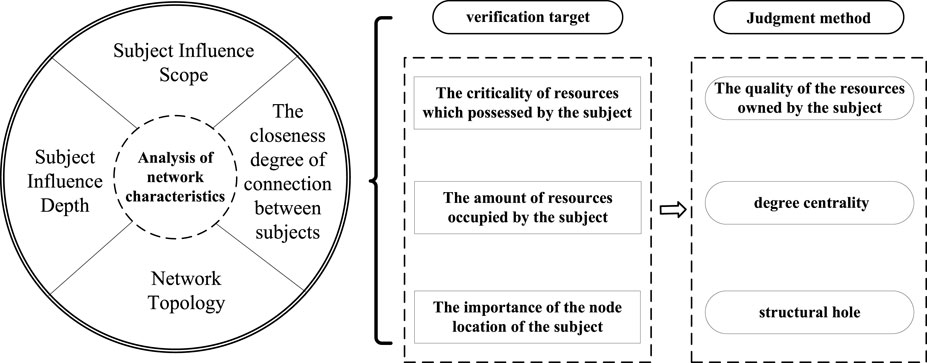
FIGURE 2. General thinking of the network characteristic analysis.
The size of the degree can be used to reflect the number of resources occupied by the node, and the absolute degree centrality is measured by the number of other nodes directly connected to the target node.
Betweenness centrality measures the degree to which the actor controls resources:
In the above formula,
Closeness centrality describes a measure of the degree of freedom from the control of others:
where
There are two types of count index for the calculation of structural holes. The first type is the structural hole index (including the four aspects of effsize, efficie, constra, and hierarc), and the second type is the betweenness centrality.
Effsize of actor i is equal to the individual network scale of i-redundancy of i. Redundancy refers to the average degree of other points in the individual network where point i is located.
The Efficie of actor i is equal to the effective scale of actor i/actual scale.
The Constra of the actor refers to the person’s ability to use structural holes in his own network:
In the above formula,
Hierarc reflects how restrictive is concentrated on one actor:
where N is the individual network scale of point i and C/N is the average value of the restriction degree of each point.
In order to strengthen the explanatory power, the logic of counterfactual analysis was used (Byrne, 2002; Roese neal, 1997) to analyze the network status before and after the deletion of key nodes that affect smart electricity consumption, so as to accurately determine the role and influence of related nodes on the overall network structure, that is, the typical logical form of “if–then” triggered by negative events is the premise (for example, if X does not occur) and the result (for example, if Y does not exist) is to verify the correctness of the hypothesis by negating the original conclusion.
Based on the aforementioned models and methods, we will consider the smart electricity service developed by the State Grid Corporation of China as an example to carry out a case analysis.
Smart home appliance manufacturers are manufacturing enterprises. East Group Co., Ltd., Midea Group Co., Ltd., and Xu Ji Electric Co., Ltd. are selected as representatives of residential rooftop photovoltaic developers, smart home enterprises, and charging pile developers, respectively. After comprehensively considering the factors, we can judge the key resources of these enterprises. The relevant data on corporate brand operation, financial capabilities, and human resources are all derived from the 2021 corporate annual reports of each company. The final scores are shown in Table 5.
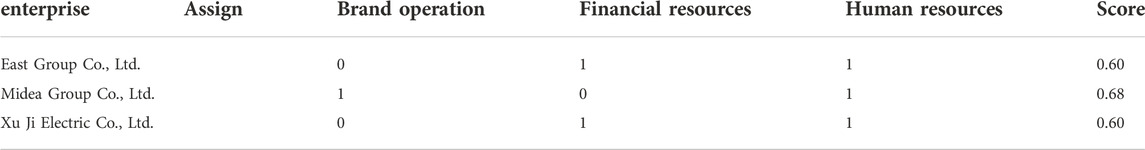
TABLE 5. Manufacturing company resource key score.
The community property company and energy e-commerce are service companies. According to the actual situation of the project and the acceptance of residents, Nanjing Huaqi Real Estate Co., Ltd. is selected as the representative of the community property company. The relevant data are all from the China’s National Enterprise Credit Information Publicity System, the 2021 corporate annual report, the corporate official website homepage, etc. The final scores are shown in Table 6.
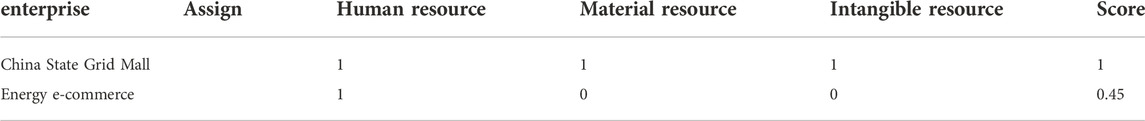
TABLE 6. Service-oriented enterprise resource key score.
We collect the consumption of residential rooftop photovoltaics, smart home appliances, and personal charging piles to calculate the proportion of consumption. The Chinese national per capita consumption expenditure data in 2020 comes from the Chinese National Bureau of Statistics and the smart home consumption expenditure data comes from the “2020 Sinking Market Smart Home Consumption Insights” report. The market share of rooftop photovoltaic products and personal charging piles is relatively low, based on the judgment from the search results and monthly sales of major e-commerce platforms. So, it is believed that the consumption expenditure of residents on these two products is 0. It can be seen that residential smart home appliances occupy key resources and the specific values are shown in Table 7.
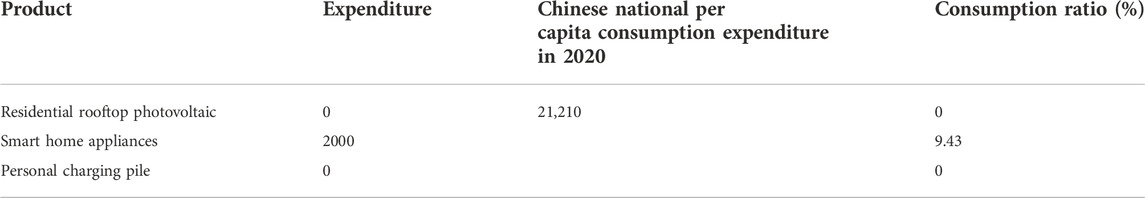
TABLE 7. Proportion of household consumption.
To sum up, the binary variable table for judging whether the relevant agents possess key resources is shown in Table 8 (the agent possessing key resources is 1, otherwise it is 0).
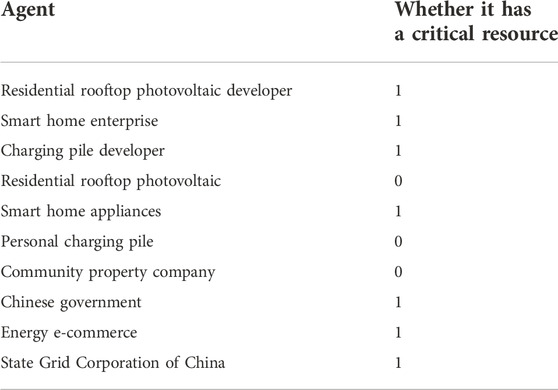
TABLE 8. Table of whether the main agent has mastered key resources.
If the co-creation of the value of smart electricity use is regarded as a social network structure, then the agents participating in the smart electricity use are nodes in the social network structure. We construct a relationship matrix according to the relationship characteristics between the two agents shown in Table 2; UCINET6.0 and Netdraw software are used to draw a smart electricity network structure diagram (Figure 3). The line in Figure 3 indicates that there is a relationship between the two agents, and “betweenness” is selected as an indicator of the size of each node. The letter description of each node is shown in Table 9. The matrix of relations between agents is given as follows:
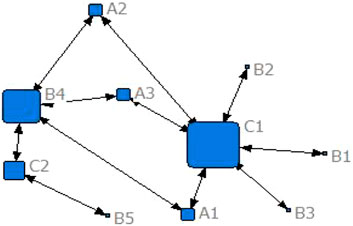
FIGURE 3. Network structure diagram. Legend: the larger the “node square,” the greater the betweenness degree.
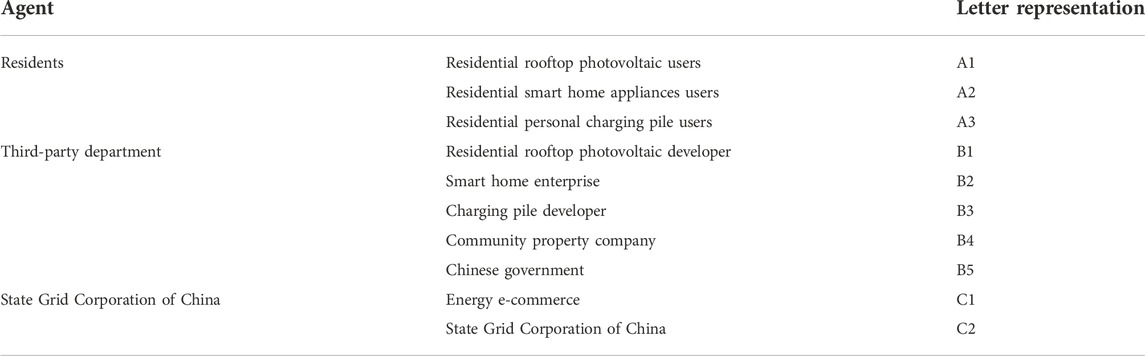
TABLE 9. Meaning of the representative letters of each node in the graph.
We calculate the structural hole index and centrality index of each node according to Eqs. 2–5 based on the constructed value co-creation network structure diagram. The centrality index of each node is shown in Table 10 using Ucinet6.0 software. In order to further determine the restriction source of a specific node, the restriction index between any two nodes is calculated using Eq. 5, as shown in Table 11.
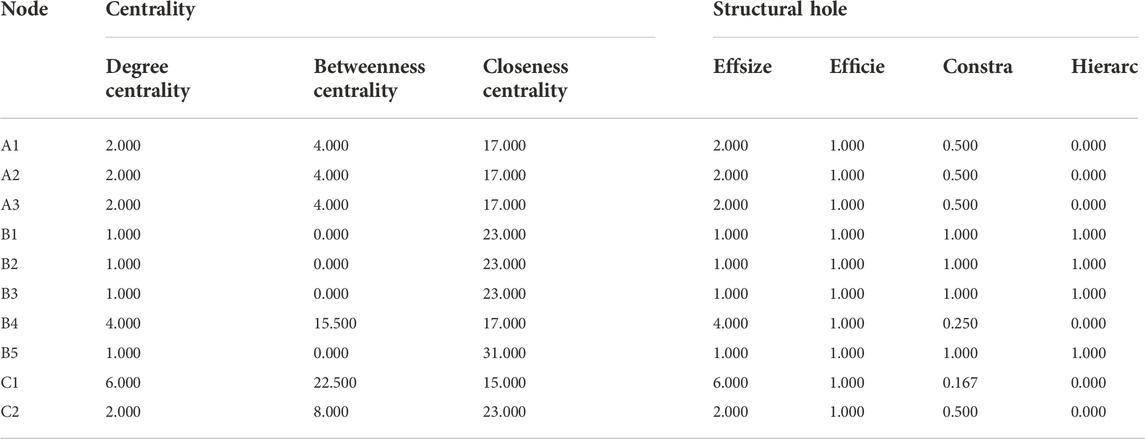
TABLE 10. Centrality table of each node.
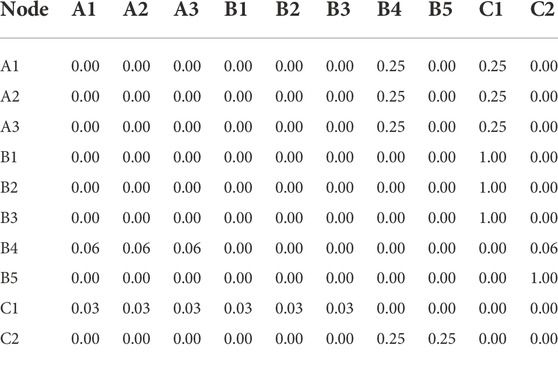
TABLE 11. Constraint between any two nodes.
Nodes C1 (energy e-commerce) and B4 (community property company) show strong centrality from the aforementioned research results.
From the perspective of degree centrality, nodes C1 and B4 have high degree centrality with values of 6.000 and 4.000, respectively. This indicates that C1 and B4 master more resources in the network and there are more agents directly connected to them. From the analysis of Table 10, we found that most of the nodes directly connected to B4 and C1 are nodes representing residents. This phenomenon shows that the participation of residents enables energy e-commerce and community property company to master relatively rich resources, and energy e-commerce and community property company are important agents to promote smart electricity value co-creation behavior of residents.
From the perspective of closeness centrality, C1 is the node with the lowest closeness centrality, with a value of 15.000. This indicates that the “distance” between the C1 and other nodes in the network is very short, the connection is relatively easy, and it can easily master relatively rich resources in promoting the smart electricity value co-creation. In addition, the C1 node has the lowest closeness centrality, while the betweenness centrality has the highest. It “self” monopolizes the relationship of the minority node to the majority node, and it is more likely to become the core node in the network.
Then, other nodes in the network analyzed, B1 (residential rooftop photovoltaic developers), B2 (smart home companies), B3 (charging pile developers), and B5 (Chinese Government), have the lowest degree centrality, all being equal to 1. It shows that these nodes have fewer social resources in the smart electricity consumption behavior, and the connection with residents may need to rely on other “third-party” nodes, such as energy e-commerce and community property company. At the same time, the closeness centrality of these nodes is relatively high and it is difficult to communicate with other nodes in the network, which verifies the correctness of the conclusions of the aforementioned analysis from the side.
Structural hole analysis is used to judge the criticality of node locations; nodes B4 and C1 show obvious advantages of structural holes and are in key positions in the network. According to the degree of constra in the structural hole indicators shown in Table 9, the constra degree of nodes B4 and C1 are 0.250 and 0.167, respectively, and the constra degree is relatively low. It shows that these two nodes are less restricted by other nodes in the smart electricity value co-creation, with stronger ability to control information flow.
At the same time, the constra degree of nodes A1, A2, and A3 representing residents in the network are all 0.5; their ability to use structural holes in the smart electricity value co-creation network is weak, and they are more likely to be “subjected to others.” Then analyzing its individual network, it can be found from Table 10 that the control of nodes A1, A2, and A3 all originate from nodes B4 and C1 and the control capabilities are the same.
Therefore, B4 and C1 are nodes at a key position, that is, the community property company and energy e-commerce represented by B4 and C1 are the agents in a key position for residents and their requirements have the greatest negotiability.
The results of structural hole analysis based on the betweenness centrality index are consistent, and so it will not be repeated here.
On the basis of knowing the corresponding agents of each node under the background of each hypothesis, the correctness of hypotheses H1, H2, and H3 is verified by the idea of counterfactual analysis.
First, we will verify hypothesis H1: the key resources mastered by the agent can be used as social capital to generate positive incentives for the ability of residents to participate in value co-creation.
The first step is to delete nodes that have key resources based on the results of the analysis and build a new social network.
The second step is to calculate the relevant indicators based on the new social network.
The third step is to analyze the difference of the indicators between before and after the node is being deleted and a conclusion is drawn.
After removing the key resource nodes, the new network has fewer nodes but it has not “collapsed” or isolated points have appeared, and the nodes can still maintain contact, as shown in Figure 4. The indicators of each node in Table 12 also show that B4 still exhibits the characteristics of good centrality while maintaining the advantage of the structural hole, which is consistent with the node characteristics of the original network. Therefore, the removal of key resource nodes does not affect the integrity of the smart electricity value co-creation network. The hypothesis of H1 is not valid and there are other nodes besides mastering key resource nodes that affect residents to participate in value co-creation.
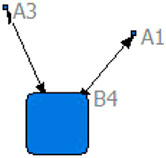
FIGURE 4. Network after removing the key resource nodes.
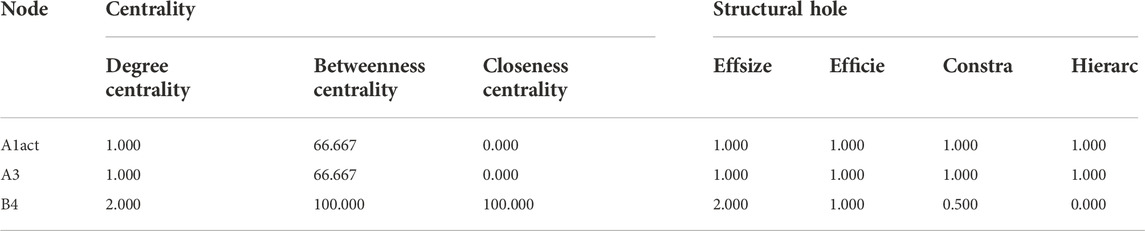
TABLE 12. Related indicators of the network after removing the key resource nodes.
Second, hypotheses H2 and H3 are verified; the verification steps of H2 and H3 are consistent with hypothesis H1. Since the judgment nodes of H2 and H3 are the same, only the two nodes B4 and C1 are counterfactually analyzed here. In order to ensure the accuracy of the judgment, the social network is constructed after removing the B4 and C1 nodes, respectively. If the entire network immediately “collapses,” it indicates that promoting residents to participate in value co-creation depends on these two key nodes. Otherwise, there are other factors that affect value co-creation.
The network structure diagram after removing the B4 node is shown in Figure 5. The C2 (State Grid Corporation of China) and B5 (Chinese Government) nodes are independent of the network due to the removal of the B4 node; the network is not continuous and the value co-creation activities cannot be carried out completely. Therefore, it can be explained that the B4 node plays a positive role in promoting the smart electricity value co-creation.
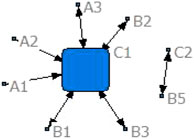
FIGURE 5. Network structure diagram after removing the B4 node.
The network structure diagram after removing the C1 node is shown in Figure 6. Isolated points B1 (residential rooftop photovoltaic developer), B2 (smart home enterprise), and B3 (charging pile developer) appear in the structure diagram, the network collapses, and value co-creation activities cannot continue, indicating that the C1 node also plays a positive role in promoting smart electricity value co-creation.
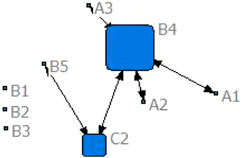
FIGURE 6. Network structure diagram after removing the C1 node.
In summary, hypotheses H2 and H3 are certified. This indicates that community property companies and energy e-commerce play an irreplaceable role in promoting the participation of residents in value co-creation activities. No matter which one is missing from participating in value co-creation, it will not proceed smoothly.
In order to ensure the integrity of the analysis, next, we analyze how to generate positive incentives for residents from the perspective of behavioral motivation. For the generation of consumer behavior of residents, satisfying their needs is the premise, and what directly promotes the behavior is to satisfy their corresponding behavioral motivation.
The complete architecture of the 8-quadrant Censydiam consumption analysis model (as shown in Figure 7) realizes the research on user consumption needs. We combined the model architecture shown in Figure 8 to consider the reasons for the co-creation of smart electricity value; it can be found that community property companies meet the needs of residents to integrate/communicate with other agents in the network, and at the same time take the responsibility of providing residents with a comfortable/safe living environment and services; energy e-commerce can meet the needs of residents to explore new ways of using electricity and to show their individuality and uniqueness.
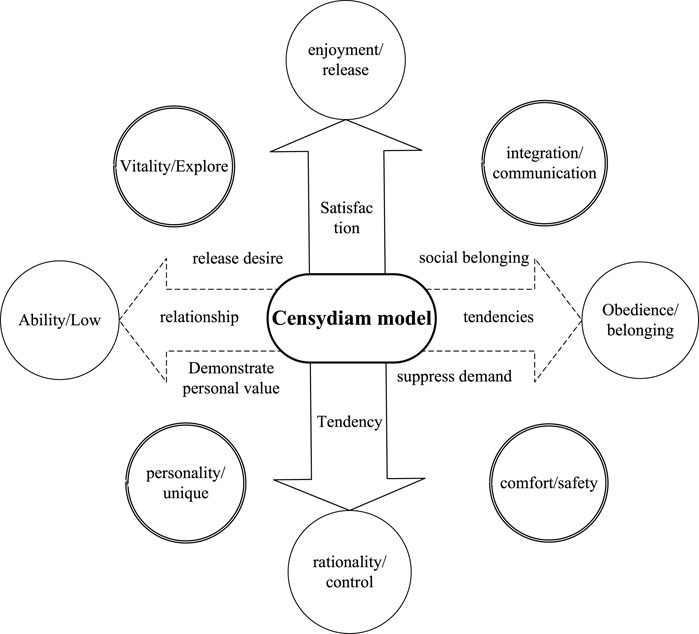
FIGURE 7. 8-Quadrant censydiam consumption analysis motivation model.
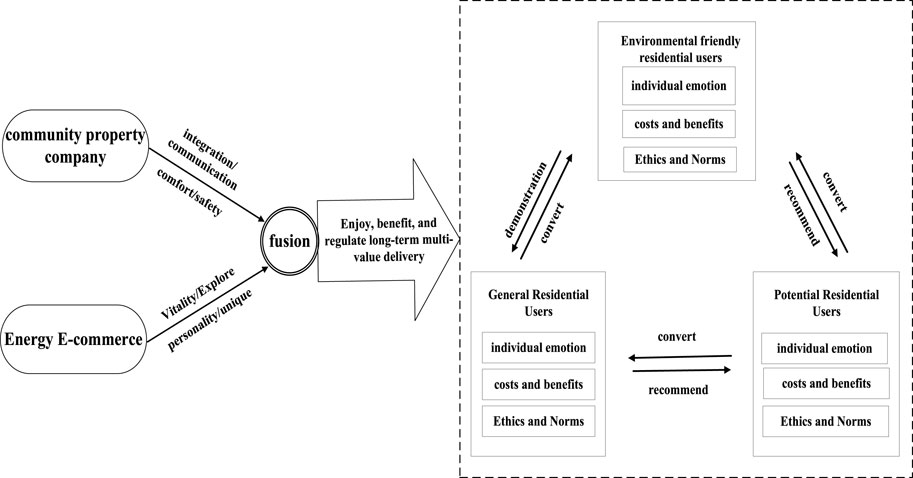
FIGURE 8. Residents’ participation in the smart electricity value co-creation path analysis diagram.
In addition, relevant scholars have clarified three types of behavioral motivations related to green consumption: individual emotion, cost and benefit balance, and ethics and norms. The essence of residential users’ participation in smart electricity consumption behavior is the embodiment of a green consumption behavior.
Therefore, combining the 8-quadrant Censydiam consumption analysis motivation model and the analysis of green consumption motivation, we can draw the realization path of community property companies and energy e-commerce to promote the value co-creation of smart electricity consumption, as shown in Figure 8. The specific performance and analysis of the long-term multi-value transfer between residents, community property companies, and energy e-commerce are as follows:
(1) Analysis based on individual emotions: community property companies have more contact with residents, and residents have no resistance to them; so they can satisfy the behavior motives of residents based on individual emotional considerations. In the benign interaction with energy e-commerce, residents will generate emotions and satisfy their motives based on individual emotional considerations.
(2) Analysis based on the trade-off between costs and benefits: community property companies can meet the requirements of residents’ behavioral motives because of the entrusted relationship with residents prompts them to always consider the interests of residents when making corresponding decisions. Energy e-commerce can meet the requirements of residents’ behavioral motives based on cost and benefit trade-offs because the smart power consumption services they launch can maximize the interests of residents.
(3) Analysis based on ethics and norms: community property companies can regulate the electricity consumption behavior of residents because of its unique close connection with residents, and the smart electricity consumption services of energy e-commerce are in line with the current social energy conservation and environmental protection requirements. So, both of them can meet the requirements of the corresponding behavioral motivation of residents.
This study takes the State Grid Corporation of China’s smart power platform as the analysis object to conduct empirical analysis and constructs a smart power value co-creation mechanism based on social network analysis and counterfactual analysis. The main conclusions are as follows:
(1) As for the overall social network, the agent’s absolute resource advantage and structural hole advantage have obvious positive guidance but the incentive effect of the relative resource advantage is not significant. The agents with a large number of resources and with a key network position have a positive effect on promoting the smooth progress of the “value co-creation” of smart electricity. On the contrary, the agent possessing the key resources has not realized the expectations in guiding the residents to participate in the value co-creation behavior.
(2) As for the individual nodes, the role positioning of each agent has obvious functional guiding characteristics for the realization of “value co-creation.” The unique ability of community property companies to aggregate information from scattered residents and the close relationship with residents are the necessary conditions for promoting residents to actively participate in smart electricity use. Energy e-commerce creates the possibility of communication between residents and electrical appliance manufacturers and improves the energy experience of residents. Therefore, the smooth progress of the “value co-creation” of smart electricity use requires focus on these two agents.
(3) As for the interrelationship between agents, the functional relationship of each agent has a significant degree of interdependence. Community property company and energy e-commerce are the agents to ensure that the smart power system can smoothly play its positive motivational role. The promotion effect of community property company on value co-creation is mainly reflected in the following aspects: facilitating the organization of residents, realizing the aggregation of resident terminal information, and providing channels for centralized feedback of users’ smart electricity requirements. Energy e-commerce has a significant role in strengthening the connection between residents and home appliance manufacturers. The effect of promoting value co-creation behavior is mainly reflected in aggregating information of various home appliance manufacturers and providing communication platforms to make the connection between home appliance manufacturers and residents more convenient.
This study realizes the exploration of the smart electricity consumption behavior of urban residents in the value co-creation activities of urban residents’ smart electricity consumption under the background of energy digital economy. This has certain practical significance and academic value for the State Grid Corporation of China to deeply tap the potential of residents’ demand response and realize the sustainable development of smart electricity consumption in the new power market with multi-subject participation. At the same time, it has certain reference significance for the promotion of other new businesses carried out by the State Grid Corporation of China or other similar enterprises.
However, this study still has certain limitations. As a single case study, although it is helpful to conduct more in-depth case research and analysis, the universality of the research is slightly insufficient, and the breadth of application of the case conclusions needs to be strengthened. The results of the case study in this study are still at the theoretical level, and the accuracy and validity of this study still need to be verified by practice.
Therefore, future research can rely on the actual practice effect of the project and market feedback to conduct further exploration. For example, one can choose a more appropriate/more detailed dimension to describe the relationship network between the agents, so as to realize the in-depth exploration of the smart electricity consumption behavior of urban residents. Future research can also solve the problem of how to maximize the value of each participant during the process of business development.
The original contributions presented in the study are included in the article/Supplementary Material; further inquiries can be directed to the corresponding author.
ZS: data collection, writing, and reviewing. LP: supervision, conceptualization, methodology, writing, and editing. ZC: investigation and reviewing. SQ: reviewing.
This study was supported by the National Natural Science Foundation of China (Grant No. 72103128).
Author ZC was employed by the company State Grid Energy Research Institute Co. Ltd.
The remaining authors declare that the research was conducted in the absence of any commercial or financial relationships that could be construed as a potential conflict of interest.
All claims expressed in this article are solely those of the authors and do not necessarily represent those of their affiliated organizations, or those of the publisher, the editors, and the reviewers. Any product that may be evaluated in this article, or claim that may be made by its manufacturer, is not guaranteed or endorsed by the publisher.
akbar bhatti, W., glowik, M., and Ahmad, A. (2021). Knowledge sharing motives and value co-creation behavior of the consumers in physiotherapy services: A cross-cultural study. J. Knowl. Manag. 25 (5), 1128–1145. doi:10.1108/jkm-04-2020-0273
Alzahrani, W., Hunt, A., and Whiddett, M. (2021). Barriers and facilitators to using smart home technologies to support older adults. Int. J. Healthc. Inf. Syst. Inf. (ijhisi) 16 (4), 1–14. doi:10.4018/ijhisi.20211001.oa22
Blaschke, J. (2022). Dynamic pricing of electricity: Enabling demand response in domestic households. Energy Policy 164, 112878. doi:10.1016/j.enpol.2022.112878
byrne, R. (2002). Mental models and counterfactual thoughts about what might have been. Trends Cognitive Sci. 6 (10), 426–431. doi:10.1016/s1364-6613(02)01974-5
christoforos, Menosaikateriniadis, ilias, Lamprinos, and Georgilakis pavlos, s. (2022). Particle swarm optimization in residential demand-side management: A review on scheduling and control algorithms for demand response provision. Energies 15 (6), 2211. doi:10.3390/en15062211
Dong, Hua, and Chen, Lei (2021). The value co-creation of the service-oriented manufacturing super-network driven by big data—Taking xiaomi as an example[J]. Finance Account. Mon. 912 (20), 111–119. (in Chinese).
Du, Songhua, Luo, Zichan, and Chen, Yngsen (2020). Value Co-creation based on social network analysis and counterfactual analysis: Taking xiaomi virtual community as an example [J]. J. Guangdong Univ. Technol. 37 (2), 11–21. (in Chinese).
Fie, Xianzheng (2005). On relationship between organizations and environment [J]. Wuhan Univ. J. (Philosophy Soc. Sci. 4, 451–455. (in Chinese).
Li, Gang, Cao, Honggang, Chen, Kai, and Zhang, Xue (2013). Research on evaluation model based on social network analysis [J]. Operations Res. Manag. Sci. 22 (6), 147–152. (in Chinese).
Guo, Haifeng (2009). Study on manufacturing capability from resource-based view[D]. Ha'erbin: Harbin Institute of Technology. (in Chinese).
Guo, Yanni (2018). Research on the improvement of brand competitiveness for domestic appliance enterprises in anhui[D]. He'fei: Hefei University of Technology. (in Chinese).
Jiang, Zhonghui, Luo, Junmei, and Mengchaoyue, (2020). Dynamic capability, structural hole status and sustained competitive advantages-A longitudinal case study of qingdao RedCollar from 1995 to 2018[J]. R&D Manag. 32 (3), 152–164. (in Chinese).
Le, ha thanh, Hoang, dung phuong, Doan, thang ngoc, Pham, C. H., and To, T. T. (2022). Global economic sanctions, global value chains and institutional quality: Empirical evidence from cross-country data. J. Int. Trade & Econ. Dev. 31 (3), 427–449. doi:10.1080/09638199.2021.1983634
Li, wei, Han, ruidi, Zhang, jie, Sun, C., and Fu, P. (2022). An incentive strategy of shiftable load participation in demand response based on user electricity preference. Front. Energy Res. 9, 994. doi:10.3389/fenrg.2021.678828
Liu, Jun (2004). Analysis and discussion on the model of social network [J]. Sociol. Stud. 1, 1–12. (in Chinese).
nikolas, Schöne, kathrin, Greilmeier, and boris, Heinz (2022). Survey-based assessment of the preferences in residential demand response on the island of Mayotte. Energies 15 (4), 1338. doi:10.3390/en15041338
nuria, Rodríguez-lópez (2021). Understanding value Co-creation in virtual communities: The key role of complementarities and trade-offs[J]. Inf. Manag. 58 (5)–103487.
Rasheed, M. B., and R-Moreno, M. D. Minimizing pricing policies based on user load profiles and residential demand responses in smart grids. Appl. Energy, 2022, 310:118492. doi:10.1016/j.apenergy.2021.118492
Roese neal, j. (1997). Counterfactual thinking. Psychol. Bull. 121 (1), 133–148. doi:10.1037/0033-2909.121.1.133
Shin, bokyong (2021). Exploring network measures of social capital: Toward more relational measurement. J. Plan. Literature 36 (3), 328–344. doi:10.1177/0885412221999415
Chakraborty, S., Das, S., Sidhu, T., and Siva, A. K. (2021). Smart meters for enhancing protection and monitoring functions in emerging distribution systems[J]. Int. J. Electr. Power Energy Syst. 127–106626. doi:10.1016/j.ijepes.2020.106626
Song, Jiekun, and Chuchun, (2011). Construction of evaluation model of service enterprise competitiveness portfolio[J]. Statistics Decis. 339 (15), 177–179. (in Chinese).
Song, Yuanfang, and Ji, Ruixia (2018). Research on corporate stakeholder governance based on resource dependence theory—taking NVC lighting company as an example[J]. Mod. Manag. Sci. 300 (3), 6–8. (in Chinese).
Wang, Jian-jun, LI, Li, NIAN, Tian-tian, Liang, Cunyan, and Wang, Yi (2020). Optimization of intelligent electrical apparatus control strategy oriented smart electricity consumption of resident[J]. Smart Power 48 (3), 83–88. (in Chinese).
Nadeem, W., Tan, T. M., Tajvidi, M., and Hajli, N. (2021). How do experiences enhance brand relationship performance and value Co-creation in social commerce? The role of consumer engagement and self brand-connection[J]. Technol. Forecast. Soc. Change 171–120952. doi:10.1016/j.techfore.2021.120952
Wu, W, and Chen, Q. (2012). Analysis on the formation path of value Co-creation theory and prospects for future research[J]. Foreign Econ. Manag. 34 (6), 66–73+81. (in Chinese).
Xu, Jintao, Xing-le, F. E. N. G., and Zhao, Feng (2018). Study on intelligent electric energy meter reliability prediction[J]. Smart Power 46 (4), 28–32. (in Chinese).
Yoon, S., and Kim, E. (2021). Social capital, user motivation, and collaborative consumption of online platform services. J. Retail. Consumer Serv. 62, 102651. doi:10.1016/j.jretconser.2021.102651
Zhai, X., and Zhao, P. (2021). Status quo and characteristics: The application of social network analysis in my country's communication studies[J]. Journal. Lover 519 (3), 67–69. (in Chinese).
Keywords: value co-creation, smart power consumption, social network analysis, counterfactual analysis, residential energy use behavior
Citation: Shuyi Z, Pingkuo L, Chen Z and Quansheng S (2023) Smart power consumption in energy digital economy: A perspective of the value co-creation mechanism. Front. Energy Res. 10:904260. doi: 10.3389/fenrg.2022.904260
Received: 25 March 2022; Accepted: 09 November 2022;
Published: 17 January 2023.
Edited by:
Alberto-Jesus Perea-Moreno, University of Cordoba, SpainReviewed by:
Andre Artelt, Bielefeld University, GermanyCopyright © 2023 Shuyi, Pingkuo, Chen and Quansheng. This is an open-access article distributed under the terms of the Creative Commons Attribution License (CC BY). The use, distribution or reproduction in other forums is permitted, provided the original author(s) and the copyright owner(s) are credited and that the original publication in this journal is cited, in accordance with accepted academic practice. No use, distribution or reproduction is permitted which does not comply with these terms.
*Correspondence: Liu Pingkuo,cGluZ29mb3JldmVyQHNpbmEuY29t
†These authors share first authorship
Disclaimer: All claims expressed in this article are solely those of the authors and do not necessarily represent those of their affiliated organizations, or those of the publisher, the editors and the reviewers. Any product that may be evaluated in this article or claim that may be made by its manufacturer is not guaranteed or endorsed by the publisher.
Research integrity at Frontiers
Learn more about the work of our research integrity team to safeguard the quality of each article we publish.