- Guangdong Power Exchange Center Co. Ltd, Guangzhou, China
Risk in power trading is unavoidable for various reasons. The impact of this risk would vary based on the trading characteristics that mainly depend on the market design and power purchase agreements. So, a security risk management and control system for power trading institutions based on a Bayesian network is designed to reduce the risk of power trading projects. As a part of the network, we first provided the overall architecture of the risk management and control system, which includes a malicious network behaviour detection module, controller selection module, data transmission module, and management and control result visualisation module. Second, the hardware test design was implemented by analysing each module’s working principle and function. Based on the hardware design of the system, the regression analysis method is used to evaluate the risk of power transactions, followed by market fluctuation prediction to obtain the prediction result induced risks. The relationship between security risks and risk-influencing factors is analysed using the Bayesian network. The initial list of risks is established, the uncertain risk factors are reasoned, and the security risk management and control model of power trading institutions is tested to achieve the goal of risk management and control. The experimental results show that this method’s risk management and control efficiency are high. At the same time, this method effectively realised comprehensive risk identification by reducing the loss to power enterprises and has near-practical application value.
1 Introduction
Network technologies (NTs) are being widely used in many applications. NTs mainly use data systems to manage and deliver digital resources through a computer network built specifically for a particular sector (Syuntyurenko and Gilyarevskii, 2021). Various industries currently use computer hardware and system software that maintain NTs. However, with the rapid development of information technology, the application scope of NTs has gradually expanded, especially for the emerging fields (cloud computing and big data) (Syuntyurenko and Gilyarevskii, 2021). The rise of NTs has greatly facilitated the stakeholders’ engagement and brought solid support for enterprise development and national progress (Charwand and Gitizadeh, 2018; Rinalini and Prakash, 2018). Although the convenience of using NTs has brought numerous opportunities, the increase in the number of users, software defects, diversification of network attack types, and other factors have increased the respective risk coefficient. Depending on the application and service (critical or non-critical), the impact of risk varies.
Considering the power and energy sector, NTs play a crucial role in power trading. At present, power transactions between the seller and buyer in the power industry are usually carried out through the network. A minor defect will lead to the whole system’s collapse and failure, putting the power trade and system at risk. The impact of this risk would vary based on the trading characteristics that mainly depend on the market design and power purchase agreements. Therefore, risk management and control of power transactions are of great practical significance to ensure the security of power transactions and enable the smooth operation of power services (Ito et al., 2018; Jack et al., 2018). To better understand the power transaction risk and mitigation measures that are already presented in the literature, we have conducted a brief review and found that only a few studies exist. Gao et al. (2017) designed a risk management method based on a system dynamics model for a power construction project. From the perspective of safety and benefit, the system dynamics model is constructed. Using the system dynamics model, the risk management system is divided into five subsystems: equipment setting, environmental safety, and safety management. Using Vensim_ PLE software, Gao et al. (2017) simulated the risk of a power construction project and obtained the relevant data at the initial stage of the project. They also obtained the safety scheme using an analytic hierarchical process. The system effectively coordinated with the quantities and improved production efficiency, but failed to produce comprehensive risk identification results. Yan et al. (2018) designed a risk management model for power selling companies considering the adoption of new energy resources. A conditional value risk theory model was used to analyse the power purchase proportion of power selling companies upon considering the conditions of new energy resources. At the same time, based on the principal–agent principle, a power sales model was established to analyse the impact of electricity price parameters on power purchase decision-making. Combined with results from the analysis of the two models, effective risk management was realised by Yan et al. (2018). Though this method has delivered a significant decision on risk, it failed to provide insights into economic loss–related decisions that occur in power enterprises’ operations. Wang et al. (2018), using a scenario method, simulated some random variables in the context of power selling and purchasing. The variables include spot prices and electricity demand. The results from Wang et al. (2018) revealed that sales and purchase decision-making and risk depend on the existing contracts. It was also observed that renewable energy penetration also has some impact. In another study, Lu et al. (2020) designed a visualisation system for power grid operation risk management and control. The system followed a five-tier architecture, including a network communication layer, model base support layer, data support layer, dynamic editing layer, and application system layer. The system is also enabled with an underlying support platform where relevant functions between various modules are built. Later, based on digital perception technology, the three-dimensional modelling of the power operation scene was carried out by Lu et al. (2020) to demonstrate the risk scene visually. The experimental results show that the system can visually display the scene of power risk and provide support for power risk management and control decision-making. However, the system has the problem of a long response time.
Based on the previous literature study, it is clear that the existing risk management approaches have certain limitations. There is a strong need to improve security in power trading. In order to improve the security of power trading and reduce the risk of power construction projects, this article proposed a Bayesian network–based security risk management and control system. This proposed method will assist power trading institutions with risk-free power transactions. The system improves the comprehensiveness of risk identification, reduces the economic losses of power enterprises, and enables the rapid control of safety risks.
The article is divided into five sections: Section 2 provides the design of the security risk management and control system, Section 3 provides various security risk control methods used in this study, and the performance results of the proposed method are presented in Section 4, followed by critical conclusions in Section 5.
2 Design of a Security Risk Management and Control System
2.1 Overall Architecture
Security risk management and control of power trading institutions are classified under the power trading system’s technical field. In such fields, every system has built an architecture upon which the system’s function would depend. Even for our proposed system, there is a need for architecture. The overall architecture of the risk management and control system includes a malicious network behaviour detection module, controller selection module, data transmission module, and management and control result visualisation module. In Figure 1, the overall architecture of the system is presented.
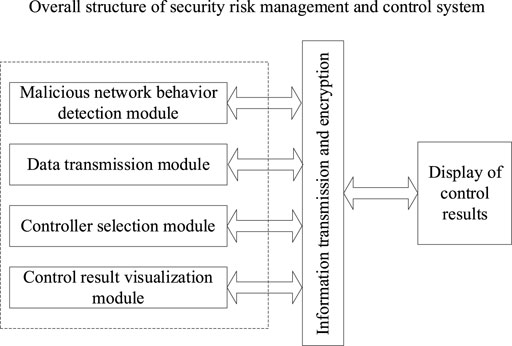
FIGURE 1. The overall architecture of the security risk management and control system of power trading institutions.
According to Figure 1, under the joint action of the four modules, the effective control of malicious network attacks can be realised, and the control results can be displayed to relevant personnel to help them make corresponding decisions. Therefore, the risk control system designed in this article has a good counteracting effect. Applying the system to the power trading environment can effectively prevent trading risks in the power trading market and assist power enterprises in making scientific decisions.
2.2 System Hardware Module Analysis
The overall architecture of the risk management and control system shown in Figure 1 can realise the effective control of safety risks under the joint action of various hardware modules. The specific functions and working principles of each module are provided in the following sections.
2.2.1 Malicious Network Behaviour Detection Module
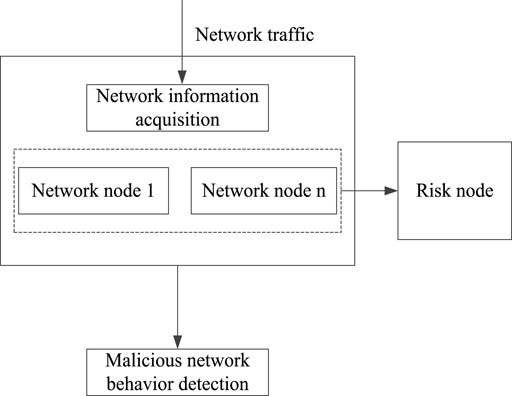
Risk detection and identification are crucial in security risk management and control. Traditionally, the malicious network behaviour detection module is studied as very important research content in signal processing. It is widely used in many fields, such as communication networks and computer networks, to effectively ensure network security (Choi et al., 2019). At this stage, power trading is usually carried out through the network. Therefore, detecting malicious network behaviour in power trading networks is vital. In Figure 2, the workflow diagram of the malicious network behaviour detection module is presented.
According to Figure 2, the malicious network behaviour detection module mainly comprises the connection relationship between network nodes. When there is a risk, the node with a problem can be marked as a risk node. Because the risk node often presents randomness, the association rule method is used to deal with the risk node. After excluding the risk node, malicious network behaviour detection can be realised.
2.2.2 Data Transmission Module
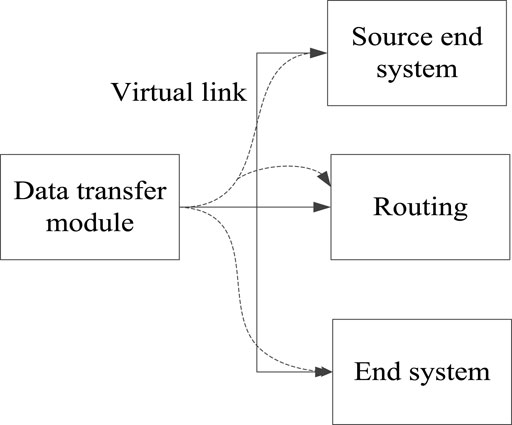
In security risk management and control, a large amount of data are bound to be generated. Dealing with these data is essential, given that it is a factor related to the effect of risk management and control. Usually, the mobile network will transmit data through a virtual link. The link will carry the data to the mobile network and then forward the data using the virtual link through the routing configuration to reach the desired terminal system location (Wu et al., 2021). Figure 3 shows how the data transmission is done.
From Figure 3, the virtual link seems logical from the data source to the receiving end. Here, the data source refers to the source terminal system. The receiving end refers to the terminal system, that is, the power trading organisation. Virtual links can transmit a variety of data in one-to-one or one-to-many connections. In each virtual link, there is a fixed bandwidth. The bandwidth again differs from one virtual link to another link. In this case, it is necessary to isolate each virtual link to make it independent so that the virtual link will not affect other links during use. At the same time, it will not occupy the bandwidth of other links, which ensures the independence of virtual links and shortens the security risk management and control time. Overall, it will improve the management and control efficiency.
2.2.3 Controller Module Selection
The rapid development of network and information technology has led to a sharp increase in data. Large amounts of data bring convenience to people but make the extraction and mining of data more difficult. In the context of power trading, the power transaction data are the internal information of electrical enterprises. Hence, the privacy-sensitive data in power transactions should be encrypted to improve the accuracy of the data and ensure that confidential information is not leaked. Specifically, the migration controller is used to encrypt the data. The primary function of the migration controller is to decide which data to encrypt and directly selects the data with encryption requirements (Chen, 2021). The data selection process of the traditional target server is more complex, and the migration controller has the advantage of a light workload.
2.2.4 Control Result Visualisation Module
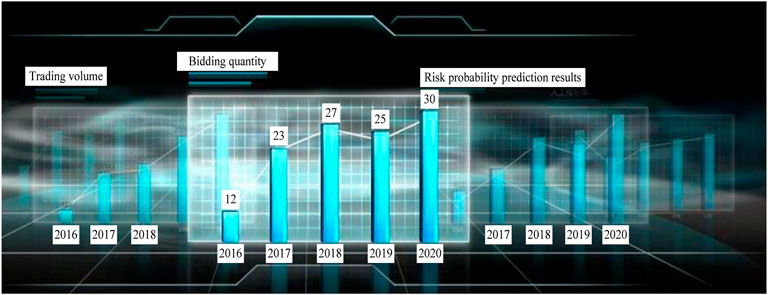
Power transaction data and risks can be effectively processed with the help of the modules discussed in Sections 2.2.1–2.2.3. Therefore, the visual display of control results is the last link of the security risk control system. The results will be displayed to help relevant personnel make power transaction decisions and judgements. Figure 4 shows the visualisation interface of control results.
It can be seen from Figure 4 that in the visual interface, the power transaction data and power risk prediction data of power enterprises over the years can be obtained intuitively. Such data can assist relevant personnel in transaction decision-making.
3 Security Risk Control Methods
Based on the system hardware design, in order to realise the rapid and comprehensive control of security risk, we further studied the security risk management and control methods of power trading institutions.
3.1 Power Transaction Risk Prediction
The operational risk of power trading institutions in all trading links is analysed in a decentralised manner. The regression analysis method as proposed by Goli and Drechsler (2020) is used to assess the risk of power trading so as to realise the risk prediction. Eq. 1 provides the formulated objective function for risk prediction:
where
The power transaction risk characteristics are represented by the set
where
Based on Eqs. 2, 3, the market transaction cost proportion of the power transaction risk assessment is obtained using Eq. 4. Upon solving Eq. 4, the optimal solution for the objective function shown in Eq. 1 is achieved.
where
The benefit gain output of power trading risk
where
Based on the aforementioned five steps, a quantitative evaluation of power transaction risk is estimated. At the same time, future market fluctuations are predicted, and risk prediction is realised.
3.2 Realisation of Security Risk Management and Control
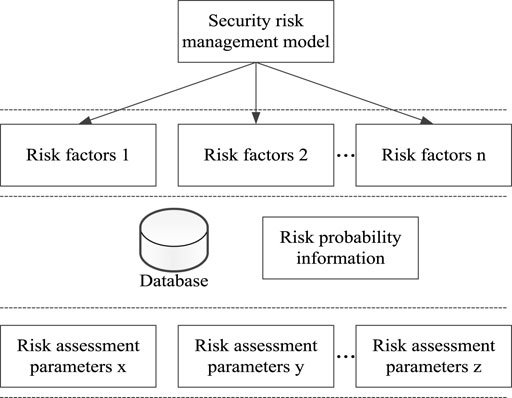
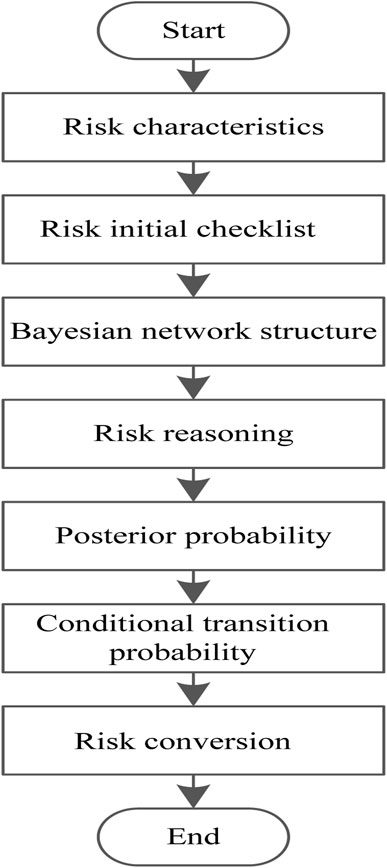
Based on power trading risk prediction results as per Section 3.1, the Bayesian network is used to establish power trading institutions’ security risk management and control models. The Bayesian inference and control knowledge are then transformed into a wide range of empirical analyses (Nie et al., 2018; Sierra et al., 2018; Duan et al., 2020). Here, we analyse the relationship between security risk and risk-influencing factors through a Bayesian network to achieve the purpose of risk control. The security risk management and control model of power trading institutions based on a Bayesian network is shown in Figure 5.
According to Figure 5, the risk management and control model mainly selects the risk characteristics of power transactions from the set
where
The risk probability information is obtained according to the established risk management and control model, clearly including the entire power transaction stage. Since a large amount of probabilistic information is obtained in risk management and control, the Bayesian network nodes represent and store this information (Roostaei et al., 2021; Yan et al., 2021).
Considering the real-time variability of risk, the conditional transition probability reflects the risk variation coefficient. Equation 7 is used to estimate the conditional transition probability:
where
Assuming that
where
where
Upon the successful execution of the aforementioned steps, the design of the security risk management and control method is completed. Then, the effective management and control of the risks in each stage of the power trading project are realised. Figure 6 shows the flow chart of safety risk management and control of power trading institutions.
4 Results and Comparison
Simulation experiments are conducted to test the proposed method’s performance for realising security risk management and control between the power trading institutions. Results are shown for the proposed method; in addition, the results are compared with the methods proposed in the literature to verify the effectiveness of our method.
4.1 Simulation Experiment Environment Settings
The experimental hardware platform consists of a Core i7-2350M processor, 8 GB memory, and the Windows 10 operating system. SPSS 22.0 simulation software was used to process experimental data to ensure the accuracy of experimental results. Taking a large power enterprise as the test object, the performance evaluation of the system application was carried out. We collected power transaction data of the enterprise from the past 2 years to obtain a sample dataset containing 3,000 sample values. From this set, some samples are randomly selected to verify the effect of safety risk management and control. Table 1 shows the results of a descriptive statistical analysis of the relevant information about the power company.
In the aforementioned experimental environment, the control effects of different methods are verified. The results are analysed in Sections 4.2.
4.2 Analysis of System Performance Verification Results
4.2.1 Comparison of Safety Risk Management and Control Efficiency
Using the management and control time as an evaluation index for prediction efficiency, we verified power trading institutions’ safety risk management and control efficiency. The methods proposed by [5] and [6] are compared with the proposed method, respectively. The comparison results of the safety risk management and control time of power trading institutions are shown in Table 2.

TABLE 2. Comparison of results of safety risk management and control efficiency of power trading institutions.
According to the results shown in Table 2, as the number of experiments continues to increase, the safety risk management and control time of the power trading institutions of the three methods gradually increases. When the number of the experiment is 5 times, the control time of the method proposed by Lu et al. (2020) is 15.7 s and the control time of the method proposed by Gao et al. (2017) is 13.8 s. At the same time, the prediction time using the method proposed in this study is only 12.2 s, which is 25.09% and 12.30% lower than the results obtained by Lu et al. (2020) and Gao et al. (2017), respectively. When the experiment number is 25 times, the control time of the method proposed by Lu et al. (2020) is 19.5 s and the control time of the method proposed by Gao et al. (2017) is 19.2 s. At the same experiment number, the control prediction time using the method proposed in this article is 14.6 s. For the increased experiment number, the observed difference in prediction time is 28.74% and 27.22%, respectively, when compared to the results provided by Lu et al. (2020) and Gao et al. (2017). Overall, it can be seen that the control time of our proposed method is shorter, indicating that the security risk control efficiency of this method is higher.
4.2.2 Comparison of Security Risk Management and Control System
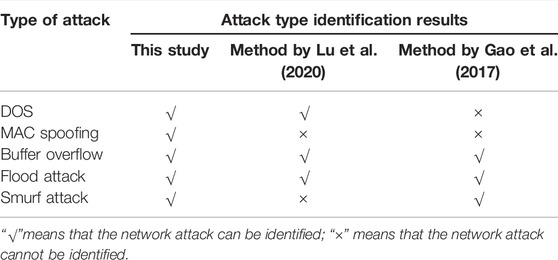
The number of identified attack types evaluates the comprehensiveness of the risk management, and control effect is evaluated. Table 3 shows the test results of the number of identified attack types after applying the three methods.
After analysing the experimental results from Table 3, it can be seen that our proposed method can accurately identify the five types of attacks, and the identification results are more comprehensive. However, when we use the method by Lu et al. (2020) to identify the attack type, only two network attacks are identified. The MAC spoofing and Smurf attack are also lost. At the same time, the method by Gao et al. (2017) shows the same result, but the lost spoofings are DOS and MAC. So, it can be seen that the identification results of our method are more comprehensive, which shows that it is well suitable for the security risk control of power trading institutions. It can also effectively be used to realise the operational risk management of power trading, thereby improving the profitability of commercial power enterprises and their risk control ability.
4.2.3 Comparison of Economic Losses
The ultimate goal of security risk control of power trading institutions is to reduce the economic losses caused by risks and improve the economic benefits of power enterprises. Therefore, taking 2019 as a representative year, the economic losses after risk control by different methods are compared. The comparison results for economic loss are shown in Table 4.
If we observe Table 4 for the method proposed in this article, the economic loss is 382,606.1 yuan. In contrast, the economic loss for the methods by Lu et al. (2020) and Gao et al. (2017) are 574,837.5 yuan and 986,982.3 yuan, respectively. From this, it can be seen that the economic loss under our proposed control method is the lowest, that is, 40.15% lower than the results provided in Lu et al. (2020) and 88.25% lower than the results provided in Gao et al. (2017). Overall, it can be understood that this method can effectively reduce the economic loss of the power enterprise transaction and may have a positive effect by improving the economic development of the enterprise.
To sum up, the control effect of the method in this article is better than that of the traditional method. It has a positive effect on control efficiency, risk identification, and economic loss, which thoroughly verifies its effectiveness.
5 Conclusion
This study aimed to resolve the risk-related problems faced by power trading institutions and the ineffectiveness of the existing methods to tackle such risk. This article proposed a Bayesian network–based security risk management and control system for power trading institutions. The Bayesian network was able to thoroughly analyse the relationship between security risks and risk factors. At the same time, a security risk management and control model for power trading institutions is established to achieve risk management and control. The experimental results showed a positive outcome. The comparisons with the traditional method highlighted the advantages of risk management and control efficiency, the comprehensiveness of risk identification results, and control of power enterprise losses.
Data Availability Statement
The original contributions presented in the study are included in the article/Supplementary Material; further inquiries can be directed to the corresponding author.
Author Contributions
Conceptualisation: SK, LT, JS, EL, JL, and YX; methodology: SK; software: SK, EL, JL, and YX; validation: LT, JS, and EL; formal analysis: SK, JL, and YX; investigation: YX; resources: SK; data curation: SK, EL, JL, and YX; writing—original draft preparation: YX; writing—review and editing: YX and LT; visualisation: SK; supervision: SK; project administration: SK; and funding acquisition: SK. All authors have read and agreed to the published version of the manuscript.
Funding
This work is supported by the Science and technology project support of China Southern Power Grid Corporation (GDKJXM20201925).
Conflict of Interest
SK, LT, JS, EL, JL, and YX were employed by the company, Guangdong Power Exchange Center Co., Ltd.
Publisher’s Note
All claims expressed in this article are solely those of the authors and do not necessarily represent those of their affiliated organizations, or those of the publisher, the editors, and the reviewers. Any product that may be evaluated in this article, or claim that may be made by its manufacturer, is not guaranteed or endorsed by the publisher.
References
Charwand, M., and Gitizadeh, M. (2018). Risk-Based Procurement Strategy for Electricity Retailers: Different Scenario-Based Methods. IEEE Trans. Eng. Manag. 67 (1), 141–151. doi:10.1109/TEM.2018.2864132
Chen, M. (2021). Accounting Data Encryption Processing Based on Data Encryption Standard Algorithm. Complexity 2021 (5), 1–12. doi:10.1155/2021/7212688
Choi, C., Esposito, C., Lee, M., and Choi, J. (2019). Metamorphic Malicious Code Behavior Detection Using Probabilistic Inference Methods. Cognitive Syst. Res. 56 (8), 142–150. doi:10.1016/j.cogsys.2019.03.007
Duan, Z., Wang, L., and Sun, M. (2020). Efficient Heuristics for Learning Bayesian Network from Labeled and Unlabeled Data. Intell. Data Anal. 24 (2), 385–408. doi:10.3233/ida-194509
Gao, C. Y., Shao, H., Bi, H., Zhang, Z., and Song, X. (2017). System Dynamics Model for Electric Construction Project Risk Management. China Saf. Sci. J. 27 (10), 137–143. doi:10.16265/j.cnki.issn1003-3033.2017.10.023
Goli, M., and Drechsler, R. (2020). PREASC: Automatic Portion Resilience Evaluation for Approximating SystemC-Based Designs Using Regression Analysis Techniques. ACM Trans. Des. Autom. Electron. Syst. 25 (5), 1–28. doi:10.1145/3388140
Ito, H., Hanai, K., Saito, N., Kojima, T., Yoshiyama, S., and Fukui, S. (2018). Electricity System Reform Requirements: A Novel Implementation to Grid Management and Control. IEEE Power Energy Mag. 16 (2), 46–56. doi:10.1109/mpe.2017.2779552
Jack, M. W., Suomalainen, K., Dew, J. J. W., and Eyers, D. (2018). A Minimal Simulation of the Electricity Demand of a Domestic Hot Water Cylinder for Smart Control. Appl. Energy 211 (1), 104–112. doi:10.1016/j.apenergy.2017.11.044
Kang, Y-L., Feng, L-L., and Zhang, J-A. (2020). Research on Subregional Anomaly Data Mining Based on Naive Bayes. Comput. Simul. 37 (10), 303–306,316. doi:10.3969/j.issn.1006-9348.2020.10.064
Lou, C., Li, X., and Atoui, M. A. (2020). Bayesian Network Based on an Adaptive Threshold Scheme for Fault Detection and Classification. Ind. Eng. Chem. Res. 59 (34), 15155–15164. doi:10.1021/acs.iecr.0c02762
Lu, D., Zhang, Z. Q., Yu, X. P., Li, P. L., Mi, C. M., and Xu, J. (2020). Research on Architecture and Function of Grid Operation Risk Control Visualisation System. J. Nanjing Univ. Sci. Technol. 44 (01), 87–93.
Nie, S., Zheng, M., and Qiang, J. (2018). The Deep Regression Bayesian Network and its Applications: Probabilistic Deep Learning for Computer Vision. IEEE Signal Process. Mag. 35 (1), 101–111. doi:10.1109/msp.2017.2763440
Rinalini, L., and Prakash, G. C. (2018). Risk-Based Coalition of Cooperative Microgrids in Electricity Market Environment. IET Generation Transm. Distribution 12 (13), 3230–3241. doi:10.1049/iet-gtd.2017.1562
Roostaei, J., Colley, S., Mulhern, R., May, A. A., and Gibson, J. M. (2021). Predicting the Risk of GenX Contamination in Private Well Water Using a Machine-Learned Bayesian Network Model. J. Hazard. Mater. 411 (10), 125075. doi:10.1016/j.jhazmat.2021.125075
Sierra, L. A., Yepes, V., García-Segura, T., and Pellicer, E. (2018). Bayesian Network Method for Decision-Making about the Social Sustainability of Infrastructure Projects. J. Clean. Prod. 176 (1), 521–534. doi:10.1016/j.jclepro.2017.12.140
Syuntyurenko, O. V., and Gilyarevskii, R. S. (2021). Trends and Risks of Network Technologies. Sci. Tech. Inf. Proc. 48 (2), 97–106. doi:10.3103/s0147688221020088
Wang, L., Zhang, L., Zhang, F., and Jin, D. (2018). Decision-Making and Risk Assessment of Purchasing and Selling Business for Electricity Retailers. Autom. Electr. Power Syst. 42 (1), 47–54. doi:10.7500/AEPS20170522001
Wu, Y., Pickavet, M., and Colle, D. (2021). Analysis of Interference on Mirror-Aided Non-LOS Backhaul Data Transmission in VLC Attocell Networks. Photonic Netw. Commun. 41 (7), 189–201. doi:10.1007/s11107-021-00928-w
Yan, H., Zhao, W., and Liu, W. (2018). A Risk Management Model of Power Retailers Considering the Participation of New Energy. Proc. CSEE 38 (23), 6947–6954+7128. doi:10.13334/j.0258-8013.pcsee.172693
Yan, H., Wang, F., Yan, G., and He, D. (2021). Hybrid Approach Integrating Case-Based Reasoning and Bayesian Network for Operational Adjustment in Industrial Flotation Process. J. Process Control 103 (12), 34–47. doi:10.1016/j.jprocont.2021.05.003
Zhao, Y., Tong, J., and Zhang, L. (2021). Rapid Source Term Prediction in Nuclear Power Plant Accidents Based on Dynamic Bayesian Networks and Probabilistic Risk Assessment. Ann. Nucl. Energy 158 (3), 108217. doi:10.1016/j.anucene.2021.108217
Keywords: Bayesian network, electricity trading, risk control, virtual link, regression analysis method
Citation: Kong S, Tian L, Sheng J, Lu E, Luo J and Xu Y (2022) Performance Verification of Bayesian Network–Based Security Risk Management and Control System for Power Trading Institutions. Front. Energy Res. 10:904079. doi: 10.3389/fenrg.2022.904079
Received: 25 March 2022; Accepted: 10 June 2022;
Published: 13 July 2022.
Edited by:
Nallapaneni Manoj Kumar, City University of Hong Kong, Hong Kong SAR, ChinaReviewed by:
Benyoh Emmanuel Kigha Nsafon, Kyungpook National University, South KoreaPremkumar M., GMR Institute of Technology, India
Copyright © 2022 Kong, Tian, Sheng, Lu, Luo and Xu. This is an open-access article distributed under the terms of the Creative Commons Attribution License (CC BY). The use, distribution or reproduction in other forums is permitted, provided the original author(s) and the copyright owner(s) are credited and that the original publication in this journal is cited, in accordance with accepted academic practice. No use, distribution or reproduction is permitted which does not comply with these terms.
*Correspondence: Shuqin Kong, c2h1cWluZ19rb25nQDE2My5jb20=
 Shuqin Kong
 Lin Tian