 Qing Shi
94% of researchers rate our articles as excellent or good
Learn more about the work of our research integrity team to safeguard the quality of each article we publish.
Find out more
ORIGINAL RESEARCH article
Front. Energy Res., 24 May 2022
Sec. Sustainable Energy Systems
Volume 10 - 2022 | https://doi.org/10.3389/fenrg.2022.903465
This article is part of the Research TopicCritical Energy Minerals: A Material Enabler for Carbon NeutralityView all 17 articles
With accelerating automotive electrification process, quantitative analysis of cobalt demand becomes a critical issue in China. How much cobalt is expected to be needed from 2021 to 2030 to support a smooth automotive electrification in China? This study aims to answer this question comprehensively by examining the responses of annual cobalt demand to variations in electric vehicle sales, battery capacity factors, and cobalt substitution effects, which has not been fully explored in previous literature. Scenario analysis based on the Bass model is adopted and historical data from 2012 to 2020 are used for this study. The results show that 1) the peak annual cobalt demand will reach 35.58–126.97 kt/year during 2021–2030; 2) cobalt demand is expected to decline by 14.29% if the market share of ternary lithium-ion battery decreases by 10%; 3) while cobalt substitution can reduce the demand substantially, it cannot offset the growth of cobalt demand driven by the increasing EV sales and battery capacity. These results provide a knowledge base for policy suggestions to manage the cobalt demand—supply balance in China better.
The transport sector is the second-largest source of carbon emissions in China, accounting for 9% of its total emissions (Xue et al., 2019). Decarbonizing transport via automotive electrification can help China mitigate emissions and achieve its carbon peak goal by 2030 (Huang and Ge, 2019). Driven by technological progress, infrastructure construction, and governmental subsidies, the annual sales of battery electric vehicles (BEVs) and plug-in hybrid electric vehicles (PHEVs) increased rapidly in China from 8159 units in 2011 to 1.2 million units in 2019 (CAAM, 2021), creating the largest global electric vehicle (EV) market to date (IEA, 2020). The pace and magnitude of automotive electrification has led to a massive increase in the demand for cobalt, a critical and expensive raw material essential for the functioning and integrity of current ternary lithium-ion batteries (TLIBs) ecosystems (Xu et al., 2020; Zhao et al., 2020). The Democratic Republic of the Congo (DRC) monopolizes the global supply of cobalt ores and concentrates (Shi et al., 2022); this geographical mismatch between the areas that represent the major supply and demand of cobalt presents new challenges to mineral security (IEA, 2021b). As China has accelerated its efforts toward automotive electrification, policymakers and domestic companies must ensure that China’s demand can be met in a sustainable and secure manner. To assess the sustainable availability and security of cobalt for relevant decision makers at the macro and micro levels, it is essential to quantify the variations in future cobalt demand under different outlooks of EV sales and battery-related technologies.
Cobalt demand in China, the largest EV market worldwide, has received increasing scholarly attention. Such research can provide useful information for policymakers to respond to the challenges of mineral security better and offer long-term visibility for companies to invest in and supply cobalt-related products. By using material flow analysis (MFA), several studies estimated the cobalt consumption by various end-use products in China (Zeng and Li, 2015; Chen et al., 2019; Liu et al., 2021). Focusing on the cobalt consumption driven by the automotive electrification, the existing studies get started by forecasting electric vehicle sales and emphasize the impacts of EV market-related factors on cobalt demand. Among these explorations, Hsieh et al. (2020) featured an EV projection model based on price-related factors. Ou et al. (2021) made a more comprehensive consideration of the price-related factors and dual-credit policy in their New Energy and Oil Consumption Credits (NEOCC) model. In addition to the micro factors, Jones et al. (2020) studied the impact of macroeconomic variables on EV sales in their cost, macro, infrastructure, technology (CoMIT) model and highlighted China’s cobalt demand in their analysis.
Previous studies have provided rich knowledge for understanding the cobalt demand driven by the automotive electrification transition in China. However, their models for projecting EV sales require highly on data and their benefits come at the cost of the sensitivities and uncertainties derived from the numerous or simplified assumptions of variables (Ou et al., 2021). The development of a concise model that shows a good fit with historical data and thus can provide the diffusion features of EVs deserves academic exploration. In addition, the effects of cobalt substitution have not been fully explored in previous studies. For example, while Ou et al. (2021) failed to explore nickel manganese cobalt (NMC) compositions beyond NMC622 and NMC9.5.5, Jones et al. (2020) failed to study the rich variations in cobalt demand under different scenarios of TLIBs market share and NMC chemistry developments. Finally, few studies have fully explored the responses of annual cobalt demand to variations in EV sales, battery capacity factors, and cobalt substitution effects in China.
Considering existing related studies, the marginal contributions of this study are summarized as follows. First, this study builds and estimates a Bass model for projecting EV sales in China. Using the latest historical EV sales data from 2012 to 2020 and the updated outlooks of EV market potential, this study calibrates the Bass model, which shows excellent fitness. Second, various market shares of TLIBs and battery mix scenarios are considered in projecting the cobalt demand by 2030. Through these new explorations, we complement the findings of existing studies regarding the outlook of cobalt demand for the EV sector in China and provide more scenario perspectives that could help decision makers rethink their policies on cobalt demand–supply balance. Finally, this study examines the responses of annual cobalt demand to variations in EV sales, battery capacity factors, and cobalt substitution effects, which enriches understanding of the sensitivity of cobalt demand.
The remainder of this paper is organized as follows: Section 2 introduces the framework to forecast cobalt demand and the data used for this study; Section 3 presents the main results and related discussions; and the last section summarizes the main conclusions and offers several policy implications.
This study forecasted the annual cobalt demand driven by automotive electrification in China from 2021 to 2030 using a three-step process. The scale of EVs in China for the next decade was firstly projected, followed by the projection of the capacity of TLIBs. Based on the forecast of the annual installed battery capacity, the types and quantities of cobalt used in different battery chemistries were defined and the annual cobalt demand was projected. The forecasting framework for this study is illustrated in Figure 1.
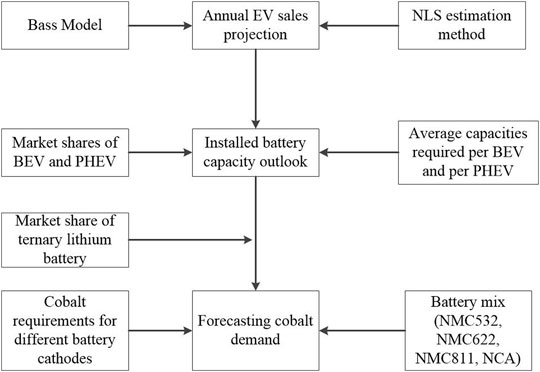
FIGURE 1. Framework for forecasting the cobalt demand in China (2021–2030).
The Bass model was developed by Frank M. Bass in 1969 to describe the timing of the initial purchase of new products (Bass, 1969). It has been widely adopted for predicting innovation diffusion (Meade and Islam, 2006). The diffusion of new products, like new electric vehicle, has often been found to follow a S-shaped curve. Bass model achieves a long success in describing this type of diffusion through a simple mathematical form (Massiani and Gohs, 2015). Specifically, its success builds on three factors: first, Bass model can predict a smooth diffusion curve, which is consistent with the common perception of the diffusion of new products; second, it is data parsimonious; third, the Bass approach fits sales almost as well as much more complex models. Due to these advantages, the simple Bass model still dominates other models in the field of diffusion studies (Massiani and Gohs, 2015).
In his basic model, Frank M. Bass categorized new product buyers or technology adopters into two groups–innovators and imitators–and proposed that the probability that an initial purchase made at time t is a linear function of innovators and imitators’ influence, respectively (Bass, 1969; Bass et al., 1994), can be expressed by Eq. 1,
where f (t) is the density function describing the proportion of purchasers to potential total buyers at time t,
Assuming
The density function then becomes:
With the density functions, if m (market potential) denotes the total number of ultimate buyers, we can obtain the number of buyers at time t (annual EV sales in this study), n(t).
In the Bass model, first-time buyers of a new product are considered, and repeated adopters are excluded for a certain period. Furthermore, buyers are assumed to purchase only one unit of the new product. In the case of purchasing EVs for a certain period, such as 10 years, these assumptions are reasonable. Therefore, the number of innovative buyers equals the number of times an innovation is adopted (Li et al., 2019).
Parameter m is treated as an exogenous parameter (Massiani and Gohs, 2015). Market potential is set with three scenarios, that is, pessimistic (abbreviation: PESS), baseline (abbreviation: BASE), and optimistic (abbreviation: OPTI) to reduce the impacts of the uncertainties of technological and market conditions (Li et al., 2019). In the technology roadmap for energy-saving and new-energy vehicles, the China Society of Automotive Engineers projected that there will be 80 million electric vehicles in China by 2030 (SAE-China, 2016). Therefore, we set our baseline scenario at a market potential of 80 million.
With the increasing number of charging stations, convenient infrastructure, cheaper expenditures on life-cycle usage, and the Chinese government’s ambitious promotion policies to achieve carbon neutrality, EV sales are expected to increase significantly. Like Li et al. (2019), we set two times the baseline scenario as the optimistic scenario; that is, the market potential will be 160 million by 2030. The pessimistic scenario was set as half of the market potential of the baseline scenario; that is, the market potential will be 40 million by 2030.
In addition to the market potential, two parameters, p and q, are estimated in the Bass model; we selected nonlinear least squares (NLS) approach to estimate p and q because of its advantage in obtaining valid standard error estimates and one-step-ahead forecasts (Srinivasan and Mason, 1986). For the NLS approach, initial values of p and q are required to estimate the Bass model and the estimated parameters are sensitive to the initial values (Massiani and Gohs, 2015). Thus, ordinary least squares estimates obtained from Eq. 5, which is a transformed form of the alternative expression of the Bass model (Eq. 6), were used as initial values for estimating Bass model (Srinivasan and Mason, 1986). N(t) denotes the cumulative buyers at time t.
The estimated p and q under different m values are listed in Table 1. R2 value, Supplementary Figures S1, S2 show that the predicted values fit the historical data well. Therefore, the estimated Bass model was found suitable to forecast future annual EV sales in China.
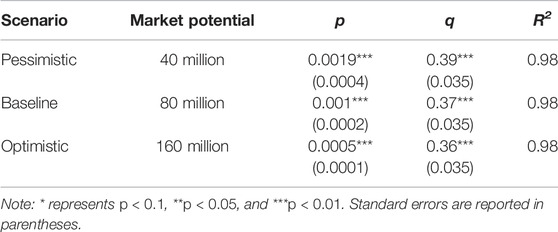
TABLE 1. Parameters of the Bass model under different market potential scenarios.
The historical data of China’s EV sales from 2012 to 2020 (see Supplementary Table S1) indicate that the market share of BEVs and PHEVs on average is 80% and 20%, respectively. Therefore, the market structure parameter was assumed to be constant. With this constant, the annual BEV sales (
The battery capacities required for BEVs and PHEVs are different. It has been reported that the average battery capacity required2 for BEVs is approximately 66 kWh. and that for PHEVs is approximately 12 kWh (Xu et al., 2020). With this battery capacity assumption, we forecasted the newly installed battery capacity in year t, as given by Eq. 7,
where y(t) denotes the newly installed battery capacity in year t, α is the average battery capacity required for BEVs, and β is the average battery capacity required for PHEVs.
There are currently several battery chemistries for EVs, which can be categorized as TLIBs and lithium iron phosphate (LFP) batteries.3 In 2019, TLIBs accounted for 70% of the total market (GGII, 2020). With the development of cell–to–pack (CTP) technology by CATL company and the introduction of blade battery by BYD company, the market share of LFP batteries is likely to increase because of their increased driving mileage, lower price, and higher safety. Furthermore, other novel battery technologies, such as lithium–air batteries, may capture some market share. Owing to these technological developments, we set the battery capacity market share scenario for TLIBs as follows: the high scenario corresponds to 70% of y(t), medium scenario to 60% of y(t), and low scenario to 50% of y(t).
In addition to EV sales, market structures of EVs, and battery type, the battery mix and its evolving trend were considered when projecting cobalt demand for EVs. Based on the cobalt content in the cathode chemistry of TLIBs, the NMC series is classified as NMC111, NMC532, NMC622, and NMC811. NMC111, the simplest form, was excluded here because of its higher usage and lower energy density than other NMC forms such as NMC532 (Azevedo et al., 2018). Consequently, the battery mix contains NMC532, NMC622, NMC811, and the NCA. The cobalt contents of these four chemicals are listed in Table 2. The annual cobalt demand estimation is expressed as Eq. 8.
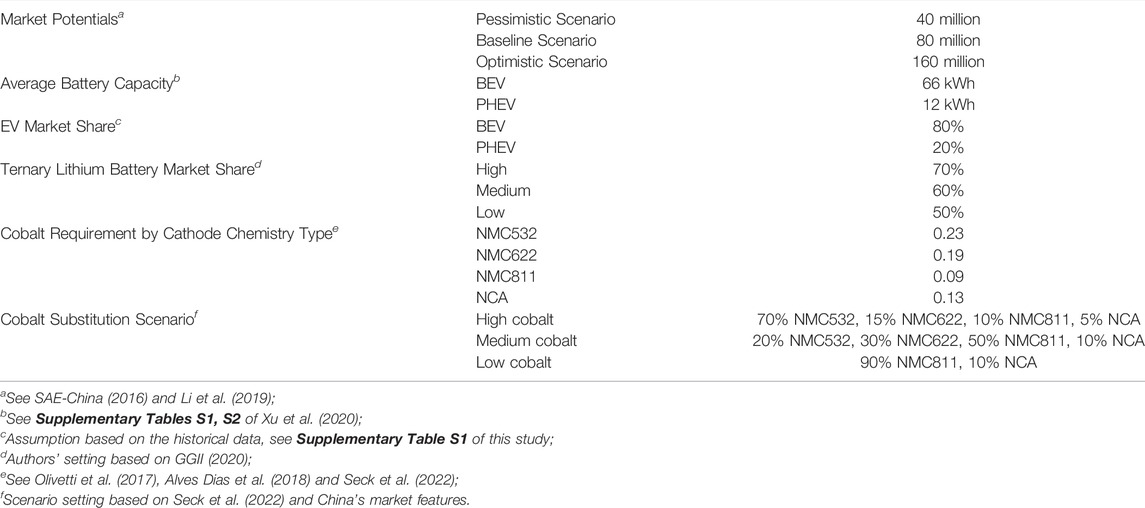
TABLE 2. Assumptions on major variables.
In Eq. 8,
Owing to the increasing scarcity of cobalt resources and the consequent higher battery costs, automobile manufacturers and battery producers have invested more in less cobalt-intensive chemistries such as NMC811 and NCA.4 The battery mix for EVs is likely to transform from cobalt-intensive technologies to fewer cobalt chemistries (Xu et al., 2020). Considering this development trend of the battery mix, we set three cobalt substitution scenarios as follows: a high-cobalt scenario consisting of 70% NMC532, 15% NMC622, 10% NMC811, and 5% NCA; a medium cobalt scenario corresponding to a portfolio of 10% NMC532, 30% NMC622, 50% NMC811, and 10% NCA; and a low cobalt scenario consisting of 90% NMC811 and 10% NCA (Seck et al., 2022). Table 2 presents all the major assumptions adopted in this study.
The EV annual sales and cumulative sales data (2012–2020) for estimating p and q are from China Association of Automobile Manufacturers (CAAM, 2021) (see Supplementary Table S1). Market potential estimation was based on the projection data of EV sales of SAE-China (2021). Descriptive statistics for the EV data are presented in Supplementary Table S2. The annual installed battery capacity to show the fitness of the projected data is provided in Supplementary Figures S3. SI also provides the BEV and PHEV shares data during the period 2012–2020.
Figure 2 shows the annual cobalt demand for the EV sector in China during 2021–2030. In each scenario, the demand for cobalt first rises rapidly and then starts to fall. This type of demand curve is closely related to the maturity of the EV market, which is also observed in the case of the Netherlands, one of the newly emerging EV markets (Tang et al., 2021). The differences among these scenarios are in the scales and the turning year of annual cobalt demand (see Figure 2), which are significantly influenced by annual EV sales (see more discussions in Section 3.2) and the substitution effects (see further discussions in Section 3.4).
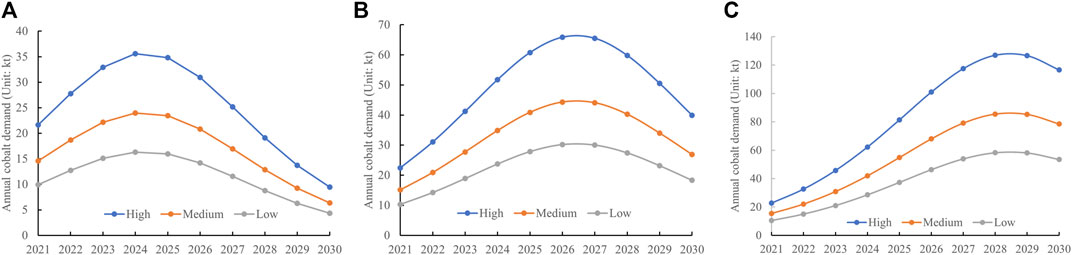
FIGURE 2. Annual cobalt demand for EVs under different scenarios. (A) shows the cobalt demand for the pessimistic market potential scenario; (B) is for the baseline market potential scenario; (C) is for the optimistic market potential scenario. In the legend, High denotes the high cobalt scenario, Medium denotes the medium cobalt scenario, and Low represents the low cobalt scenario. This figure plots the high scenario of ternary lithium battery market share (70%). Medium and low scenarios are provided in the (Supplementary Figures S4, S5).
The cobalt demand will increase until 2026 to the highest requirement of 65.82 kt/year and then begin to decrease for the baseline scenario. For the pessimistic and optimistic scenarios, the highest annual demand of 35.58 kt/year and 126.97 kt/year will occur in 2024 and 2028, respectively. For the growth stage of annual cobalt demand, the compound annual growth rates were 13.25, 19.6, and 23.94% for the pessimistic, baseline, and optimistic scenarios, respectively.
In previous studies related to the projection of annual cobalt demand for EVs in China, Ou et al. (2021) predicted an upper range of 7.17–111.18 kt/year during 2020–2030, Hsieh et al. (2020) reported that China’s annual cobalt demand will reach 55.2 kt/year by 2030, and Jones et al. (2020) projected an annual demand of 125 kt/year by 2030. Based on the projected scale of annual cobalt demand, most of the projections of previous studies are within the range of our projections, which, on the one hand, provides a degree of confidence in the modelling framework presented in this paper. On the other hand, there are differences among these studies in the growing trend of cobalt demand that result from the different outlooks of market potentials and different modelling of the EV sales trajectory. Therefore, this study provides a new perspective on the outlook of annual EV sales over the next decade in China.
Our scenario analysis is also different from that of Zeng and Li (2015), who projected that the annual cobalt demand for batteries will increase to 75.7 kt by 2030. There are three key reasons for this discrepancy. First, they estimated the cobalt demand with an average increasing rate of 33.7% for batteries based on linear regression analysis, which implies a growing trend during 2012–2030. Our estimations are based on a nonlinear Bass model that suggests a growth and then a decline in annual EV sales. Second, they investigated the net annual demand by considering the recycling rate, while this study assumes that recycling is a factor that influences supply (Alves Dias et al., 2018) and projects the total cobalt demand. Third, the battery considered by Zeng and Li (2015) is for 3C products that have a shorter lifetime than EVs. The total cobalt requirements used for one unit of the 3C products and one EV are completely different.
Comparing our finding with the cobalt demand of the European Union (EU), the second-largest EV market (IEA, 2020), is meaningful. In 2018, the EU projected that its highest annual cobalt demand may increase to 36.37–123.2 kt/year by 2030 (Alves Dias et al., 2018). The upper value of the range corresponds to its ERTRAC High scenario, which is similar to our optimistic outlook on annual EV sales. The comparison results show that the optimistic outlooks for the annual cobalt demand by 2030 in China and the EU are almost the same. China’s EV market started to grow two to three years earlier than that of the EU (IEA, 2020); consequently, its peak cobalt demand occurred earlier. Simon et al. (2015) estimated the cobalt requirement for the EU by 2030, adopting a similar approach to ours; they projected a similar growth curve for cobalt demand–a growth, followed by a fall.5
From a global perspective, the annual cobalt demand for EVs will increase to 115–360 kt/year by 2030, depending on the scenario (IEA, 2020; Fu et al., 2020). Based on these projections, our scenario results indicate that China’s demand share could account for 8.2%–32%.
Figure 3 shows that annual EV sales in China are expected to first rise and then fall from 2021 to 2030, suggesting that the predicted scales approach is gradually closer to the targeted market potentials. The growth curves follow the general diffusion characteristics of new products. Along with the massive deployment of EVs and decreasing costs, EV sales are expected to experience a rapid growth. However, as the EV market becomes mature, the growth rate will slow down and gradually converge toward the market potential (Li et al., 2019). The turning year will vary according to the scenario. The pessimistic, baseline, and optimistic scenarios are 2024, 2026, and 2028, respectively. This result indicates that in the most optimistic scenario, China will cease to be the leading driver of the global EV market after 2028.6
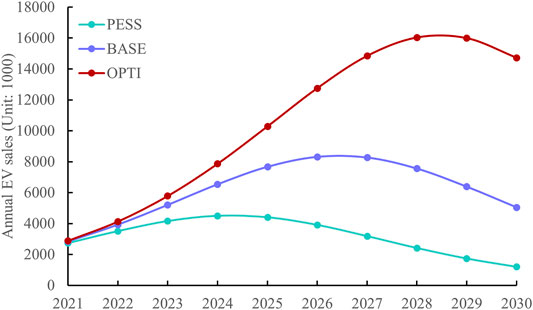
FIGURE 3. Annual EV sales forecast in China until 2030.
The highest annual EV sales will be 4.5–16 million units during 2021–2030. Cumulative sales by 2030 is expected to reach 37–111 million units, of which 29.6–88.8 million units will be BEVs and 7.4–22.2 million units will be PHEVs, representing an increase by a factor of 6.7–20 from 5.55 million units in 2020. The differences in EV sales between the scenarios reflect China’s determination to achieve the national EV deployment target,7 which will have a significant influence on the annual cobalt demand. The different projections on the scale and growth curve of annual EV sales differentiate this study from others (Hsieh et al., 2020; Jones et al., 2020; Ou et al., 2021). With the other variables being constant, our results show that, by 2030, the annual cobalt demand in the pessimistic scenario will be 76% lower and that in the optimistic scenario will be 1.92 times higher than the annual cobalt demand in the baseline scenario.
The battery capacity installed in the EV sector depends on the scale of EV deployment, the market share of BEVs and PHEVs, and battery capacity requirement per BEV/PHEV. As noted in the Method section, the market shares of BEVs and PHEVs and the battery capacity requirement per EV are assumed to be constant. Therefore, the growth curve of the annual installed battery capacity is similar to that of the annual EV sales (see Supplementary Figures S3). The highest annual battery capacity installed is expected to be 248–885 GWh during 2021–2030.
The market share of BEVs is a key factor influencing the annual installed battery capacity, which affects the annual cobalt demand. Many states have set ambitious goals for achieving 100% BEV sales by 2030 (IEA, 2021a; Tang et al., 2021). To determine the response of cobalt demand to the structural change in the EV market in China, we performed a simple sensitivity analysis, assuming 100% BEV sales during 2021–2030. The results indicated that cobalt demand would increase by 19.57% compared with 80% BEV sales, ceteris paribus.
The average battery capacity requirement per BEV/PHEV is expected to increase over time as the driving range increases and battery prices decrease (Fu et al., 2020; Tang et al., 2021). The prospective capacity requirement can reach 75 kWh for BEVs and 20 kWh for PHEVs (Fu et al., 2020). Compared with the capacity requirements of 66 kWh for BEVs and 12 kWh for PHEVs, ceteris paribus, the annual cobalt demand is expected to increase by 15.94% during 2021–2030.
The shrinking market share of TLIBs and the development of less cobalt-intensive cathode chemistries for TLIBs are two technology-substitution mechanisms that can be used to reduce the use of cobalt in EV batteries. A higher market share of TLIBs corresponds to higher cobalt demand. Based on our scenario analysis, cobalt demand is expected to decline by 14.29% if the market share of TLIBs decreases by 10%. Currently, in China, LFP batteries are the competitive substitutes because of their lower production costs, better thermal stability, and longer cycle life. Furthermore, the development of CTP technology and blade batteries, introduced in 2020, created a substantial market substitution in 2021.8 Nevertheless, it is important to understand that the excellent energy density of TLIBs containing a certain amount of cobalt is still more attractive for EV applications than other options (Olivetti et al., 2017). The higher energy intensity of TLIBs is an essential advantage. Additionally, the advantage of the CTP technology in increasing the volume utilization rate of battery packs is ultimately limited. Therefore, the market share of TLIBs is unlikely to be completely replaced in the next decade.
The other substitution effect comes from the development of less cobalt-intensive cathode chemistries. The results of the scenario analysis indicated that the annual cobalt demand in the medium and low cobalt scenario are 21.46 and 54.15%, respectively, lower than that in the high cobalt scenario. In the low-cobalt scenario, with 80 million EV market potential, the highest annual cobalt demand is expected to be 21 kt/year. Developing less cobalt-intensive battery chemistries, such as NMC811 and NCA, is indeed helpful for lowering the pressure on the cobalt supply.
By combining the Bass model and scenario analysis, this study analysed the cobalt demand for automotive electrification in China from 2021 to 2030. The results show that 1) cobalt demand will first rise and then start to fall; the peak annual cobalt demand will reach 35.58–126.97 kt/year during 2021–2030, mainly driven by the annual EV sales. 2) Complete automotive electrification and increasing battery capacity will drive annual cobalt demand to grow by 19.57 and 15.94%, respectively. 3) The demand elasticity of the shrinking market share of TLIBs is 1.43, whereas the battery mix of low-cobalt chemistries can reduce cobalt demand by 54.15% compared with the high-cobalt mix. These results provide a good reference for understanding cobalt demand–supply balance and designing policies to manage this balance.
First, China’s cobalt supply is mainly fulfilled by natural mineral mining and cobalt imports. According to USGS (2021), cobalt production in China was 2.5 kt in 2019 and the estimated production in 2020 was 2.3 kt. This implies that domestic production is insufficient to support China’s consumption in each of the scenarios presented in this study, although cobalt demand is projected to peak in all scenarios. Consequently, China, in most cases, has to continue importing over 90% of its cobalt demand, especially from the leading global supply source, the DRC, which can supply up to 95 kt annually. To hedge a sudden drop in production or supply crisis contagion (Sun et al., 2021), China should build a dynamic strategic cobalt reserve and encourage domestic companies to establish commercial reserves. Moreover, managing potential risks related to the DRC is another priority for China. Reducing the risks associated with the artisanal mining is one of them. The Chinese central government and the DRC should work together to establish rules for sustainable cobalt production that meet environmental, social, and governance standards. Chinese companies running business in the DRC need to work with their counterparts to develop a tracking system based on blockchain technology to allow the whole cobalt industry chain to achieve a secure and sustainable supply.
Second, considering the substantial impact of cobalt, this study advocates research and development in all prospective battery technologies. As discussed earlier, cobalt-free and low-cobalt chemistries are two substitution mechanisms. From the perspective of a cobalt-free option, the CTP/blade battery using LFP is commercially available, while the other cobalt-free batteries are in its early stage of development. Therefore, they should be treated differently. As a transition technology, the former is competitive. Governments can give this battery technology more credit by dynamically updating the dual-credit policy and thus help in increasing its market share. As for the other cobalt-free batteries, China can co-start a global research initiative with the EU and United States and accelerate its development process to make it more attractive and cost-competitive, which will help free the battery industry from the bottleneck of scarce cobalt resources and ensure a smooth transition to zero-emissions from vehicles. Commercialized technology is now ready for less-cobalt batteries and has entered the pre-stage of industrial-scale production (Kim, 2021). Therefore, policy support is suggested to scale-up production to increase its market share in the battery mix.
Third, scholars treat recycling as a critical solution for the sustainability of cobalt utilization in China (Zeng and Li, 2015; Wang and Ge, 2020). A recent study in China revealed that 3.1 kt of cobalt was recovered from end-of-life LIBs in 2018, which provided 12.8% of the cobalt supply for new LIBs (Liu et al., 2021). Thus, in the future, the potential for recycling is huge, given the magnitude of spent batteries (Wang and Ge, 2020). The recycling rate of end-of-life batteries relies on a national recycling system and mature recycling technologies (Tang et al., 2021). However, the recycling rate of end-of-life LIBs in China is low (Liu et al., 2021) because of the lack of an effective recycling system and early-stage recycling technologies. Therefore, it is highly recommended that governments set mandates and incentives sooner rather than later to establish a collection system for batteries and increase the recycling rate of cobalt-bearing batteries.
This study focuses on the light-duty vehicle and does not consider the electrification of medium- and heavy-duty vehicles, which would be analyzed in the future. Since our focus is on the cobalt demand projection, variables like price, advertising, and policy efforts are treated as blackbox in the Bass model. In the future, a more generalized Bass model could be adopted to study the comprehensive impacts of price and policy efforts on cobalt demand. In addition, this study does not consider the disruptive impact of hydrogen vehicle development on cobalt demand.
The original contributions presented in the study are included in the article/Supplementary Material, further inquiries can be directed to the corresponding author.
QS: Conceptualization, Methodology, Formal analysis, Visualization, Programming, Writing- original and revised manuscripts.
I’m thankful to the financial supports from the Humanities and Social Sciences Foundation of the Ministry of Education of China (Grant No. 20YJC790110), the National Natural Science Foundation of China (Grants No. 41901246), and the Basic and Applied Research Co-Foundation of Guangdong (Grant No. 2019A1515110693).
The author declares that the research was conducted in the absence of any commercial or financial relationships that could be construed as a potential conflict of interest.
All claims expressed in this article are solely those of the authors and do not necessarily represent those of their affiliated organizations, or those of the publisher, the editors and the reviewers. Any product that may be evaluated in this article, or claim that may be made by its manufacturer, is not guaranteed or endorsed by the publisher.
The author is very grateful to Zhipeng Sun at University of Science and Technology Beijing for his field-knowledge in battery that enriches the discussions of this study. The handling editor and two reviewers are much appreciated for their constructive comments that improve the quality of this paper.
The Supplementary Material for this article can be found online at: https://www.frontiersin.org/articles/10.3389/fenrg.2022.903465/full#supplementary-material
1This study adopts a different estimation procedure of EV sales from Li et al. (2019) who firstly assigned market potentials to four EV types and then estimated the model parameters and projected the annual sales for each segment of EV market. On the contrary, this study firstly estimated the parameters for the whole EV market and projected the annual sales accordingly, and then assigned the annual sales to PHEVs and BEVs based on the ratio of PHEVs to BEVs.
2The average battery capacity required is measured as the mean value of small-, mid-, and large-sized EVs; the required capacity is the product of EV range, fuel economy, and the ratio of available battery capacity for driving EVs. See S1 in the SI of Xu et al. (2020) for further details.
3There are five main battery chemistries for producing lithium-ion batteries (LIBs), including lithium cobalt oxide (LCO), lithium nickel manganese cobalt (NMC), lithium nickel cobalt aluminum (NCA), LFP, and lithium manganese oxide (LMO). Among them, LFP battery and LMO battery do not contain cobalt elements, and thus were excluded from the study. LCO is used extensively in portable electronics but not in EV applications due to its high usage of expensive cobalt (Azevedo et al., 2018). NMC series and NCA are categorized as the TLIB type.
4For example, it is reported that Tesla installs NCA battery for its Model S and works with suppliers toward reducing cobalt contained in future chemistries (Azevedo et al., 2018).
5However, the projection is based on the relatively conservative outlook for EV sales and the relatively aggressive battery mix. Therefore, the scale of their projected cobalt demand is different from (Alves Dias et al., 2018).
6According to the Global EV Outlook (2021) recently issued by International Energy Agency, Europe overtook China for the first time with 1.4 million new EV registrations in 2020 (IEA, 2021a).
7China is a signatory of EV30at30 campaign, launched at the eighth Clean Energy Ministerial Meeting, and has announced that its new EV sales will account for 20% of its total sales by 2025 (State Council of China, 2020). Our results show that China can achieve this target in the baseline and optimistic scenarios.
8In China, the installed battery capacity of TLIBs was 74.3 GWh in 2021, while that of LFP batteries was 79.8 GWh.
Alves Dias, P., Blagoeva, D., Pavel, C., and Arvanitidis, N. (2018). Cobalt: Demand-Supply Balances in the Transition to Electric Mobility, 10. European Commission, Joint Research Centre. EUR-Scientific and Technical Research Reports Publications Office of the European Union, 97710. doi:10.2760/97710
Azevedo, M., Campagnol, N., Hagenbruch, T., Hoffman, K., Lala, A., and Ramsbottom, O. (2018). Lithium and Cobalt-A Tale of Two Commodities.
Bass, F. M., Krishnan, T. V., and Jain, D. C. (1994). Why the Bass Model Fits without Decision Variables. Mark. Sci. 13, 203–223. doi:10.1287/mksc.13.3.203
Bass, F. M. (1969). A New Product Growth for Model Consumer Durables. Manag. Sci. 15, 215–227. doi:10.1287/mnsc.15.5.215
CAAM (2021). EV Sales Statistics. Available at: http://lwzb.stats.gov.cn/pub/lwzb/zxgg/202107/W020210723348607396983.pdf (Accessed April 10, 2021).
Chen, Z., Zhang, L., and Xu, Z. (2019). Tracking and Quantifying the Cobalt Flows in Mainland China during 1994-2016: Insights into Use, Trade and Prospective Demand. Sci. Total Environ. 672, 752–762. doi:10.1016/j.scitotenv.2019.02.411
Fu, X., Beatty, D. N., Gaustad, G. G., Ceder, G., Roth, R., Kirchain, R. E., et al. (2020). Perspectives on Cobalt Supply through 2030 in the Face of Changing Demand. Environ. Sci. Technol. 54, 2985–2993. doi:10.1021/acs.est.9b04975
Hsieh, I.-Y. L., Pan, M. S., and Green, W. H. (2020). Transition to Electric Vehicles in China: Implications for Private Motorization Rate and Battery Market. Energy Policy 144, 111654. doi:10.1016/j.enpol.2020.111654
Huang, X., and Ge, J. (2019). Electric Vehicle Development in Beijing: An Analysis of Consumer Purchase Intention. J. Clean. Prod. 216, 361–372. doi:10.1016/j.jclepro.2019.01.231
IEA (2020). The Global EV Outlook (2020). Available at: https://www.iea.org/reports/global-ev-outlook-2020 (Accessed January 24, 2022).
IEA (2021a). The Global EV Outlook (2021). Available at: https://www.iea.org/reports/global-ev-outlook-2021 (Accessed January 17, 2022).
IEA (2021b). The Role of Critical Minerals in Clean Energy Transitions. Available at: https://www.iea.org/reports/the-role-of-critical-minerals-in-clean-energy-transitions (Accessed January 27, 2022).
Jones, B., Elliott, R. J. R., and Nguyen-Tien, V. (2020). The EV Revolution: The Road Ahead for Critical Raw Materials Demand. Appl. Energy 280, 115072. doi:10.1016/j.apenergy.2020.115072
Kim, I. G. (2021). Race to Produce High-Nickel Batteries Accelerates. Available at: https://www.kedglobal.com/newsView/ked202110170001 (Accessed February 4, 2022).
Li, X.-Y., Ge, J.-P., Chen, W.-Q., and Wang, P. (2019). Scenarios of Rare Earth Elements Demand Driven by Automotive Electrification in China: 2018-2030. Resour. Conserv. Recycl. 145, 322–331. doi:10.1016/j.resconrec.2019.02.003
Liu, W., Liu, W., Li, X., Liu, Y., Ogunmoroti, A. E., Li, M., et al. (2021). Dynamic Material Flow Analysis of Critical Metals for Lithium-Ion Battery System in China from 2000-2018. Resour. Conserv. Recycl. 164, 105122. doi:10.1016/j.resconrec.2020.105122
Massiani, J., and Gohs, A. (2015). The Choice of Bass Model Coefficients to Forecast Diffusion for Innovative Products: An Empirical Investigation for New Automotive Technologies. Res. Transp. Econ. 50, 17–28. doi:10.1016/j.retrec.2015.06.003
Meade, N., and Islam, T. (2006). Modelling and Forecasting the Diffusion of Innovation - A 25-year Review. Int. J. Forecast. 22, 519–545. doi:10.1016/j.ijforecast.2006.01.005
Olivetti, E. A., Ceder, G., Gaustad, G. G., and Fu, X. (2017). Lithium-Ion Battery Supply Chain Considerations: Analysis of Potential Bottlenecks in Critical Metals. Joule 1, 229–243. doi:10.1016/j.joule.2017.08.019
Ou, S., Hsieh, I.-Y. L., He, X., Lin, Z., Yu, R., Zhou, Y., et al. (2021). China's Vehicle Electrification Impacts on Sales, Fuel Use, and Battery Material Demand through 2050: Optimizing Consumer and Industry Decisions. Iscience 24, 103375. doi:10.1016/j.isci.2021.103375
SAE-China (2016). Technology Roadmap for Energy Saving and New Energy Vehicles. Beijing: China Machine Press.
SAE-China (2021). Technology Roadmap for Energy Saving and New Energy Vehicles 2.0. Beijing: China Machine Press.
Seck, G. S., Hache, E., and Barnet, C. (2022). Potential Bottleneck in the Energy Transition: The Case of Cobalt in an Accelerating Electro-Mobility World. Resour. Policy 75, 102516. doi:10.1016/j.resourpol.2021.102516
Shi, Q., Sun, X., Xu, M., and Wang, M. (2022). The Multiplex Network Structure of Global Cobalt Industry Chain. Resour. Policy 76, 102555. doi:10.1016/j.resourpol.2022.102555
Simon, B., Ziemann, S., and Weil, M. (2015). Potential Metal Requirement of Active Materials in Lithium-Ion Battery Cells of Electric Vehicles and its Impact on Reserves: Focus on Europe. Resour. Conserv. Recycl. 104, 300–310. doi:10.1016/j.resconrec.2015.07.011
Srinivasan, V., and Mason, C. H. (1986). Technical Note-Nonlinear Least Squares Estimation of New Product Diffusion Models. Mark. Sci. 5, 169–178. doi:10.1287/mksc.5.2.169
State Council of China (2020). New Development Plan for NEVs Unveiled. Available at: http://english.www.gov.cn/policies/latestreleases/202011/02/content_WS5f9ff225c6d0f7257693ece2.html (Accessed December 10, 2020).
Sun, X., Shi, Q., and Hao, X. (2021). Supply Crisis Propagation in the Global Cobalt Trade Network. Resour. Conserv. Recycl. 179, 106035. doi:10.1016/j.resconrec.2021.106035
Tang, C., Sprecher, B., Tukker, A., and Mogollón, J. M. (2021). The Impact of Climate Policy Implementation on Lithium, Cobalt and Nickel Demand: The Case of the Dutch Automotive Sector up to 2040. Resour. Policy 74, 102351. doi:10.1016/j.resourpol.2021.102351
USGS (2021). Mineral Commodity Summaries 2021. Reston, VA: U.S. Geological Survey. doi:10.3133/mcs2021
Wang, Y., and Ge, J. (2020). Potential of Urban Cobalt Mines in China: An Estimation of Dynamic Material Flow from 2007 to 2016. Resour. Conserv. Recycl. 161, 104955. doi:10.1016/j.resconrec.2020.104955
Xu, C., Dai, Q., Gaines, L., Hu, M., Tukker, A., and Steubing, B. (2020). Future Material Demand for Automotive Lithium-Based Batteries. Commun. Mater. 99, 1. doi:10.1038/s43246-020-00095-x
Xue, L., Jin, Y., Yu, R., Liu, Y., and Ren, H. (2019). Toward Net Zero Emissions in the Road Transport Sector in China. Beijing, China: World Resources Institute.
Zeng, X., and Li, J. (2015). On the Sustainability of Cobalt Utilization in China. Resour. Conserv. Recycl. 104, 12–18. doi:10.1016/j.resconrec.2015.09.014
Keywords: bass model, China, cobalt, electric vehicles, scenario analysis
Citation: Shi Q (2022) Cobalt Demand for Automotive Electrification in China: Scenario Analysis Based on the Bass Model. Front. Energy Res. 10:903465. doi: 10.3389/fenrg.2022.903465
Received: 24 March 2022; Accepted: 29 April 2022;
Published: 24 May 2022.
Edited by:
Weiqiong Zhong, Chinese Academy of Geological Sciences, ChinaReviewed by:
Meihui Jiang, Nanjing University of Information Science and Technology, ChinaCopyright © 2022 Shi. This is an open-access article distributed under the terms of the Creative Commons Attribution License (CC BY). The use, distribution or reproduction in other forums is permitted, provided the original author(s) and the copyright owner(s) are credited and that the original publication in this journal is cited, in accordance with accepted academic practice. No use, distribution or reproduction is permitted which does not comply with these terms.
*Correspondence: Qing Shi, c2hpcWluZ0BzenUuZWR1LmNu
Disclaimer: All claims expressed in this article are solely those of the authors and do not necessarily represent those of their affiliated organizations, or those of the publisher, the editors and the reviewers. Any product that may be evaluated in this article or claim that may be made by its manufacturer is not guaranteed or endorsed by the publisher.
Research integrity at Frontiers
Learn more about the work of our research integrity team to safeguard the quality of each article we publish.