 Jun Xiao
 Zihan Lv
 Guoqiang Zu
 Chenhui Song
- 1Key Laboratory of Smart Grid of Ministry of Education, Tianjin University, Tianjin, China
- 2State Grid Tianjin Electric Power Research Institute, Tianjin, China
- 3State Grid Energy Research Institute, Beijing, China
This study proposes a new feeder link planning method for the distribution network, which can improve total supply capability (TSC). Feeder links are the key component of distribution networks. They are of great significance to the TSC of the distribution network. Therefore, it is necessary to reveal the influence rules of feeder links on TSC and then apply the rules in distribution network planning. First, the indices describing the position, scale, and efficiency of feeder links are defined. Second, the influence rules of feeder links on TSC are revealed. 1) When the feeder geometrical distribution is more balanced, the TSC is higher. 2) When the feeder link scale is larger, the TSC is higher. While for both (1) and (2), the TSC will remain unchanged after reaching a certain value. 3) There always exists an optimal construction order of feeder links, which can ensure the TSC is as high as possible in each planning stage. Third, based on the rules, a model and an algorithm of the feeder link planning are proposed. The method can find an optimal construction order of feeder links, which can ensure that the value of TSC is as high as possible in each feeder link planning stage. Finally, the proposed method is verified on an 8-substation-transformer case grid, which has shown that the proposed method has advantages in feeder link efficiency and feeder-distribution balancing, and especially the TSC can be improved in each planning stage than the traditional methods.
1. Introduction
A distribution network is directly linked to consumers, which is an important part of the distribution system. Also, distribution network planning has a very important impact on the security and reliability of the power system. As a channel of load transfer, feeder links play a key role in improving the reliability and flexibility of power supply capability.
A feeder link planning can not only ensure the N-1 security criterion of the distribution network but also can improve the utilization rate of the equipment. The most important point is that the planning of feeder links can improve the total supply capability (TSC). When the capacity and number of substation transformers are given, the TSC is determined by the structure of feeder links, which means that the TSC can be maximized by optimizing the feeder links. The optimal feeder construction order can be obtained by solving the optimal balanced degree of the feeder geometrical distribution. The TSC will be the largest during the optimal feeder construction process. Therefore, a distribution network structure can be optimized to improve the maximum total supply capacity. There are many advantages of using feeder link planning for distribution network optimization, such as improving the flexibility and reliability of power supply capability. This is because feeder link optimization is more flexible than substation optimization. Therefore, it is necessary to research the feeder link planning of the distribution network.
TSC is an important index representing the security and efficiency of a distribution network. TSC is defined as the maximum load that a distribution network can serve, which satisfies the N-1 security criterion (Xiao B. et al., 2017). At present, the research about TSC has involved the definition (Guo et al., 2018), index (Xiao et al., 2017b), modeling (Mu and Liu, 2018; Xiao et al., 2021), algorithm (Ge et al., 2011; Zhang et al., 2020), and application (Zhang et al., 2017; Sun et al., 2018; Xiao et al., 2020) of TSC. The main influence factors of TSC include the capacity and number of substation transformers, feeder capacity, and how the feeders link with each other. In the planning stage of a distribution network, the substation transformer capacity, number of substations, and feeder capacity are determined by planning guidelines, which means that their adjustable ranges are limited. However, the adjustment range of the feeder link is large, which means that the feeder link is the key factor to influence TSC. By optimizing the feeder link, the value of TSC can be maximized without increasing the capacity of the substations.
The existing research on feeder link planning targeting TSC is as follows: Xiao et al. (2012) and Xiao et al. (2016) proposed to improve the TSC to meet the increased load demand by planning the feeder link of the distribution network initially and then considered constructing new substations to absorb new loads. Ge et al. (2007) planned the optimal feeder link channel between substation transformers based on the TSC calculation method. Han et al. (2013) carried out the multi-objective link structure planning between substation transformers for the maximum total supply capacity, the smallest number, and the shortest length of feeder link channels, which also considered the actual location of the substation. Ge et al. (2014) calculated the cost of power supply capability and selected the optimal scheme for the feeder link structure. A multi-stage and multi-load-scenario active distribution network expansion planning model was proposed, which considered the applications of new distributed generation and construction of feeders at the planning level (Shen et al., 2018), and maximum TSC can be achieved by planning feeder links. In the study by Verma and Swarup (2017), the optimal feeder link placement problem was solved by focusing on the minimization of penalties incurred by the distribution network, and optimal feeder link location was found by a fundamental loop-based algorithm. The length upper limit estimation method for the optimal planning scheme feeder link is proposed to considerably reduce the search range of the optimal feeder link planning scheme (Hou et al., 2019). In the study by Xiao et al. (2017c), a planning model of link structure among substation transformers based on Pareto optimal was proposed. Meanwhile, the optimal load distribution of the distribution network is obtained by using the feeder load balancing model. A multi-objective planning model of the link structure considering the TSC and the minimum link cost, which is influenced by geographical factors, was established. A planning model based on feeder corridors was proposed to generate a network with minimal investment cost while meeting the specific reliability requirement (Li et al., 2020). Bosisio et al. (2020) addressed the problem of optimally re-routing the feeders of the urban distribution network in Milano, Italy, and also presented a mixed-integer programming approach for the design of a new network configuration satisfying the so-called 2-step ladder layout required by the planner. A novel method to determine the optimal routing of medium-voltage distribution networks in sparse rural areas was presented, and the optimization model was applied to a real rural distribution network in the South–West region of western Australia (Fletcher et al., 2018). A model that can supply the optimal feeder locations and feeder switch types was presented by Jooshaki et al. (2021), which improved the calculation efficiency of complex distribution networks. Shahbazi et al. (2021) presented a planning model for the natural disaster situation, which can minimize the total cost while maintaining the stable operation of the power grid in extreme weather. Mehrtash et al. (2019) presented a transmission expansion planning (TEP) algorithm, which considered the region’s characteristics and feeder-link flow with its neighbors. A planning method considering distribution automation functions was developed (Heidari et al., 2015), which used the genetic algorithm to solve the optimization problem.
Most studies are conducive to revealing the mechanism and modeling of the distribution network. However, some basic issues such as searching the roles of TSC in different feeder link positions and the influence of construction order for feeder links on TSC were still not discussed. The real planning is divided into several stages: there are no feeder links at the early construction stage. Then, with the development of the city, the reliability requirements get higher, and the feeder link is gradually established. But, it is impossible and unnecessary to build all feeder links at once. The construction order is the order that feeders be constructed one by one. How to find the best construction order of feeder links that can improve the TSC needs to be solved.
In order to solve the abovementioned problems, this study reveals the influence rules of feeder links on the TSC. By applying the abovementioned rules, a planning method of the optimal construction order for feeder links is proposed. The planning of a distribution network is carried out in several stages, and the construction order for feeder links can arrange the feeder link position and feeder capacity one by one. The effectiveness of the proposed method in this study is verified by comparing it with traditional methods.
2. Definitions
In this section, the definitions and indices of feeder links are discussed. Some related definitions of supply capability such as substation supply capability (SSC), network transfer capability (NTC), expandable supply capability (ESC), and maximum supply capability (MSC) are detailed in Supplementary Appendix SA.
The distribution network in this study is simplified to a geometrical figure to observe the feeder link position easily. The comparison between the original figure and the simplified figure is shown in Figure 1.
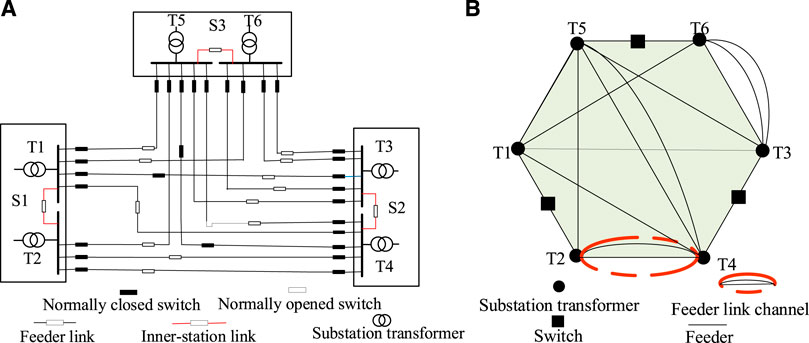
FIGURE 1. Contrast of the original figure and the simplified figure. (A) Original figure. (B) Simplified figure.
The feeder link is composed of the normally open switch and short lines on both sides of the switch.
2.1 Definitions of feeder links
Definition 1. Feeder F: The line which makes a substation transformer link with itself or another transformer.All the feeders between the substation transformer Ti and Tj are equivalent to each other and denoted as Fij. The feeder capacity is denoted by RF, and the feeder link scale is denoted by M, which represents the number of feeders in a distribution network.
Definition 2. Feeder link channel L: The collection of all feeders between two substation transformers. The feeder link channel between substation transformers Ti and Tj is represented by Lij. The scale of the feeder link channel is denoted by N.
Definition 3. Single link: Two feeders are only linked by one link.
Definition 4. Full link: All substation transformers are linked.
Definition 5. Inner-station link: Link between the substation transformers of the same substation.
Definition 6. Feeder links: Two or more feeders are linked through the interconnection switch.
2.2 Definitions of the feeder link position
Definition 7. Feeder link position x: The position of the feeder link between substation transformers Ti and Tj is represented by x(i, j).
Definition 8. Balanced degree of feeder geometrical distribution BD: The matching degree between the number of feeders in one feeder link channel and the average capacity of substation transformers. The calculation steps of BD are as follows:The averaged capacity Rij (1/2) of substation transformers at both ends of the feeder link channel is calculated as follows:
The link reference degree (k) is calculated as follows:
The link reference difference (D) is calculated as follows: The number of linked feeders in the feeder link channel Lij is assumed to be Xij:
Corresponding to the asymmetric feeder distribution, it is easy to find the largest Ds, which is recorded as Dsmax.
BD ∼ (0, 1), when the distribution of feeder links is balanced, BD approaches 1; when the distribution of feeder links is uneven, BD approaches 0.
Definition 9. Feeder link efficiency TCUL: The averaged network transfer capacity (ANTC) is brought by each feeder link, while the averaged network transfer capacity means that the average amount of the TSC increased by interconnections:
3 Influence of feeder links on total supply capability
In this section, the influence of feeder links on the TSC is discussed, which mainly considers the following four key aspects: feeder link position, balanced degree of feeder geometrical distribution, feeder link scale, and different construction orders.
Another four comparative cases and the theoretical analysis of 3.1–3.4 are added in Supplementary Appendix SC, which can prove the obtained conclusions in Section 3.
3.1 Influence of feeder geometrical distribution on total supply capability
The basic parameters of case 1 are shown in Supplementary Appendix Table SB1. The capacity of all substation transformers is 40 MVA, and the capacity of feeders is 9 MVA. Every substation transformer has seven feeders each.
It can be seen from Figure 2 that the number of feeders of (A) is 12, which is the same as that of (B), but the feeder geometrical distribution is different. The feeder distribution in (A) is symmetric, while feeders in (B) are concentrated on a few nodes. When the number of feeders between substation transformers is more evenly distributed, the geometric distribution is more balanced. For example, BD(A) = 1 and BD(B) = 0.738, Figure 2A is more balanced than Figure 2B. The feeder link channel scale N is also different while N(A) = 12 and N(B) = 4. The TSC(A) = 135MVA and TSC(B) = 134 MVA. The detailed model, steps, and codes for calculating the TSC can be seen in Supplementary Appendix SD. Thus, when the feeder geometrical distribution is more balanced, the TSC is higher.
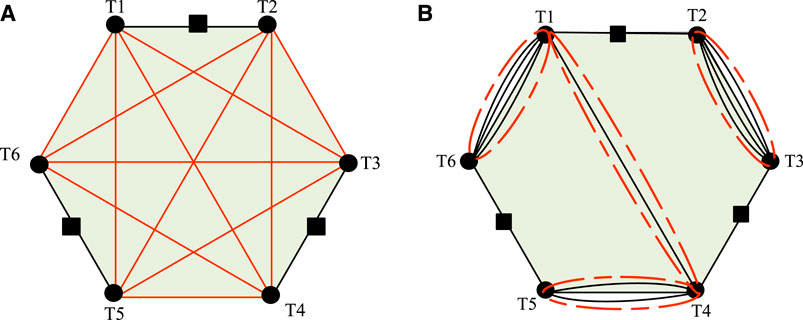
FIGURE 2. Two different feeder link topologies of the distribution network of case 1. (A) Balanced geometric distribution; (B) is unbalanced geometric distribution.
3.2 Influence of balanced degree of feeder geometrical distribution on total supply capability
The basic parameters of case 2 are shown in Supplementary Appendix Table SB2. The capacity of substation transformers of S1, S2, S3, and S4 is as follows: 31.5MVA, 40 MVA, 40 MVA, and 63MVA, respectively. All feeder capacity is 8.92 MVA. Every substation transformer has nine feeders.
Under the same feeder link scale, 15 different feeder distribution modes are selected, and then TSC and BD are calculated. The rule of TSC increasing with BD is shown in Figure 3.
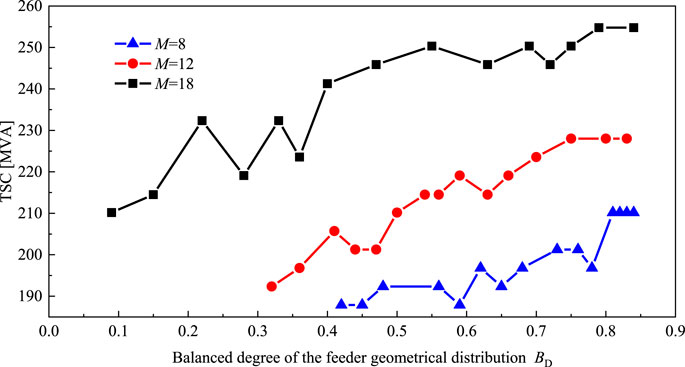
FIGURE 3. Relationship between TSC and balanced degree of feeder geometrical distribution (BD) in the same feeder link scale of case 2.
It can be seen from Figure 3 that if BD reaches the maximum, the TSC reaches the maximum value at the same time. The three curves in Figure 3 reveal the common rule: when BD is larger than 0.8, the TSC remains unchanged after reaching the maximum value. To be consistent with the planning principles and practical experience, the substation transformer with a large capacity should provide more feeders. It can be seen from the abovementioned cases that the balanced degree of feeder geometrical distribution and TSC need not be strictly positively correlated.
3.3 Influence of feeder link scale on total supply capability
The feeder link scale is directly related to the complexity of the distribution network. It can be inferred from the last section that if the link grows with the maximum BD, the TSC will increase fastest throughout the process. Therefore, the relation of TSC, TCUL, and M should be researched with the feeder link position remaining optimal. Using basic parameters of case 2, different feeder capacities are selected to form case 3. The relationship curves of TSC, TCUL, and M under three different feeder capacity RF are shown in Figure 4.
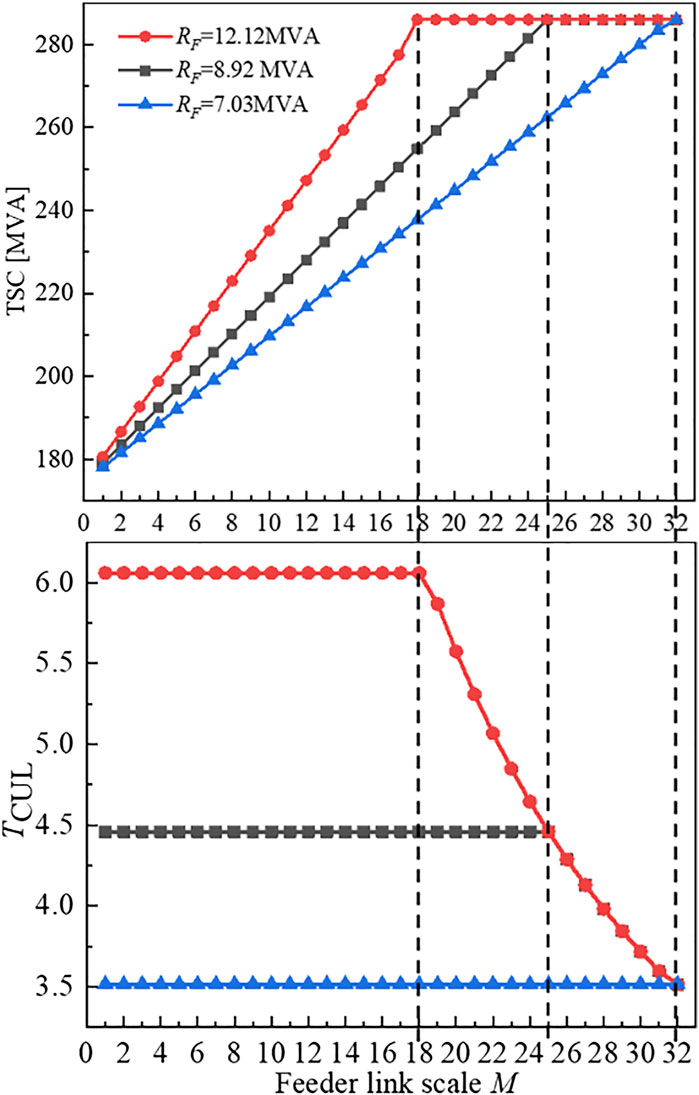
FIGURE 4. Relation of TSC, transfer capability provided by unit feeder link (TCUL), and feeder link scale (M) of case 3.
The feeder capacity RF keeps the same in one process. It can be seen from the three curves in Figure 4:
(1) When feeder link positions maintain optimal positions, TSC increases linearly and TCUL maintains the maximum value, which is half of the feeder capacity (0.5RF). This is because the feeder link scale is small in the early construction stage. During this stage, TSC is only limited by the feeder capacity.
(2) When the feeder link scale reaches a certain value, TSC remains unchanged and TCUL continues to decrease. This is because TSC has reached MSC, so the subsequent feeder links are all invalid links that do not contribute to TSC.
(3) When the TSC approaches the maximum value, the contribution of the unit feeder link to TSC and the corresponding TCUL is reduced. This is because the difference between MSC and TSC is less than 0.5RF, and the increase of NTC brought by a single feeder link does not exceed 0.5RF.
(4) When RF = 7.03MVA, TSC reaches MSC when M is 32. If RF continues to decrease, MSC cannot be reached by a single link alone. This is because RF is too small, so the capacity of the substation transformer cannot be fully used by feeder links.
3.4 Influence of different construction orders on total supply capability
The construction order of feeder links refers to different schemes for the growth of feeder links in the distribution network, which includes two key factors: feeder link position and feeder link scale. The varied position and scale of feeder links lead to different construction orders and have diverse impacts on TSC. A suitable feeder link construction order can improve the value of TSC.
Using the basic parameters of case 2, five feeder link construction orders are selected to form case 4. Order 1, Order 2, Order 3, Order 4, and Order 5 (Table 1) for comparison are as follows.
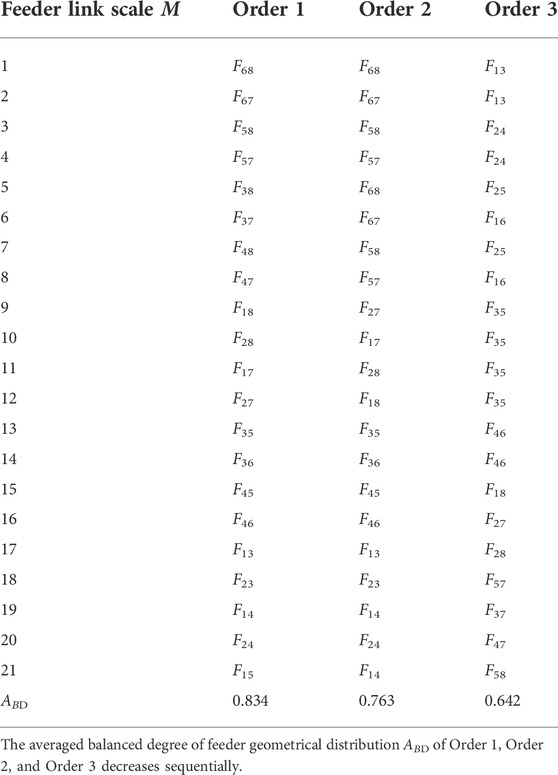
TABLE 1. Construction orders of feeder links of case 4.
Supplementary Appendix Table B3 is the construction orders of feeder link channels which correspond to the construction orders of feeder links in Table 1.
Figure 5 shows the increasing trend of TSC with M under three different construction orders of feeder links.
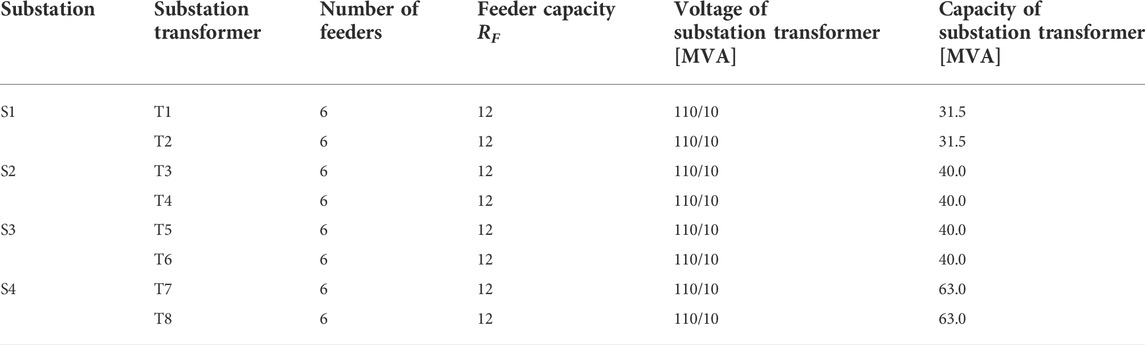
TABLE 2. Basic parameters of case 5.
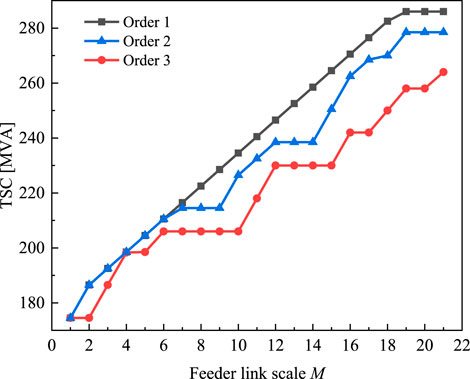
FIGURE 5. Increasing trend of TSC in different construction orders of case 4.
It can be seen from Figure 5:
(1) The TSC of Order 2 grows linearly in the early stage. Starting from one feeder, the growth rate slows down. This is because TSC is mainly limited by the feeder capacity at the early stage, which is finally limited by both feeder capacity and substation transformer capacity.
(2) There is a bottleneck stage in the middle of the construction stage in Order 3. This is because the feeder link position is not suitable in the early construction stage, which leads to several invalid links in the midterm.
(3) The black TSC curve Order 1 is superior to others, which indicates that the value of TSC keeps the largest among all orders at any time. It also shows that there always exists a construction order which can improve the TSC in the whole construction stage.
4 Application in the distribution network planning
In this section, the application of construction orders of the feeder links on TSC is discussed, which mainly considers the following three key aspects: definition, mathematical model, and an algorithm that can improve the TSC. The details are described as follows.
4.1 Definition of optimal construction order of feeder links
This study assumes that only one feeder can be constructed at a given period in the feeder link construction. Then, the distribution network will get a new TSCm after the construction of Fm. The position xm with the largest TSCm can be defined as the optimal position of Fm.
If each feeder chooses its best position, then the corresponding M is the optimal feeder link scale Mopt, which means that TSC also reaches MSC at this time. The TSCm maintains a maximized value throughout the process, while TCUL will also maintain the maximized value at the same time.
Definition 10. Optimal construction order of the feeder links: it means the construction order that TSC maintains the maximum at any stage and reaches MSC, while the total feeder link scale is the smallest. It is a set of number pairs with finite lengths, such as Eq. 8.
where (x1,RF1),…, (xMopt, RFMopt) are the feeder position and feeder link capacity in time order, and the length of pairs is Mopt.
Definition 11. Construction stage: stages of the distribution network when feeder links grow.In practice, the planning of the feeder link construction order is constructed in stages. Each stage constructs a set of feeder links. After the feeder link construction is completed in one stage, the TSC reaches the maximum value in the current situation, for example, when the construction process needs to be divided into three stages such as a, b, and c, and Ma + Mb + Mc = Mopt. The result of Eq. 8 can be obtained and then divided into stages I ∼ III, such as Eq. 9.
4.2 Mathematical model of optimal construction order for feeder links
It can be seen from Section 3 that an optimal feeder link construction order exists in all the construction order schemes. In this order, the TSC at any stage of the feeder construction is greater than that of the other orders. In short, the feeder link construction order is to arrange the position of the feeder link one by one. When the position of each feeder is the best, the linear increase of TSC is the fastest. When the BD value is the largest, the construction position of the feeder link is the best.
Therefore, the objective function in the mathematical model reflects that the maximum TSC can be obtained by choosing the positions of the feeder links.
4.2.1 Original model
A mathematical model is established to solve the problems of optimal construction order at first. The essence of the construction order for feeder links is to arrange the feeder link position and feeder capacity one by one, which also makes sure that TSC keeps the maximum throughout the process. Also, the construction is stopped when TSC reaches MSC. The mathematical model is shown as Eq. 10.
where TSCm is the value of TSC after constructing the mth feeder Fm; fTSC is the calculation method of TSCm; xm (i, j) is the position of the feeder Fm; RFm is the capacity of the feeder Fm; Ω is the set of all (i, j); texist(i) is the number of the feeders from the substation transformer Ti after adding feeder Fm; tmax(i) is the maximum number of feeders of the substation transformer Ti; Rfeeder(i) is the feeder capacity of substation transformer Ti; Cm is the cost of the mth feeder; Lm is the length of the feeder Fm; and Clim is the total budget for feeder link construction.
4.2.2 Simplified model
This study focuses on the influence of TSC on the distribution network, so model (4) is simplified
The capacity of all feeders is equal. At this time, RF = Rfeeder and TSCm are also simplified to be determined only by the position of Fm. It is assumed that the length of all feeders is the same as the constant L0. There is no strict limit on the total cost, so we assume that Clim = ∞.
The simplified model is shown in Eq. 11:
The corresponding result is also reduced to Eq. 12 by Eq. 8:
4.3 Algorithm of optimal construction order of feeder links
TSC reaches its largest value when BD reaches the maximum. Therefore, the optimal construction position of the feeder links is the position that makes BD reach the maximum value.
Therefore, the goal “to solve the total supply capacity (TSC) of each construction stage” is transformed into “to solve the maximized balanced degree of feeder geometrical distribution.”
The algorithm process includes three steps: 1) calculating the value of ESC (AESC); 2) using AESC to calculate Mopt; and 3) using Mopt to prepare for the calculation of BD. Different feeders are added and search for the largest BD is carried out. Then, the optimal construction order of feeder links is obtained.
4.3.1 Calculation of the value of ESC
Expanded supply capacity (ESC) is the basis for calculating the Mopt. The calculation process includes three steps:
(1) Calculate AMSC: AMSC is the value of MSC. MSC is the TSC of a system when it is fully linked. A fully linked distribution system means that every substation transformer has interconnection with all the other transformers in the system. A full-link matrix means the elements of the matrix are all 1. Therefore, AMSC can be realized by setting the feeder link matrix as a full-link matrix and when the feeder capacity is infinite. Then, input the full-link matrix into the TSC model in Lingo for calculation. The codes in Lingo can be seen in Supplementary Appendix SD.
(2) Calculate ASSC: ASSC is the value of SSC. SSC is the TSC of the system at its lowest level, which means every substation transformer has no connection (through normally open switches) with other substation transformers. Therefore, ASSC can be realized by deleting all inter-station links and then putting the inner-station link matrix into the TSC model in Lingo for calculation.
(3) Calculate AESC:
4.3.2 Calculation of the optimal feeder link scale
The optimal feeder link scale Mopt is the basis for calculating BD, and the calculation process is as follows:
Under the premise of maintaining the optimal feeder link position, TSC increases linearly, while TCUL maintains the maximum 0.5RF. The optimal feeder link scale Mopt can be calculated in advance:
where X is the calculated result. If X is not an integer, Mopt = [X]+1, [X] is the integer part of X. If X is an integer, then Mopt = X. The Mopt is obtained based on the feeder link position x and remains optimal in the whole process.
4.3.3. Calculation of optimal construction order of feeder links
After obtaining Mopt, the process of solving the optimal construction order is as follows:
(1) The total number of feeder link positions outside the station is calculated: If the number of substation transformers in the distribution network is nx, the total number of feeder link positions nmax is calculated by Eq. 15, where
(2) The averaged capacity of the substation transformer is calculated at both ends of the channel R (1/2) and the link reference degree k. The details are attached in Definition 8, chapter 2.2.
(3) The first feeder F1 (m = 1) is added and all possible feeder link positions are calculated: x (i1, j1),…,x (inmax, jnmax). Then, the corresponding BD (i1, j1),…,BD (inmax, jnmax) is obtained.
(4) The maximum value of BD in 3) is recorded. The corresponding x1 (i, j) is the optimal construction position of F1.
(5) Set m = 2, repeat steps 3) to 4). The process stopped when m > Mopt, and the order x1 (i, j),…,xMopt (i, j) is the optimal construction order.
The calculation process of the optimal construction order of feeder links based on TSC is shown in Figure 6.
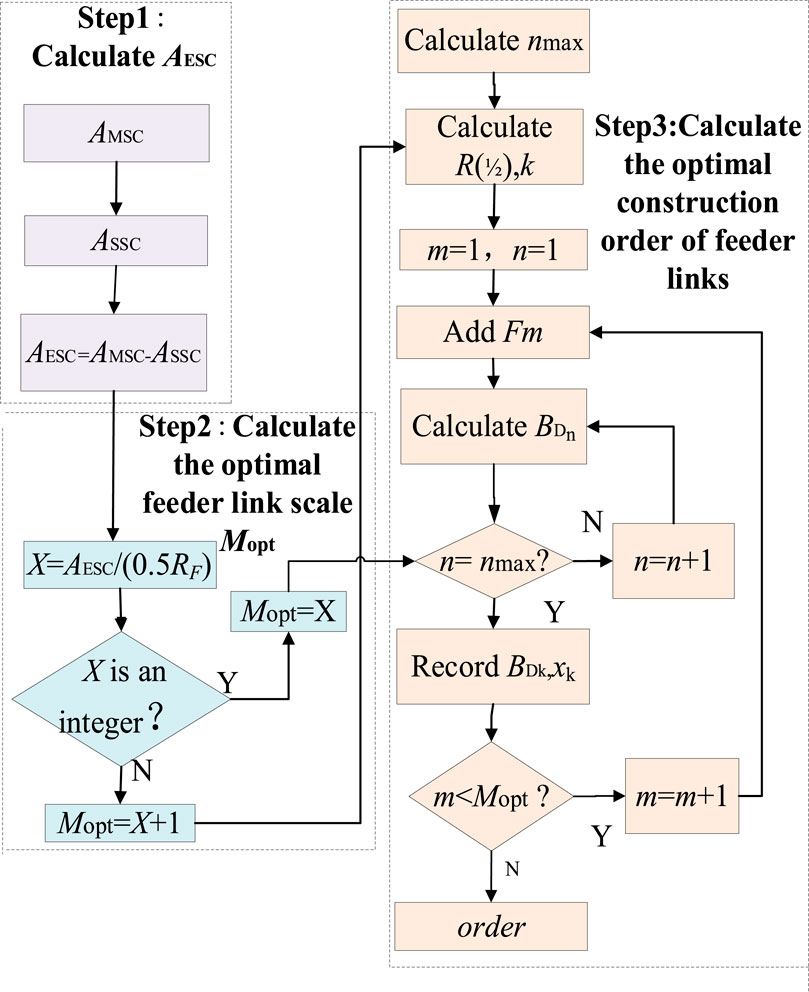
FIGURE 6. Flow chart of the algorithm to the optimal construction order of feeder links.
Figure 6 will obtain the most efficient construction order of feeder links, which will result in the fastest TSC increase. This is because every feeder is constructed in the best order so that the value of TSC can be improved in the whole construction stage.
5 Case verification
In this section, the proposed method is verified by case 5. Also, how the proposed planning method improves TSC is also shown by comparison with the backward-optimization method.
5.1 Case grid information
The grid structure of case 5 is shown in Figure 7. The maximum number of feeders from a substation transformer is six. The feeder capacity is 12 MVA, and the number of total feeders is 48. The voltage of the four substations is 110/10 kV, and the total substation transformer capacity is 349 MVA.
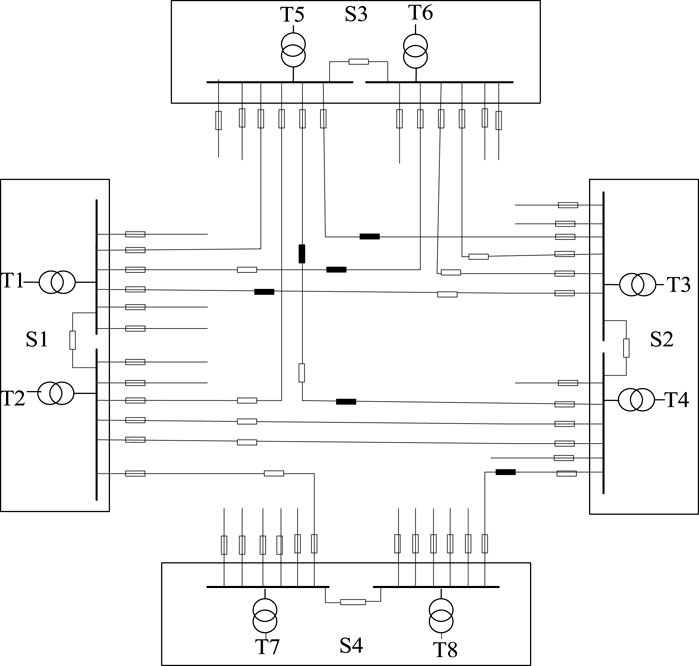
FIGURE 7. Illustration of case 5. The basic parameters are shown in Table 2.
This study researches the construction process of feeder link growth from zero, and the construction order of feeder links is diverse. Therefore, Figure 7 only shows a general situation of the feeder link increasing: 12 feeders have been built, which belong to the middle construction stage. There is still potential for additional feeder links to improve the TSC.
5.2 The optimal construction order of feeder links
Step 1. Calculate AESC:
(1) Calculate AMSC = 286 MVA
(2) Calculate ASSC = 174.5 MVA
(3) Calculate AESC = AMSC-ASSC = 111.5 MVA
Step 2. Calculate Mopt:
After taking the integer part, X is 19.
Step 3. The preparatory work for the calculation of BD.
(1) The calculated total number of feeder link positions is 24. Therefore, there are 24 types of feeder link positions.
(2) The calculated results of the average capacity of Ti and Tj (R(1/2)) and link reference degree k are shown in Supplementary Appendix Table B4.
Because the feeder link position corresponds to the feeder link channel, so the R(1/2), k of Lij are the same as that of x (i, j).Step 4. Start from the first feeder F1 (m = 1) and then traverse 24 feeder link positions. The values of BD can be obtained, as shown in Supplementary Appendix Table B5. The largest BD (0.919) corresponding to the feeder link position x1(6, 8) is the optimal construction position of the first feeder. Then, let m = 2 and continue to increase until m > 19 and stop.After the four steps, we obtain the optimal construction order of feeder links, which is shown in Table 3.
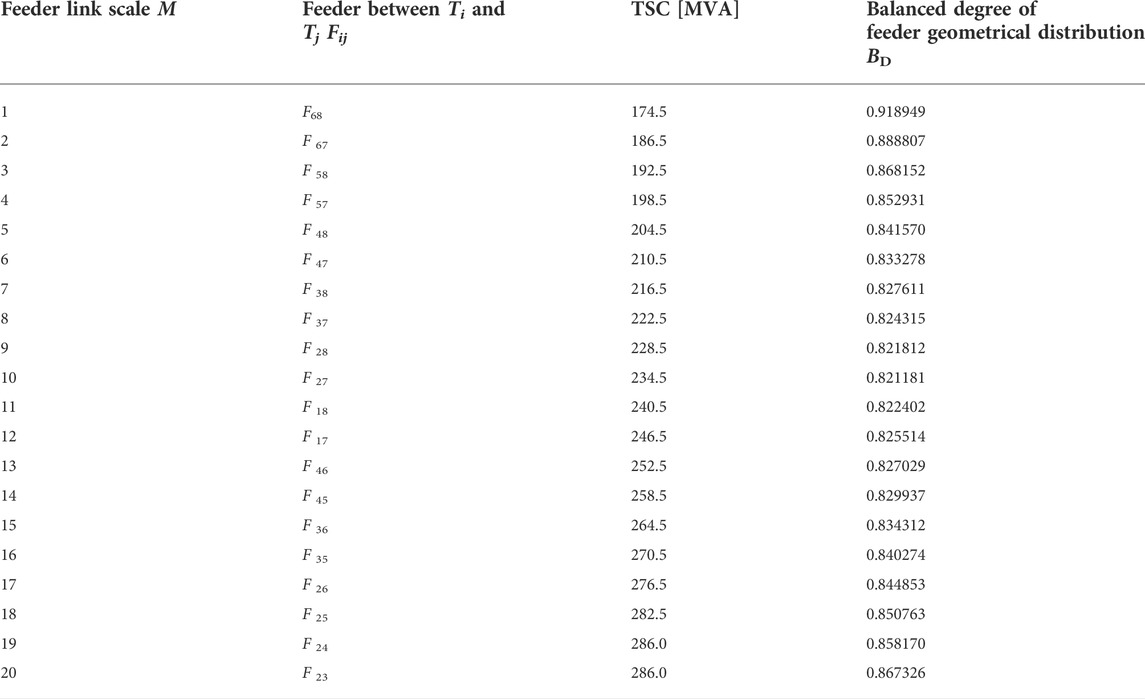
TABLE 3. Optimal construction order of feeder links of case 5.
5.3 Result verification
According to Table 3, under the optimal construction order, the trend of TSC when M varies is illustrated in Figure 8.
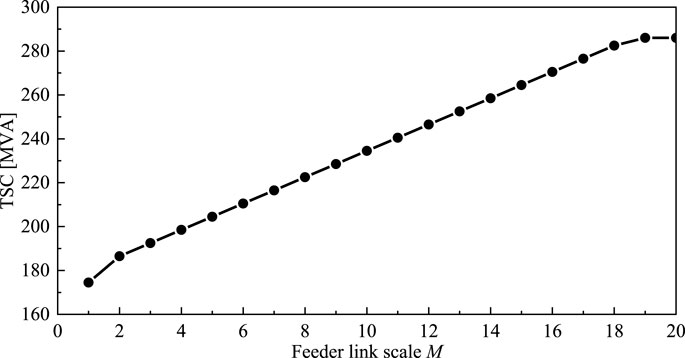
FIGURE 8. TSC increase with feeder link scale (M) of optimal construction order of case 5.
Throughout the construction process, it can be seen from Figure 8 and Table 3 that the construction order planned in this study remains the maximum of the TSC. Also, it will finally reach the MSC. The TSC increases the fastest in the process. After the completion of the 19th feeder, the MSC = 286 MVA. Since the construction of F20, the TSC has not increased, which shows that the optimal feeder link scale is indeed 19 feeders. It verifies the optimal construction order planning method proposed in this study.
In actual planning, it is not suitable to establish feeder links between substation transformers that are far away. At this time, the grid can be divided into several small areas, and then the planning method of this article can be used in each area.
5.4 Comparison with traditional planning methods
The backward-optimization method (Ge et al., 2014) and the TSC-based planning method (Xiao et al., 2016) are traditional planning methods for the distribution network.
The backward-optimization method first establishes the full link matrix of all substation transformers and then calculates the maximum TSCmax. Second, it deletes the cross-link channels between substation transformers one by one and calculates the corresponding TSC. When the obtained TSC is the same as the TSCmax, the method continues to delete the cross-connection channel. If the obtained TSC becomes smaller, the matrix of the link channel before deletion is the optimal feeder link scheme.
The TSC-based planning method conducts the feeder distribution planning according to the actual distribution of the load. The proposed planning scheme is verified through the N-1 security criterion finally.
The planning results of case 5 using the backward-optimization method and the TSC-based planning method are compared in Table 4.
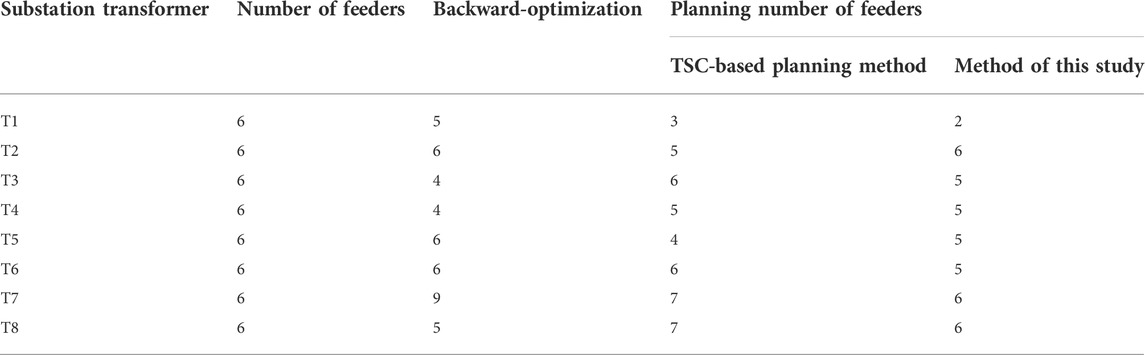
TABLE 4. Total data of feeder links of substation transformers.
A planning scheme is not feasible if the number of feeders from a substation transformer is greater than the allowable value. It can be seen from Table 4 that the feeder number of T7 in the backward-optimization method is 9, which is greater than the actual number of feeders 6. The feeder number of T7 and T8 in the TSC-based method is both 7, which is greater than the actual number of feeders 6. However, the results of the proposed method do not have this problem. In summary, the comparison results between the proposed method and the traditional methods are obtained as shown in Table 5.
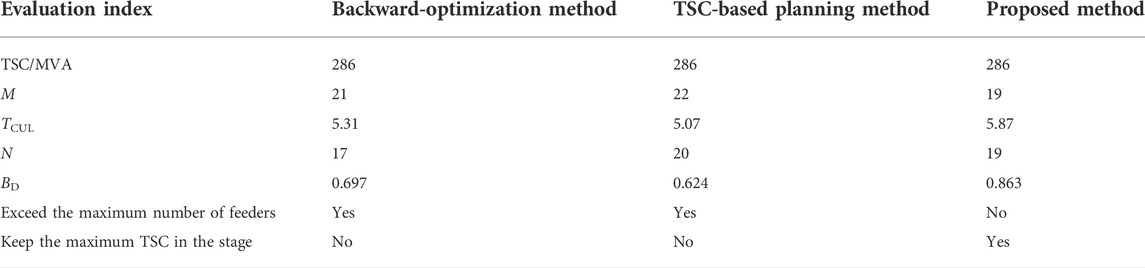
TABLE 5. Comparison of traditional methods and the proposed method.
It can be seen from Table 5:
(1) All methods can reach TSC of 286 MVA, but the feeder link scale of the proposed method is less than that of the traditional methods when they reach TSC. It is on the premise of ensuring the power supply capacity while saving funds for distribution network construction.
(2) The proposed method in this study can improve TSC, which means that the value of TSC maintains the maximum in all stages, but the traditional methods cannot. This is because the planning scheme of traditional methods does not specify the order of the feeder link construction, so they cannot guarantee that the TSC is maintained at the maximum in all stages.
(3) The distribution of feeder links is relatively unbalanced when it uses the traditional methods. This is because BD is 0.17 lower and 0.24 lower than the proposed method. Also, the corresponding feeder number from T7 and T7, T8 exceeds the allowable number, which does not meet the actual requirements. The method proposed in this study overcomes this shortcoming.
Traditional distribution network planning methods require more feeders to reach a certain level TSC, which will increase additional construction costs. However, it is very difficult to build new feeder corridors with the shortage of urban land-use planning. The proposed method in this study obtains the optimal feeder construction order by solving the optimal BD so that the TSC keeps the largest and the feeder link scale is the smallest during the feeder construction process. In summary, this study provides a new theoretical basis for optimizing the distribution network structure while saving construction funds.
Comparative references can be applied to fully constructed distribution network planning, while the proposed planning method in this study is mainly used for the planning of new or under-built power grids. It can be a new guidance for eliminating invalid feeder links of a fully constructed distribution network.
6 Conclusion
This study proposes a new feeder link planning method, which can improve the value of TSC as high as possible in each planning stage.
By defining the indices of the balanced degree of feeder geometrical distribution, feeder link efficiency, and feeder link position, the influence rules of feeder links on TSC are analyzed quantitatively. Based on the rules we discovered, the model and algorithm of the optimal construction order of feeder links have been proposed. The case study verifies the validity of the proposed method. The main conclusions are as follows:
(1) When the feeder geometrical distribution is more balanced, the TSC is higher. When the feeder link scale is larger, the TSC is higher. The TSC will remain unchanged after reaching a certain value.
(2) There always exists an optimal construction order of feeder links which can ensure that the TSC is as high as possible in each planning stage. The optimal order can be obtained by the optimization method based on the balanced degree of feeder geometrical distribution proposed in this study.
(3) Compared with the traditional backward-optimization method, the proposed method performs better planning schemes in the feeder link efficiency and feeder-distribution balancing, especially improving the TSC value in each planning stage.
This study reveals the relationship between TSC and distribution network topology, which lays a theoretical foundation for TSC-based distribution network planning.
Data availability statement
The original contributions presented in the study are included in the article/Supplementary Material. Further inquiries can be directed to the corresponding author.
Author contributions
JX: conceptualization, methodology, investigation, formal analysis, validation, resources, writing—review and editing, supervision, and project administration. ZL: conceptualization, methodology, investigation, software, validation, data curation, formal analysis, writing—original draft, visualization, and project administration. GZ: investigation, validation, formal analysis, writing—original draft, review and editing, and provide funding. CS: critical review and commentary.
Funding
This work was supported by the National Natural Science Foundation of China (52007130).
Conflict of interest
The authors declare that the research was conducted in the absence of any commercial or financial relationships that could be construed as a potential conflict of interest.
Publisher’s note
All claims expressed in this article are solely those of the authors and do not necessarily represent those of their affiliated organizations, or those of the publisher, the editors, and the reviewers. Any product that may be evaluated in this article, or claim that may be made by its manufacturer, is not guaranteed or endorsed by the publisher.
Supplementary Material
The Supplementary Material for this article can be found online at: https://www.frontiersin.org/articles/10.3389/fenrg.2022.903388/full#supplementary-material
References
BosisioBerizzi, A. A., Amaldi, E., Bovo, C., Sun, X., and Andy Sun, X. (2020). Optimal feeder routing in urban distribution networks planning with layout constraints and losses. MPCE 8, 1005–1013. doi:10.35833/MPCE.2019.000601
Fletcher, J. R. E., Fernando, T., Iu, H. H.-C., Reynolds, M., and Fani, S. (2018). Spatial optimization for the planning of sparse power distribution networks. IEEE Trans. Power Syst. 33, 6686–6695. doi:10.1109/TPWRS.2018.2846407
Ge, S., Han, J., and Liu, H. (2007). Optimization of contact structure among main transformer stations in regional power network based on power supply capability. Power Syst. Technol. 19, 98–104. doi:10.1097/00005792-197511000-00004
Ge, S., Han, J., Liu, H., Guo, Y., and Wang, C. (2011). Power supply capability determination considering constraints of transformer overloading and tie-line capacity. Proc. CSEE 31, 97–103. doi:10.1080/17415993.2010.547197
Ge, S., Zhang, K., Liu, H., and Han, J. (2014). Optimization of tie-lines structure among main transformer considering unit power supply cost. Automation Electr. Power Syst. 26, 23–28. doi:10.3969/j.issn.1003-8930.2014.08.005
Guo, Y., Liu, J., Wei, Z., Xu, L., Xiang, Y., and Sun, X. (2018). Load supply capability of distribution network. Electr. Power Autom. Equip. 38, 33–43. doi:10.16081/j.issn.1006-6047.2018.01.005
Han, J., Liu, H., and Ge, S. (2013). Optimization modeling for contact structure of main transformers between substations with improved power supply capability. Automation Electr. Power Syst. 37, 42–47. doi:10.7500/AEPS201208047
Heidari, S., Fotuhi-Firuzabad, M., and Kazemi, S. (2015). Power distribution network expansion planning considering distribution automation. IEEE Trans. Power Syst. 30, 1261–1269. doi:10.1109/TPWRS.2014.2339301
Hou, K., Jusong, R., Jia, H., Lei, Y., Choljun, R., Liu, X., et al. (2019). Optimal planning of urban distribution network tie-line with coordination of reliability and economics. J. Tianjin Univ. 52, 1294–1302.
Jooshaki, M., Karimi-Arpanahi, S., Lehtonen, M., Millar, R. J., and Fotuhi-Firuzabad, M. (2021). An MILP model for optimal placement of sectionalizing switches and tie lines in distribution networks with complex topologies. IEEE Trans. Smart Grid 12, 4740–4751. doi:10.1109/TSG.2021.3092405
Li, Z., Wu, W., Tai, X., and Zhang, B. (2020). Feeder-corridor-based distribution network planning model with explicit reliability constraints. IET Gener. Transm. Distrib. 14, 5310–5318. doi:10.1049/iet-gtd.2020.1093
Mehrtash, M., Kargarian, A., and Mohammadi, A. (2019). Distributed optimisation-based collaborative security-constrained transmission expansion planning for multi-regional systems. IET Gener. Transm. &. Distrib. 13, 2819–2827. doi:10.1049/iet-gtd.2018.6555
Mu, B., and Liu, Y. (2018). Regional opportunistic maintenance model for distribution network considering improvement of total supply capability. Dianli Zidonghua Shebei/Electric Power Autom. Equip. 38, 50–55. and 62. doi:10.16081/j.issn.1006-6047.2018.03.007
Shahbazi, A., Aghaei, J., Pirouzi, S., Shafie-khah, M., and Catalão, J. P. S. (2021). Hybrid stochastic/robust optimization model for resilient architecture of distribution networks against extreme weather conditions. Int. J. Electr. Power & Energy Syst. 126, 106576. doi:10.1016/j.ijepes.2020.106576
Shen, X., Shahidehpour, M., Zhu, S., Han, Y., and Zheng, J. (2018). Multi-stage planning of active distribution networks considering the Co-optimization of operation strategies. IEEE Trans. Smart Grid 9, 1425–1433. doi:10.1109/TSG.2016.2591586
Sun, W., Jia, S., Yang, J., and Zhang, W. (2018). Optimization of medium voltage distribution network structure based on total supply capability improvement. ELECTRONICS 2018, 1–6. doi:10.1109/ELECTRONICS.2018.8443623
Verma, A., and Swarup, K. (2017). Optimal tie line placement of distribution system incorporating performance based rates. ICPES 2017, 591–595. doi:10.1109/ICPES.2017.8387362
Xiao, B., Wang, S., and Gu, Y. (2017a). Optimization for contact structure among main transformers between substations considering total supply capacity and minimum contact construction cost. Power Syst. Prot. Control 45, 9–16. doi:10.7667/PSPC162041
Xiao, J., Jiang, X., Guo, W., Li, Y., Huang, R., and Chen, P. (2017b). Total power-supply capability of urban power grid with flexibly-interconnected partitions. Electr. Power Autom. Equip. 37, 66–73. doi:10.16081/j.issn.1006-6047.2017.08.009
Xiao, J., Li, Z., and Zhang, Y. A. (2012). Novel planning and operation mode for Smart distribution networks based on total supply capability. Automation Electr. Power Syst. 36, 8–14. doi:10.3969/j.issn.1000-1026.2012.13.002
Xiao, J., Qu, Y., Song, C., Zhang, B., Buxin, S., and Lin, Q. (2020). “Security region and total supply capability under N-0 for urban distribution network,” in 2020 IEEE power & Energy society general meeting (PESGM), 1–5. doi:10.1109/PESGM41954.2020.9281818
Xiao, J., Wang, C., Buxin, S., Li, F., Bao, Z., and Zhang, X. (2021). Total supply and accommodation capability curves for active distribution networks: Concept and model. Int. J. Electr. Power & Energy Syst. 133, 107279. doi:10.1016/j.ijepes.2021.107279
Xiao, J., Zhang, M., Bai, L., Buxin, S., and Zhang, B. (2017c). Boundary supply capability for distribution systems: concept, indices and calculation. IET Gener. Transm. &. Distrib. 12, 499–506. doi:10.1049/iet-gtd.2017.0725
Xiao, J., Zhang, T., Zu, G., Li, F., and Wang, C. (2016). TSC-based method to enhance asset utilization of interconnected distribution systems. IEEE Trans. Smart Grid 9, 1718–1727. doi:10.1109/TSG.2016.2598816
Zhang, S., Pei, W., Yang, Y., Xiao, H., and Kong, L. (2020). “Calculation and analysis of total supply capability of AC/DC hybrid distribution network considering load balance,” in 2020 23rd international conference on electrical machines and systems (ICEMS), 320–324. doi:10.23919/ICEMS50442.2020.9290787
Zhang, X., Liu, Y., Lü, L., Jin, Y., Liu, J., and Liu, R. (2017). Total supply capability analysis of urban 220 kV area power system considering load transfer capability of HV distribution network. Dianwang Jishu/Power Syst. Technol. 41, 1612–1618. doi:10.13335/j.1000-3673.pst.2016.2029
Nomenclature
S Substation
T Substation transformer
RF Feeder capacity
F Feeder
M Feeder link scale
L Feeder link channel
N Feeder link channel scale
Lij Feeder link channel between Ti and Tj
x Feeder link position
BD Balanced degree of feeder geometrical distribution
TCUL Transfer capability provided by unit feeder link
Mopt Optimal feeder link scale when each feeder chooses its best position
TSCm TSC reached after the construction of the mth feeder
Ω Set of all feeder link positions (i, j)
texit(i) Number of feeders from substation transformer Ti after add feeder Fm
tmax(i) Maximum number of feeders of substation transformer Ti
RFi Feeder capacity of substation transformer Ti
Rfeeder(i) Feeder capacity of substation transformer Ti
Lm Length of feeder Fm
Cm Cost of the mth feeder
Clim Total budget for feeder link construction
Keywords: feeder link planning, total supply capability, influence rule, distribution network, optimal construction order
Citation: Xiao J, Lv Z, Zu G and Song C (2022) A feeder link planning method for total supply capability improvement of distribution network. Front. Energy Res. 10:903388. doi: 10.3389/fenrg.2022.903388
Received: 24 March 2022; Accepted: 25 July 2022;
Published: 26 August 2022.
Edited by:
Yue Zhou, Cardiff University, United KingdomReviewed by:
Cristian Bovo, University of Pavia, ItalyZixuan Wang, North China Electric Power University, China
Shuai Yao, Southeast University, China
Copyright © 2022 Xiao, Lv, Zu and Song. This is an open-access article distributed under the terms of the Creative Commons Attribution License (CC BY). The use, distribution or reproduction in other forums is permitted, provided the original author(s) and the copyright owner(s) are credited and that the original publication in this journal is cited, in accordance with accepted academic practice. No use, distribution or reproduction is permitted which does not comply with these terms.
*Correspondence: Guoqiang Zu, enVndW9xaWFuZ190anVAMTYzLmNvbQ==