 Ruanming Huang
 Xiaohui Wang
 Enqi Wu
- State Grid Shanghai Electric Power Company Economic and Technological Research Institute, Shanghai, China
In order to cope with the challenges of dispatching of power grids brought by large-scale distributed photovoltaic power generation related to production and consumers, a maximum expected sample weighted convolutional neural network (EM-WS-CNN) is proposed to forecast the distributed photovoltaic output. First, the distance correlation coefficient and the principal component analysis method are used to extract the comprehensive meteorological factors from the original meteorological data, and then the 6 statistical indexes of the comprehensive meteorological factors and historical power data are used as the clustering characteristics. The historical data are divided into different weather types by using the maximum expectation clustering, and the training samples are weighted based on the membership matrix. Finally, the weighted training data are used to construct the EM-WS-CNN model. In the experimental analysis, the above-mentioned method is compared with the CNN model, and the results show that the proposed method has higher accuracy and robustness.
Introduction
In recent years, with the reduction of the cost of distributed photovoltaic power generation equipment, more application models of distributed photovoltaics for prosumers have come into being, and the photovoltaic assembly capacity of prosumers is also getting higher (Zhang et al., 2021). In order to improve photovoltaic consumption, accurate day-ahead power forecast of distributed photovoltaic power generation has become an increasingly important requirement (Zhou, 2019). At present, there are two main methods (Zhang et al., 2016) to realize photovoltaic power forecast: one is the traditional forecast method represented by time series modeling; the other has been widely used in the field of photovoltaic power forecast in recent years because of its good nonlinear expression ability and fault tolerance performance (Lin and Pai, 2016).
However, in order to achieve high forecast accuracy, the input of the meta-heuristic model should mostly contain irradiance data (Zhao et al., 2016), and the model should be more suitable for scenarios with sufficient data such as large-scale centralized photovoltaic power plants. Most of the distributed user photovoltaic systems with low capacity and few data are not installed with radiation forecasting equipment (Zameer et al., 2017), which greatly increases the difficulty of photovoltaic power forecasting.
In order to solve the problem of limited radiation forecast data, some studies have carried out classification and clustering of weather and fully mine the weather type information to improve the forecast accuracy (Alonso-Montesinos et al., 2015). In 2020, Chen et al. and Wang et al. (Chen et al., 2020; Wang et al., 2020) divided the original data by clustering the meteorological factors such as seasons and weather types and established a classification forecast model suitable for different weathers. A few scholars (Hai et al., 2015; Wang et al., 2017; Eseye et al., 2018) fully explored the characteristics of photovoltaic power and divided the day types based on power information clustering. In addition, considering the similarity between the PV power of the day to be forecast and the PV power of the historical days with the same meteorological conditions (Gaudereto de Freitas et al., 2020), some scholars proposed the concept of similar days (Lopes et al., 2018) The most basic method for selecting similar days is to use relevant meteorological factors to construct daily feature vectors to select similar days (Pang et al., 2020). In addition, some studies have effectively avoided the phenomenon of wrong selection by improving the similarity degree of the fuzzy clustering algorithm, considering seasonal differences (Hu et al., 2020), and using mutual information entropy weighting to consider correlation differences (Bi et al., 2016).
The weather type classification provides the basis for the classification training of the model, and the similar day search provides a reference for the input feature selection of the model. However, it can be seen from the above-mentioned analysis that weather classification and similar day search are usually separated into two different research fields and there is a lack of methods and model studies that combine the advantages of the two. In addition, in order to solve the problem of the small number of historical samples, some studies have integrated the historical data of multiple users. Different distributed users are geographically dispersed and have different models. The existing similar daily methods are all based on meteorological information and do not consider the implicit system internal information such as the actual output power of the distributed photovoltaic system and user power consumption data. This is a large error in the forecast scenario.
The above-mentioned mainstream forecast methods often only improve the model to varying degrees without considering the importance of different samples to the model during model training, resulting in low model accuracy. In addition, the time interval of distributed photovoltaic power forecast is usually 1 h, which cannot meet the higher precision scheduling requirements. In response to these problems, this paper proposes a model based on the maximum expected sample weighted convolutional neural network (EM-WS-CNN), which mines potential weather information from historical data and fully considers the similarity between historical power generation data and forecast days. The forecast time interval is 15 min, and the time granularity is finer, which provides more detailed forecast information for power grid scheduling.
Introduction of Distributed Photovoltaic Modules
Generally, the PV module uses toughened glass as the upper plate and Tedlar as the lower plate, and the three are bonded and encapsulated with ethylene vinyl acetate (EVA), with a size of 839 mm × 537 mm × 50 mm. Because the silicon material will reflect a part of the sunlight, a thin ARC layer (ARC) is added between the photovoltaic cell layer and the EVA layer, which is usually ignored. The structure of each layer of a typical producer consumer distributed photovoltaic module is shown in Figure 1.

FIGURE 1. PV module structure diagram.
When working outdoors, the environmental factors that affect photovoltaic behavior mainly include solar irradiance, ambient temperature, ambient wind speed, pressure gradient, air humidity, cloud height, and air quality. These factors vary in different geographical locations. The most crucial ones are solar irradiance, ambient temperature, and ambient wind speed. Since the radiation incident on the photovoltaic panel mainly includes beam radiation, diffuse radiation, and reflected radiation, the altitude and air quality will directly affect the ratio of beam radiation to diffuse radiation, that is, the solar irradiance includes altitude and air quality, two hidden variables.
Correlation Analysis of Meteorological Factors
The meteorological factors that affect the output power of photovoltaics mainly include irradiance, temperature, humidity, pressure, and wind speed. First, the correlation analysis is carried out on these influencing variables, and the main factors affecting the photovoltaic power output are screened out. The distance correlation coefficient (DCC) is a commonly used correlation measurement method, which can quantitatively analyze the correlation between different factors. The closer the correlation coefficient is to 1, the greater the correlation with the output power. Hence, this paper uses the DCC to weigh the correlation between output power and meteorological factors. The distance correlation coefficient between two random samples X and Y can be defined as
In the above-mentioned formula, when the denominator is 0, dCor = 0, where the X and Y distance covariances are defined as
Here, n is the length of the random variable, and k is the position of the variable.
The correlation analysis is carried out using the actual operation data of a photovoltaic power station, and the meteorological factors used are horizontal radiation, horizontal scattering, oblique radiation, oblique scattering, ambient temperature, relative humidity, wind speed, and rainfall. In order to display the analysis results more intuitively, the correlation coefficients are sorted in descending order. The correlation coefficient analysis results between the sorted photovoltaic output power and meteorological characteristics are shown in Table 1.
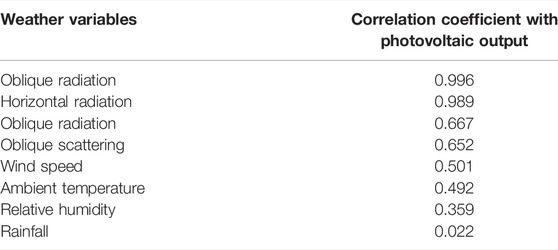
TABLE 1. Results of DCC.
Among the meteorological factors affecting photovoltaic output power, horizontal radiation and oblique radiation have a strong correlation with photovoltaic power; second, ambient temperature, relative humidity, horizontal scattering, wind speed, and oblique scattering have a certain correlation, while rainfall has almost no correlation. This paper selects seven meteorological features with high correlation, namely, horizontal radiation, horizontal scattering, oblique radiation, oblique scattering, ambient temperature, relative humidity, and wind speed, as the main meteorological input parameters affecting photovoltaic power generation.
Principal Component Analysis Method to Extract Comprehensive Meteorological Factors
The principal component analysis (PCA) method is a commonly used and effective data dimensionality reduction method. Due to the redundancy between various meteorological factors, too much redundant information will affect the computational efficiency and reduce the accuracy of the model. Therefore, this paper uses the principal component analysis method to comprehensively analyze the seven main meteorological factors and extracts the comprehensive meteorological factors (CMFs) related to high output power. Experiments show that the extracted statistical indexes of output power and CMFs can reflect the fluctuation of photovoltaic output well.
A matrix composed of 7 important meteorological factors is set as an n × m matrix X, where n is the number of samples and m is the feature dimension, where m = 7. First, the average value is calculated for each dimension feature, and the calculation formula is shown as follows:
Then its covariance matrix C is calculated using the following formula:
Eigenvectors of C ei and eigenvalues of C λi = 1,2,…,m can be calculated as follows:
From this, the matrix after dimensionality reduction can be obtained as Z = XE, in which E = [e1,e2,…ek],k is the dimension after dimensionality reduction.
In order to determine the size of k, that is, the number of principal components in Z, the contribution rate of each principal component after feature reduction is calculated according to Eq. 6. λi is the eigenvalue of the eigenvector, and ri is the contribution rate of the ith eigenvalue.
Different k values (from 1 to 6) are taken to carry out PCA analysis on 7 main meteorological factors, and the data are divided according to the seasons—spring, summer, autumn, and winter. After calculation, the contribution rates of the six groups of principal components in different seasons and throughout the year are shown in Table 2. It can be seen that after the dimensionality reduction of meteorological features, the contribution rate of principal component 1 in spring, summer, and autumn reaches more than 97%, of which summer and autumn can reach more than 98%. In the whole year, principal component 1 can achieve a contribution rate higher than 97%, retaining most of the information in the original meteorological data, so principal component 1 is used as the extracted CMF feature.
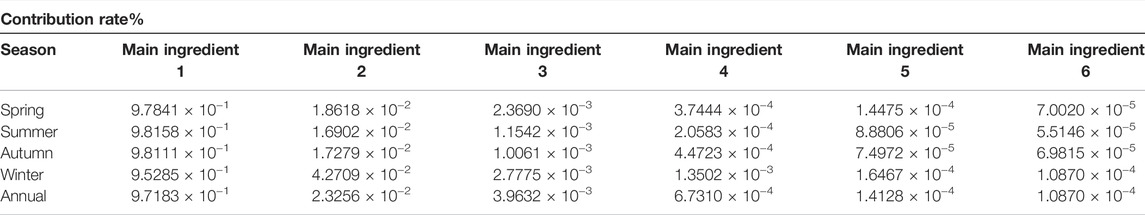
TABLE 2. Results of PCA.
Figure 2 shows the comprehensive meteorological factors extracted by PCA on a certain day in 2019 and the output power of that day. It can be seen that the changing trends of the output power and the comprehensive meteorological factors at the same time are roughly the same, which proves the validity of the extracted comprehensive meteorological factors.
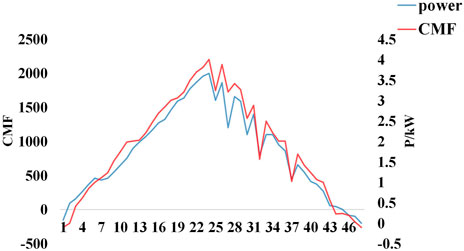
FIGURE 2. CMF and output power.
EM-WS-CNN Forecast Model
Overall Framework of the Model
The overall framework of the EM-WS-CNN model proposed in this paper is shown in Figure 3.
1) First, the original data are preprocessed, including processing of outliers. In daily units, values other than mean ± 3 × standard deviation are determined as outliers, and the values from the previous moment are used to fill in. The imputed data are then normalized.
2) A total of 7 main features with a greater correlation are selected by the distance correlation coefficient, namely, horizontal radiation, horizontal scattering, oblique radiation, oblique scattering, ambient temperature, relative temperature, and wind speed.
3) Based on the 7 main weather factors, principal component analysis is used to extract comprehensive meteorological factors to reflect the overall weather factors.
4) The historical power data and six statistical indexes of CMFs are extracted, and the maximum expectation algorithm is used to cluster the historical power data and divide them into sunny, cloudy, rainy, and extreme weather according to the weather type. The weather type to which the forecast day belongs is determined, and the historical days of the same weather type are considered as similar days. Then, the membership degree of each sample in similar days is determined as the weight of the sample; the greater the similarity, the greater the weight, and the greater the impact on the model forecast.
5) The convolutional neural network is used to train the weighted samples to highlight the importance of similar day samples in model training so that the model can acquire more useful knowledge from similar day samples during training. Using the weather data forecasted a few days ago, with the help of the powerful feature mapping capability of the CNN, the output power with a finer time interval of 15 min is forecasted.
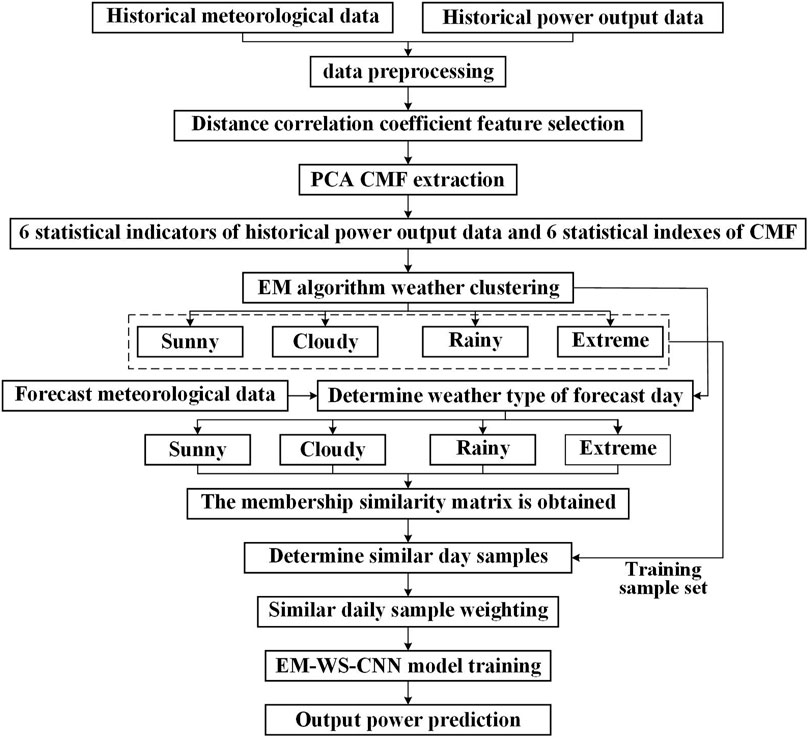
FIGURE 3. EM-WS-CNN overall framework.
Model Input Matrix and Parameter Settings
Since the power generation at night is 0, it is considered to forecast the power from 07:00 to 19:00, with a time interval of 15 min and a total of 48 power points per day. The 48 power points are sequentially split into a 4 × 12 matrix as the input of the CNN model. In the training phase, the weighted similar day samples are sorted according to the membership degree, and the two adjacent days of the membership degree are used as the input and output of the training phase, respectively. The input is 4 × 12 power data, and the output is the 48 power points of the day. The forecast stage selects a day adjacent to the membership degree of the forecast day among the similar days as the input of the forecast stage, and the output is the 48 power points of the forecast day.
The CNN structure used in this paper is shown in Figure 4. The model consists of an input layer, two convolutional layers, a fully connected layer, and an output layer. The input layer of the CNN is a 4 × 12 matrix, and the convolution kernel dimensions of the two convolutional layers are 2 × 3 × 4 and 2 × 3 × 16, respectively. It can be seen that after the input data pass through two convolutional layers, a 4 × 12 × 16 three-dimensional matrix is obtained, and after the Flatten operation, a one-dimensional vector with a length of 768 is obtained as the input of the fully connected layer. The activation function of the fully connected layer uses the Relu function, and the output is 48 power points. Thanks to the powerful feature extraction capability of the CNN, all 48 power data for the 15 min time interval of the forecast day are finally obtained.
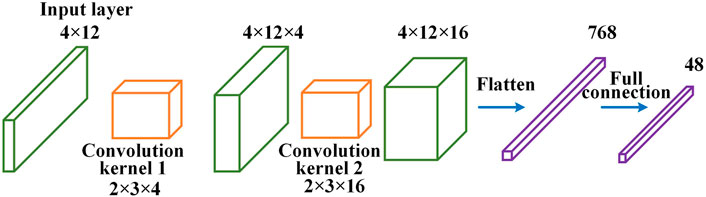
FIGURE 4. Structure of CNN.
Case Analysis
Considering the influence of different weather conditions on distributed photovoltaic power generation involving prosumers, this paper proposes a distributed photovoltaic power generation forecast method based on the EM-WS-CNN. The hardware environment of this paper is an Intel(R) CoreTM i7-7700 CPU @ 3.6 GHz, 16G DDR4 memory, and GeForce GTX 1050Ti (6 GB video memory) 64-bit computer. The software platform is Windows 10 professional edition operating system, Python 3.6 (64-bit), and TensorFlow 2.0 deep learning framework.
Data Description
This paper uses the actual load data of a certain area to verify the model. The total rated power of the distributed photovoltaic power generation of the prosumer is 5 kW, and the sample sampling interval is 15 min.
Evaluation Indicators
To evaluate the performance of the proposed forecasting model, this paper uses root mean square error (RMSE) and mean absolute percentage error (MAPE) to measure the forecasting accuracy of the model. The formulae are as follows:
Here, yi represents the actual power value, and ŷi represents the model forecasted value.
Analysis of Photovoltaic Output Forecast Results
In order to test the performance of the EM-WS-CNN forecast model, the sample data of different weather types in the test set were forecasted, and the EM-CNN model without sample weighting improvement and the original one were designed for sunny, cloudy, rainy, and extreme weather conditions. The CNN model is used as a comparative experiment to verify the effectiveness of the similar daily sample weighting method optimized by the EM algorithm proposed in this paper. One day was selected for each weather type for visual analysis.
Figure 5 shows the output power forecast results using the EM-WS-CNN model and the comparison model under three weather types. The abscissa is the forecasted data point, and the ordinate is the power value. It can be clearly seen from Figure 5 that the forecast based on the CNN model has large fluctuations and large errors and the EM-WS-CNN forecast is more accurate in comparison, so the method proposed in this paper can improve the distributed photovoltaic power generation of producers and sellers and improve forecast stability and accuracy.
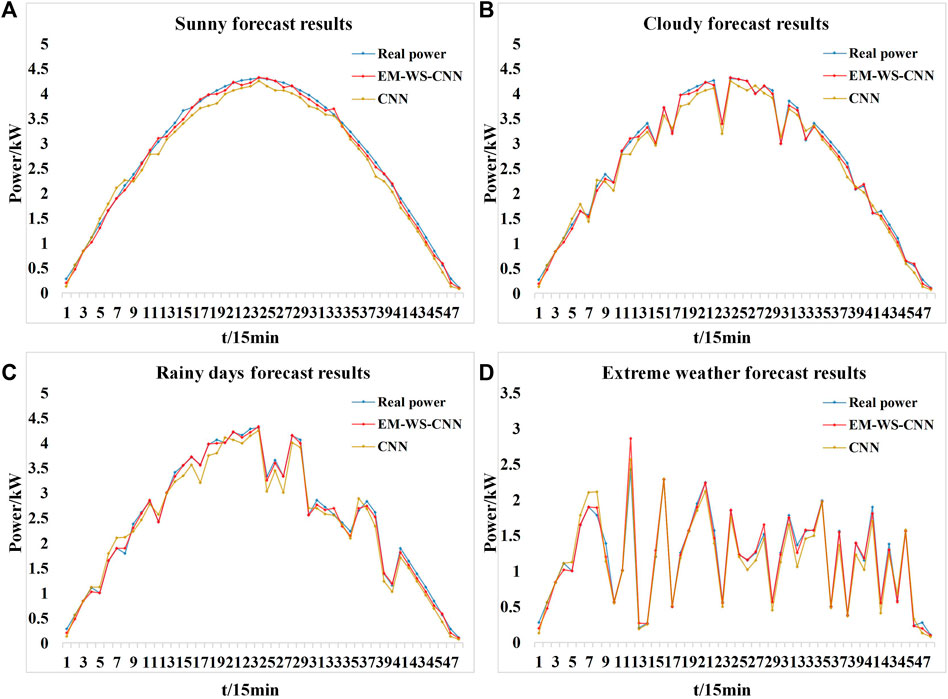
FIGURE 5. Predict results for different weather types.
Table 3 shows the root mean square error (kW) and mean absolute error (%) of the two models for the forecast of four weather types. Under different weather conditions, the RMSE (kW) and MAPE (%) forecasted by the EM-WS-CNN model are better than those forecasted by the CNN model. The average RMSE is 0.437 kW, and the average MAPE reaches 3.835%. For the CNN model, the average RMSE is 0.358 kW, and the average MAPE score is 8.616%. Therefore, the weather clustering model using improved maximum expected clustering is better than the single convolutional neural network model forecast, which improves the anti-interference ability and stability of the model, thus verifying the effectiveness of the model proposed in this paper.

TABLE 3. RMSE and MAPE of four weather types.
The distributed forecast model involving prosumers proposed in this paper can be summed up as follows: the forecast results of the EM-WS-CNN model are the closest to the actual results, the error fluctuation of the PV power is the smallest, and the robustness is strong. It shows that the EM-WS-CNN model can more accurately reflect the PV power characteristics on the forecast day, provide more useful information for photovoltaic grid-connected scheduling, and provide a better forecast basis and research ideas for subsequent forecast research.
Conclusion
With the further increase in the penetration rate of photovoltaic grid connection, refined photovoltaic output forecast can enable the grid dispatching department to customize a more detailed dispatching plan, which is crucial to the stable and safe operation of the power grid. This paper proposes a distributed photovoltaic power forecast model involving prosumers, called the EM-WS-CNN model. First, the distance correlation coefficient was used to separate the main variables, and the principal component analysis method was used to extract the comprehensive meteorological factors. Second, the maximum expectation clustering is used to divide the historical data into four similar weather types. Different weather types can reflect the fluctuation difference in photovoltaic power, and the training samples are weighted according to the weather type of the forecast day. Finally, the EM-WS-CNN model is constructed using the training data. The example verification shows that the EM-WS-CNN model proposed in this paper is superior to the CNN model in both accuracy and stability. Therefore, the model can effectively coordinate the power sector to formulate power generation plans, reduce the impact of randomness of photovoltaic power generation on the power grid, and improve the economic benefits of prosumers.
Data Availability Statement
The original contributions presented in the study are included in the article/Supplementary Material; further inquiries can be directed to the corresponding author.
Author Contributions
HR contributed toward manuscript writing, XW and FF contributed toward data collection, and HL and EW contributed toward content and format correction. All authors have read and agreed to the published version of the manuscript.
Funding
This study received funding from the Analysis Project of Wind Power Photovoltaic Output Characteristics Taking into Account the Complex Meteorological Factors of the State Grid Shanghai Electric Power Company Economic and Technological Research Institute.
Conflict of Interest
HR, XW, FF, HL, and EW were employed by the State Grid Shanghai Electric Power Company Economic and Technological Research Institute.
Publisher’s Note
All claims expressed in this article are solely those of the authors and do not necessarily represent those of their affiliated organizations, or those of the publisher, the editors and the reviewers. Any product that may be evaluated in this article, or claim that may be made by its manufacturer, is not guaranteed or endorsed by the publisher.
References
Alonso-Montesinos, J., Batlles, F. J., and Portillo, C. (2015). Solar Irradiance Forecasting at One-Minute Intervals for Different Sky Onditions Using Sky Camera Images[J]. Energy Convers. Manag. 105, 1166–1177. doi:10.1016/j.enconman.2015.09.001
Bi, R., Ding, M., and Xu, Z. (2016). PV Array Fault Diagnosis Based on FCM[J]. Acta Energiae Solaris Sin. 37 (3), 730–736. doi:10.3969/j.issn.0254-0096.2016.03.031
Chen, X., Lu, C., and Jie, (2020). Two-stage Photovoltaic Power Forecasting and Error Correction Method Based on Statistical Characteristics of Data[J]. Power Syst. Technol. 44 (8), 2891–2897. doi:10.13335/j.1000-3673.pst.2020.0027a
Eseye, A. T., Zhang, J., and Zheng, D. (2018). Short-term Hotovoltaic Solar Power Forecasting Using a Hybrid Wavelet-PSO-SVM Model Based on SCADA and Meteorological Nformation[J]. Renew. Energy 118, 357–367. doi:10.1016/j.renene.2017.11.011
Gaudereto de Freitas, R. L., Calili, R. F., Louzada, D. R., and Braga, S. L. (2020). “Photovoltaic Distributed Generation Use to Reduce Technical Losses in Areas with Overloaded Feeders,” in 2020 47th IEEE Photovoltaic Specialists Conference (PVSC), Calgary, AB, Canada, 15 June-21 Aug. 2020, 2270–2273. doi:10.1109/PVSC45281.2020.9300592
Hai, T., Wen, K., and Zhou, L. (2015). Design of Photovoltaic Ower Generation Forecast System Based on Meteorological Similarity Nd Markov Chain[J]. J. Guangxi Univ. Nat. Sci. dition) 40 (6), 1452–1460. doi:10.13624/j.cnki.issn.1001-7445.2015.1452
Hu, B., Zhan, Z., and Chen, J. (2020). Prediction Research on Short-Term Photovoltaic Output Based on PCA-GA-Elman[J]. Acta Energiae Solaris Sin. 41 (6), 256–263.
Lin, K.-P., and Pai, P.-F. (2016). Solar Power Output Forecasting Using Evolutionary Seasonal Decomposition Least-Square Support Vector Regression. J. Clean. Prod. 134, 456–462. doi:10.1016/j.jclepro.2015.08.099
Lopes, F. M., Silva, H. G., Salgado, R., Cavaco, A., Canhoto, P., and Collares-Pereira, M. (2018). Short-term Forecasts of GHI and DNI for Solar Energy Systems Operation:assessment of the ECMWF Integrated Forecasting System in Southern Portugal[J]. Sol. Energy 170, 14–30. doi:10.1016/j.solener.2018.05.039
Pang, H., Gao, J., and Du, Y. (2020). A Short-Term Load Probability Density Prediction Based on Quantile Regression of Time Convolution Network[J]. Power Syst. Technol. 44 (4), 1343–1349. doi:10.13335/j.1000-3673.pst.2019.1755
Wang, J., Ran, R., and Song, Z. (2017). J SunShort-Term Hotovoltaic Power Generation Forecasting Based on Environmental Factors and GA-SVM[J]. J. Electr. Eng. echnology 12 (1), 64–71. doi:10.5370/jeet.2017.12.1.064
Wang, S., Jiang, X., and Zeng, L. (2020). Ultra-short-term Photovoltaic Power Prediction Based on VMD-DESN-MSGP Model[J]. Power Syst. Technol. 44 (3), 917–926. doi:10.1088/1755-1315/781/4/042020
Zameer, A., Arshad, J., Khan, A., and -, M. A. Z. (2017). RajaIntelligent and Robust Prediction of Short Term Wind Power Using Genetic Programming Based Ensemble of Neural Networks[J]. Energy Convers. Manag. 134, 361–372. doi:10.1016/j.enconman.2016.12.032
Zhang, F., Deb, C., Lee, S. E., Yang, J., and Shah, K. W. (2016). Time Series Forecasting for Building Energy Consumption Using Weighted Support Vector Regression with Differential Evolution Optimization Technique. Energy Build. 126, 94–103. doi:10.1016/j.enbuild.2016.05.028
Zhang, K., Zhou, B., Or, S. W., Li, C., Chung, C. Y., and Voropai, N. (2022). Optimal Coordinated Control of Multi-Renewable-To-Hydrogen Production System for Hydrogen Fueling Stations. IEEE Trans. Ind. Appl. 58, 2728–2739. doi:10.1109/TIA.2021.3093841
Zhao, J., Guo, Z.-H., Su, Z.-Y., Zhao, Z.-Y., Xiao, X., and Liu, F. (2016). An Improved Multi-step Forecasting Model Based on WRF Ensembles and Creative Fuzzy Systems for Wind Speed. Appl. Energy 162, 808–826. doi:10.1016/j.apenergy.2015.10.145
Keywords: distributed generation, photovoltaic power generation forecast, EM-WS-CNN, neural network, prosumer
Citation: Huang R, Wang X, Fei F, Li H and Wu E (2022) Forecast Method of Distributed Photovoltaic Power Generation Based on EM-WS-CNN Neural Networks. Front. Energy Res. 10:902722. doi: 10.3389/fenrg.2022.902722
Received: 23 March 2022; Accepted: 26 April 2022;
Published: 31 May 2022.
Edited by:
Bin Zhou, Hunan University, ChinaReviewed by:
Xu Xu, Hong Kong Polytechnic University, Hong Kong SAR, ChinaGuibin Wang, Shenzhen University, China
Copyright © 2022 Huang, Wang, Fei, Li and Wu. This is an open-access article distributed under the terms of the Creative Commons Attribution License (CC BY). The use, distribution or reproduction in other forums is permitted, provided the original author(s) and the copyright owner(s) are credited and that the original publication in this journal is cited, in accordance with accepted academic practice. No use, distribution or reproduction is permitted which does not comply with these terms.
*Correspondence: Ruanming Huang, MTI0MDE2NDc4MkBxcS5jb20=