 Liangsong Zhou1
 Mutao Huang
94% of researchers rate our articles as excellent or good
Learn more about the work of our research integrity team to safeguard the quality of each article we publish.
Find out more
ORIGINAL RESEARCH article
Front. Energy Res., 27 May 2022
Sec. Smart Grids
Volume 10 - 2022 | https://doi.org/10.3389/fenrg.2022.899692
This article is part of the Research TopicCondition Monitoring for Renewable Energy SystemsView all 13 articles
This article proposes a combined prediction method based on the Markov chain to realize precise short-term wind power predictions. First, three chaotic models are proposed for the prediction of chaotic time series, which can master physical principles in wind power processes and guide long-term prediction. Then, considering a mechanism switching between different physical models via a Markov chain, a combined model is constructed. Finally, the industrial data from a Chinese wind farm were taken as a study case, and the results validated the feasibility and superiority of the proposed prediction method.
To solve the global energy crisis and environmental pollution around the world, wind energy has become one of the most potential sources due to its clean and renewable properties (Brouwer et al., 2016; Yang et al., 2021a). In China, America, and many European countries, more and more wind power generation has been highly concentrated to the power system in the past decades (Huber et al., 2014; Yang et al., 2021b; Yang et al., 2022a), while in this case, the intermittency and variability of wind bring great challenges to the safety of power systems (Tang et al., 2020; Yang et al., 2022b). Therefore, an accurate wind power prediction system is required by system operators to mitigate the undesirable effects. Especially as the installed capacity of wind farms increases, this situation is more urgent than ever.
Currently, the major wind power prediction system related to power system schedule is based on short-term predictions. The existing short-term wind power prediction methods are mainly data-driven models, also known as statistical models. These methods usually utilize the statistical features of historical data and machine learning algorithms to train and build models, for example, auto-regressive and moving average models (ARMA), KNN, neural networks (NNs), support vector machines (SVMs), extreme learning machines (ELMs), and so on (Valipour et al., 2013; Doucoure et al., 2016; Tang et al., 2021). For instance, in Kanna and Singh (2012), several data-driven models were introduced for short-term wind power prediction. In Liu et al. (2012), an ELM-based wind power prediction model was also applied to the real wind farm data. All of these models could achieve high accuracy in short-term prediction, but their shortage is also obvious since residuals are cumulated as prediction is going on.
To improve the performance of wind power predictions, there are several ways for model improvement. This first type is to consider the combination of physical and statistical factors of data together. In this way, the multiple step prediction could be improved with the assistance of physical trends. For example, one useful model considering wind power data’s physical factors is based on chaotic time series prediction, since the process of wind was validated to obey the variance of the chaotic system (Lange and Focken 2006). In Lei et al. (2007), wind power data were verified as a chaotic time series and reconstructed for wind power prediction. The second type is to consider different patterns in time series data and to build a hybrid prediction model. For example, some short-term prediction models utilize signal decomposition to generate different patterns, for example, wavelet decomposition and empirical mode decomposition (EMD) (An et al., 2011; Li et al., 2021a), and then combine predictions of different patterns for the final prediction. In this way, the prediction can be improved with more robustness. The more direct way is to use different models to reflect different patterns in prediction. For example, in Tascikaraoglu and Uzunoglu (2014), a linear combined model was proposed to average the prediction results of different methods. In Ouyang et al. (2016), a Markov chain was regarded as a switching regime to select different parameters in a prediction model.
Considering the aforementioned descriptions, this article proposed a hybrid model which considers the aforementioned two factors to realize precise short-term wind power prediction. The advantages of the proposed model can be summarized as follows: First, considering the physical characteristics of wind power time series, different chaotic time series models are used to form the model library. Since chaotic time series models are physics-based models, they are more reliable than data-driven models, especially in long-term trend prediction. Second, considering the mechanism of hybrid modeling, this study considers using the Markov chain to estimate wind patterns and to guide the selection of suitable physical models in prediction. Finally, combining these contributions to realize a high-precision wind power prediction, industrial wind power data are studied to validate the effectiveness of the proposed method.
Generally, if time series data are from a chaotic system, it is possible to reproduce the dynamics information of its related system. To realize this idea, time series data are usually embedded into a new diffeomorphism space where data have the same dynamic behaviors as the original space and better representation ability (Rand and Young 1988; Chen et al., 2019). Therefore, data in the reconstructed phase space would be better for modeling and data mining. Here, referring to Packard et al. (1980), wind power time series could be reconstructed as chaotic time series according to Takens’ theory (Rand and Young 1988), expressed in the following form:
where {xn} represents the series of wind power data; xn is the reconstructed data, which is a vector xn Rm; and τ and m are delay time and embedding dimension parameters, which can be calculated by using the mutual information (MI) method (Fraser and Swinney 1986) and false nearest neighbors (FNN) method (Xiong et al., 2017), respectively. Then, based on the reconstructed chaotic time series in eq. 1, several prediction models could be built, for example, local prediction models, global prediction methods, prediction methods based on the Lyapunov exponent and Volterra prediction models (Zhang and Liang 2012; Jinquan et al., 2016). Considering the prediction precision, the global prediction method is rarely used in wind power prediction, so three selected models are introduced as follows.
Local prediction models have different orders, but the first-order linear model is used the most. Assuming a given point x(t) in the phase space, q nearest points xi(t), i = 1,2…, q, are taken as reference in prediction. Then the prediction model is described in eq. 2:
where A and B are the coefficient matrixes of the prediction model, which can be trained by the least square method, and k is the prediction time interval, but its value cannot be too large since the evolution over a long period is not linear for chaotic systems.
Then the prediction is calculated as x(t + k) = A + B∗x(t).
In the chaotic system, it is known that two nearby tracks are linear in the short term and have an exponent trend in the longer term. This feature is utilized in the prediction method based on the Lyapunov exponent. Then the prediction model is expressed in eq. 3:
where k is the prediction time interval, Lt is the distance between x(t) and its nearest neighbor x(t’), Lt+k is the distance between x(t + k) and x(t’+k), λk is the Lyapunov exponent related to the interval k, and it is calculated when T = k.
The Volterra algorithm is a non-linear filter and can be expressed in eq. 4:
where x(n+1) is the predicted value, x(n-t) are historical values, p is the order of a Volterra filter, and h is the coefficient corresponding to different elements. It is seen that a Volterra filter with a high order is complex, so a second-order model is usually used for predicting wind power time series, as described in eq. 5:
where m is the embedded dimension, τ is the delay time, k is the prediction time interval, and u, v, and w represent the index of the selected data.
The previously mentioned three models were proposed to apply in chaotic time series prediction in many references. The three methods perform differently in different scenarios and even have different accuracy in the same period in same scenario. Therefore, a suitable solution to achieve relatively better performance is to construct a combined model as described as follows:
where
In Ouyang et al. (2016), the Markov chain was used as a regime switching different models to improve the accuracy of short-term wind power prediction. The process is decided by the transition probability matrix of a Markov chain. In this article, a new combined model based on the transition probability and prediction models of chaotic time series is proposed to predict wind power.
By assuming these three chaotic time series models as three different patterns, as {S1, S2, S3}, the idea of the Markov process is to suppose that the states st+1 are related to the states st, described in eq. 7:
where Pij (t,t+1) is the transition probability on the condition of satisfying the current pattern Si and the next pattern Sj. Assuming the wind power time series as Ωt and the tth value is yt, then the forward probability is defined in eq. 8:
where
where N = 3, since there are only three available prediction models. Conversely, assuming that the whole wind power time series is given as ΩT ( where T is the length of the given time series), the backward probability is calculated in eq. 10:
Combining the forward probability and backward probability, the probability of states at each time is calculated by using the maximum likelihood estimation (MLE) method. Then the weights of the combined model in eq. 6 are decided by the calculated probability, and the final prediction model is expressed as eqn 11:
where pi is the probability of the ith model.
In this study, a real-world wind power dataset from Chinese wind farms is taken for the case study. This dataset collected samples for 2 years with a sampling period of 15 min. There are a total of 70,176 samples. By taking 70% of the data (viz., historical data from the last 17 months) as the training set, the data from the rest of the months are used for validation and testing. First, the phase space of the data is reconstructed based on eq. 1 by applying the reconstruction parameters with τ = 7 and m = 9 based on MI and FNN. Then the reconstructed chaotic time series are used to train and predict wind power based on three models introduced in Section 2.
Figure 1 depicts the prediction results of three models: S1, S2, and S3 (representing local linear prediction models with first-order, prediction models based on the Lyapunov exponent, and Volterra prediction models, respectively). Figures 1A,B present the predicted wind power and prediction errors, respectively. It is qualitatively found that these three models have good performance in predicting wind power in Figure 1A. However, the prediction errors in Figure 1B illustrate that each model have its best prediction performance at different local times.
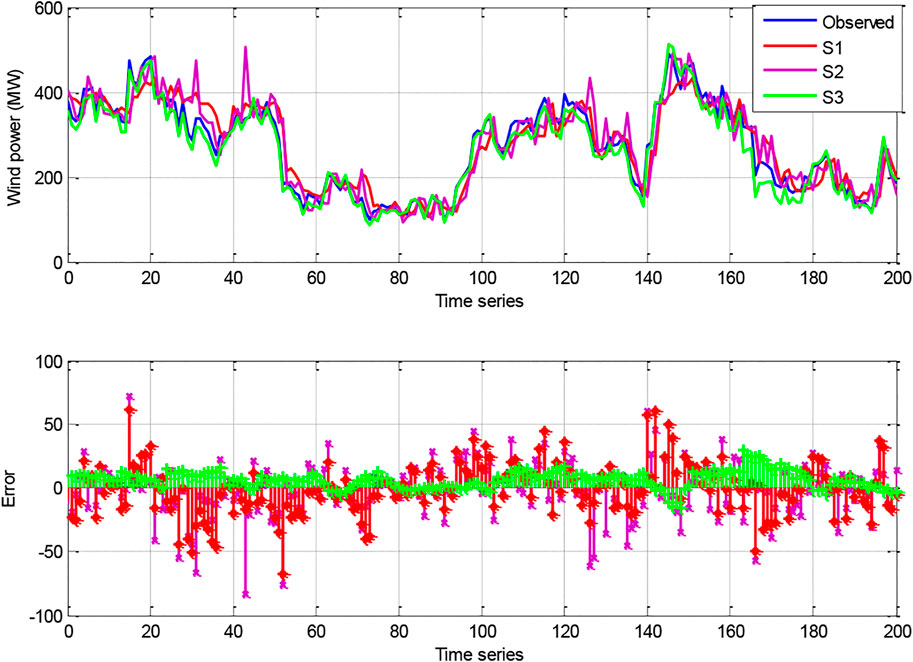
FIGURE 1. Wind power prediction based on three given chaotic time series models.
Moreover, to evaluate the time series prediction performance quantitatively, some useful error metrics could be applied (He et al., 2017). For example, the commonly used mean absolute error (MAE), mean squared error (MSE), root-mean-square error (RMSE), and the standard deviation of absolute error (SDofAE) are possible options. These metrics have advantages in evaluating the error on prediction amplitude and are commonly used in prediction research. Moreover, a kind of transverse error metric could also be used for evaluation, such as correlation coefficient (CC), which aims to evaluate the prediction model’s performance in time delay. In this study, four selected metrics are given to evaluate the performance of wind power time series predictions:
where yi and
Table 1 shows the values of four error indicators in wind power prediction. S1, S2, and S3 represent the three prediction models introduced in Section 2, respectively. It is seen that the difference between the former three models is not large and that S1 has the worst prediction performance, while S3 has the best prediction performance according to the values of the error indicators.

TABLE 1. Four error metrics of three individual chaotic prediction models.
According to the description of the proposed method, a combined model could effectively improve the shortages of individual models at local prediction. Therefore, a combined model is proposed in eq. 11, where its weights are selected as the transition probability of the Markov chain. Taking the three given prediction models as three states, the transition probabilities of states at each time are calculated based on eqs 7–10.
Figure 2 depicts the transition probability of three states in the same period as Figure 1. It is seen that the wind power is predicted by one model with a given probability at each time. Therefore, if the probability of each state is taken as the weight of the combined model in eq. 11, then wind power for the same period with Figure 1 can be predicted.

FIGURE 2. Probability of three states (three models) at each time.
Then, also making use of the given error metrics in evaluation, the performance of the proposed method is presented in the following table. For the consideration of the comparison study, several other prediction methods are also evaluated, such as two combined models, namely, a linear combined model of S1, S2, and S3 and a Markov-switching-autoregression model (MSAR), three generally used data-driven models based on neural networks (NNs), support vector machine (SVM) (Li et al., 2021b), and extreme learning machine (ELM) (Shen et al., 2020). All of their results are presented in Table 2.
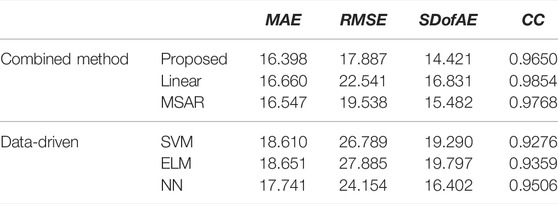
TABLE 2. Wind power prediction using various methods.
Table 2 shows the error metrics of wind power prediction based on different models, including individual data-driven models and combined models. Through the comparison, some phenomena could be found. First, the combined models generally outperform all of these individual models, including the common statistical models and the chaotic time series models in Table 1, which validates the effectiveness of combined models in improving wind power prediction performance. Second, through comparison between individual and combined chaotic models, it is seen that considering the combination or switching of different physical models is helpful to improve prediction accuracy. Moreover, the switching mechanism with consideration of the Markov chain can outperform the simple linear combination model. Finally, the proposed method combining both the chaotic time series model and the Markov chain could further improve the prediction performance. In the comparison study, it is reasonable that for individual chaotic time series, models cannot achieve obvious superiority than traditional data-driven models which can achieve high-precision in short-term prediction. However, chaotic time series models are more reliable than data-driven models since they consider physical principles of the wind development process. Therefore, chaotic models would be helpful to capture wind trends, and guarantee good accuracy in the long-term prediction in the future study.
To realize precise short-term wind power prediction, this article proposed a more reliable combined model considering both chaotic time series modeling and the Markov chain mechanism. First, by reconstructing the wind power data into a new space with the consideration of the wind’s chaotic physical features, three chaotic time series models consist of the primary model library. Second, by taking different models as the states of the Markov chain, and a combined model utilizing the transition probability of the Markov chain as the weight is constructed. The results of Table 2 verify that the combined model based on the Markov chain is feasible to predict wind power. Moreover, through the comparison study, the proposed method is validated to improve the precision of wind power prediction, which will be helpful for direct scheduling and planning in the power system in the future.
The original contributions presented in the study are included in the article/Supplementary Materials, further inquiries can be directed to the corresponding author.
LZ put forward the main research points; MH completed manuscript writing and revision; XZ, YL, and HL completed simulation research; LZ collected relevant background information; and MH revised grammar and expression. All authors contributed to manuscript revision, read, and approved the submitted version.
The authors declare that the research was conducted in the absence of any commercial or financial relationships that could be construed as a potential conflict of interest.
All claims expressed in this article are solely those of the authors and do not necessarily represent those of their affiliated organizations, or those of the publisher, the editors and the reviewers. Any product that may be evaluated in this article, or claim that may be made by its manufacturer, is not guaranteed or endorsed by the publisher.
An, X., Jiang, D., Liu, C., and Zhao, M. (2011). Wind Farm Power Prediction Based on Wavelet Decomposition and Chaotic Time Series. Expert Syst. Appl. 38 (9), 11280–11285. doi:10.1016/j.eswa.2011.02.176
Brouwer, A. S., van den Broek, M., Özdemir, Ö., Koutstaal, P., and Faaij, A. (2016). Business Case Uncertainty of Power Plants in Future Energy Systems with Wind Power. Energy Policy 89, 237–256. doi:10.1016/j.enpol.2015.11.022
Chen, H., Zhang, J., Tao, Y., and Tan, F. (2019). Asymmetric GARCH Type Models for Asymmetric Volatility Characteristics Analysis and Wind Power Forecasting. Prot. Control. Mod. Power Syst. 4 (1), 1–11. doi:10.1186/s41601-019-0146-0
Doucoure, B., Agbossou, K., and Cardenas, A. (2016). Time Series Prediction Using Artificial Wavelet Neural Network and Multi-Resolution Analysis: Application to Wind Speed Data. Renew. Energ. 92, 202–211. doi:10.1016/j.renene.2016.02.003
Fraser, A. M., and Swinney, H. L. (1986). Independent Coordinates for Strange Attractors from Mutual Information. Phys. Rev. A. 33 (2), 1134–1140. doi:10.1103/physreva.33.1134
He, Y., Kusiak, A., Ouyang, T., and Teng, W. (2017). Data-driven Modeling of Truck Engine Exhaust Valve Failures: a Case Study. J. Mech. Sci. Technol. 31 (6), 2747–2757. doi:10.1007/s12206-017-0518-1
Huber, M., Dimkova, D., and Hamacher, T. (2014). Integration of Wind and Solar Power in Europe: Assessment of Flexibility Requirements. Energy 69, 236–246. doi:10.1016/j.energy.2014.02.109
Jinquan, Z., Yujie, Z., Pan, Z., Xiaoming, J., and Chao, F. (2016). Development of a WAMS Based Testplatform for Power System Real Timetransient Stability Detection and Control. Prot. Control. Mod. Power Syst. V1 (1), 37–47.
Kanna, B., and Singh, S. N. (2012). AWNN-assisted Wind Power Forecasting Using Feed-Forward Neural Network. Sustainable Energy. IEEE Trans. 3 (2), 306–315.
Lange, M., and Focken, U. (2006). Physical Approach to Short-Term Wind Power Prediction. Berlin: Springer, 1–208.
Lei, D., Lijie, W., Shi, H., Shuang, G., and Xiaozhong, L. (2007). “Prediction of Wind Power Generation Based on Chaotic Phase Space Reconstruction Models,” in Power Electronics and Drive Systems, 2007. PEDS'07. 7th International Conference on (Bangkok, Thailand: IEEE), 744–748. doi:10.1109/peds.2007.4487786
Li, H., Deng, J., Feng, P., Pu, C., Arachchige, D. D., and Cheng, Q. (2021). Short-Term Nacelle Orientation Forecasting Using Bilinear Transformation and ICEEMDAN Framework. Front. Energ. Res. 697, 780928. doi:10.3389/fenrg.2021.780928
Li, H., Deng, J., Yuan, S., Feng, P., and Arachchige, D. D. (2021). Monitoring and Identifying Wind Turbine Generator Bearing Faults Using Deep Belief Network and EWMA Control Charts. Front. Energ. Res. 9, 799039. doi:10.3389/fenrg.2021.799039
Liu, Y., Shi, J., Yang, Y., and Lee, W.-J. (2012). Short-Term Wind-Power Prediction Based on Wavelet Transform-Support Vector Machine and Statistic-Characteristics Analysis. IEEE Trans. Ind. Applicat. 48 (4), 1136–1141. doi:10.1109/tia.2012.2199449
Ouyang, T., Zha, X., Qin, L., Xiong, Y., and Xia, T. (2016). Wind Power Prediction Method Based on Regime of Switching Kernel Functions. J. Wind Eng. Ind. Aerodynamics 153, 26–33. doi:10.1016/j.jweia.2016.03.005
Packard, N. H., Crutchfield, J. D., Farmer, J. D., and Shaw, R. S. (1980). Geometry from a Time Series. Phys. Rev. Lett. 45 (9), 712–716. doi:10.1103/physrevlett.45.712
Rand, D., and Young, L. S. (1988). Dynamical Systems and Turbulence, Lecture Notes in Mathematics. Berlin, Germany: Springer-Verlag, 366381.
Shen, X., Zhang, X., Ouyang, T., Li, Y., and Raksincharoensak, P. (2020). Cooperative Comfortable-Driving at Signalized Intersections for Connected and Automated Vehicles. IEEE Robot. Autom. Lett. 5 (4), 6247–6254. doi:10.1109/lra.2020.3014010
Tang, Z., Zhao, G., and Ouyang, T. (2021). Two-phase Deep Learning Model for Short-Term Wind Direction Forecasting. Renew. Energ. 173, 1005–1016. doi:10.1016/j.renene.2021.04.041
Tang, Z., Zhao, G., Wang, G., and Ouyang, T. (2020). Hybrid Ensemble Framework for Short-Term Wind Speed Forecasting. IEEE Access 8, 45271–45291. doi:10.1109/access.2020.2978169
Tascikaraoglu, A., and Uzunoglu, M. (2014). A Review of Combined Approaches for Prediction of Short-Term Wind Speed and Power. Renew. Sustain. Energ. Rev. 34, 243–254. doi:10.1016/j.rser.2014.03.033
Valipour, M., Banihabib, M. E., and Behbahani, S. M. R. (2013). Comparison of the ARMA, ARIMA, and the Autoregressive Artificial Neural Network Models in Forecasting the Monthly Inflow of Dez Dam Reservoir. J. Hydrol. 476, 433–441. doi:10.1016/j.jhydrol.2012.11.017
Xiong, Y., Zha, X., Qin, L., Ouyang, T., and Xia, T. (2017). Research on Wind Power Ramp Events Prediction Based on Strongly Convective Weather Classification. IET Renew. Power Generation 11 (8), 1278–1285. doi:10.1049/iet-rpg.2016.0516
Yang, N., Dong, Z., Wu, L., Zhang, L., Shen, X., Chen, D., et al. (2021). A Comprehensive Review of Security-Constrained Unit Commitment. J. Mod. Power Syst. Clean Energ..
Yang, N., Qin, T., Wu, L., Huang, Y., Huang, Y., Xing, C., et al. (2022). A Multi-Agent Game Based Joint Planning Approach for Electricity-Gas Integrated Energy Systems Considering Wind Power Uncertainty. Electric Power Syst. Res. 204, 107673. doi:10.1016/j.epsr.2021.107673
Yang, N., Yang, C., Wu, L., Shen, X., Jia, J., Li, Z., et al. (2021). Intelligent Data-Driven Decision-Making Method for Dynamic Multi-Sequence: An E-Seq2Seq Based SCUC Expert System. IEEE Trans. Ind. Inform. 18, 3126. doi:10.1109/TII.2021.3107406
Yang, N., Yang, C., Xing, C., Ye, D., Jia, J., Chen, D., et al. (2022). Deep Learning‐based SCUC Decision‐making: An Intelligent Data‐driven Approach with Self‐learning Capabilities. IET Generation Trans. Dist 16 (4), 629–640. doi:10.1049/gtd2.12315
Keywords: wind power prediction, combined model, Markov chain, chaotic time series, data-driven
Citation: Zhou L, Zhou X, Liang H, Huang M and Li Y (2022) Hybrid Short-Term Wind Power Prediction Based on Markov Chain. Front. Energy Res. 10:899692. doi: 10.3389/fenrg.2022.899692
Received: 19 March 2022; Accepted: 01 April 2022;
Published: 27 May 2022.
Edited by:
Shuang Zhao, Hefei University of Technology, ChinaReviewed by:
Man Zhang, Hefei University of Technology, ChinaCopyright © 2022 Zhou, Zhou, Liang, Huang and Li. This is an open-access article distributed under the terms of the Creative Commons Attribution License (CC BY). The use, distribution or reproduction in other forums is permitted, provided the original author(s) and the copyright owner(s) are credited and that the original publication in this journal is cited, in accordance with accepted academic practice. No use, distribution or reproduction is permitted which does not comply with these terms.
*Correspondence: Mutao Huang, aHVhbmdtdXRhb0BodXN0LmVkdS5jbg==
Disclaimer: All claims expressed in this article are solely those of the authors and do not necessarily represent those of their affiliated organizations, or those of the publisher, the editors and the reviewers. Any product that may be evaluated in this article or claim that may be made by its manufacturer is not guaranteed or endorsed by the publisher.
Research integrity at Frontiers
Learn more about the work of our research integrity team to safeguard the quality of each article we publish.