 Yuzhu Xiang1
 Puyu Wang
 Kaijie Fang
- 1School of Electrical and Information Engineering, Jiangsu University, Zhenjiang, China
- 2School of Automation, Nanjing University of Science and Technology, Nanjing, China
- 3Jiangsu Ling’chuang Electric Automation Co., Ltd., Zhenjiang, China
- 4Tianjin Institute of Power Sources, Tianjin, China
- 5Marketing Service Center, State Grid Jiangsu Electric Power Co., Ltd, Nanjing, China
In the traditional non-invasive load monitoring (NILM) algorithms, the identification accuracy is enhanced with the increased network scale while sacrificing the calculation speed, which restricts the efficiency of the load identification. In this study, a multi-feature (active/reactive power and current peak-to-peak value) fusion algorithm is proposed, which can achieve enhanced identification accuracy with a smaller network scale while maintaining the calculation speed. The features of the power and current amplitudes of the loads are transformed into the values of red-green-blue (RGB) color channels by color coding and then fused into the V-I trajectory features. After that, the true-color feature image with higher discrimination is generated and input into the convolutional neural network (CNN). The testing results on the PLAID data set indicate that in comparison with the traditional load identification algorithm, the algorithm proposed in this study performs higher identification accuracy with a smaller neural network parameter scale, which significantly improves the identification efficiency.
1 Introduction
In 2021, the total electricity consumption in China has been released to be 8,312.8 billion kWh, an increase of 10.3% compared with that of the year 2020, in which the domestic power consumption of urban and rural residents is 1,174.3 billion kWh, with an increase of 7.3%, according to the data released by the China National Energy Administration (Lei., 2021). On one hand, the continuous growth of the residential power demand requires the power supply company to provide the demand side management (DSM) with higher efficiency to optimize power consumption. On the other hand, it also brings greater potential dangers to safety-related issues of the residential electricity consumption. The proportion of electrical fires in 2021 is as high as 50.4% from the perspective of fire types, according to the national fire situation released by the China Fire and Rescue Department Ministry of Emergency Management (Niu, 2021).
As a new means of power load consumption monitoring with artificial intelligence techniques, the non-intrusive load monitoring (NILM) technology obtains information on the type and operational condition of each load in the load cluster by monitoring voltage and current signals at the power input port, which is of great practical significance to strengthen the load side management, reduce power losses, and improve the safety of the power consumption.
Load identification is an important part of NILM. The load steady/transient characteristics are extracted by various algorithms and then matched to the load model in the database to identify the type of the load. Related research has been conducted regarding the construction of a load identification algorithm. As is proved by Gao et al. (2015), the V-I trajectory feature is proved to have higher identification accuracy than the other approaches with the traditional high-frequency features on the public data set. Teshome et al. (2016) decompose the current signal into active (Ia) and reactive (If) components to extract the V-If trajectory features with an improved identification effect for the resistive loads, while the normalization operation during the extraction of the above two features makes the power characteristics difficult to be reflected. In order to resolve this problem, the convolution neural network and BP neural network are both utilized by Wang et al. (2020) to fuse V-I trajectory image features and power digital features, respectively. However, the scale of the neural network increases with this approach, which is not conducive to maintaining the identification efficiency. Cui et al. (2021) propose a true-color feature image where the red-green-blue (RGB) values are converted by the voltage, current, and V-If trajectory information of the loads. In Ding et al. (2021), the active current of the loads, the slope of the straight line segment between the adjacent sampling points of the V-If trajectory, and the average instantaneous power of adjacent sampling points are extracted as the RGB values. The color coding is conducted on the straight line segment between adjacent sampling points of the V-If trajectory. Liu et al. (2019a) propose an algorithm based on a grayscale image, where the phase angle, power factor, and multi-period repeatability between the continuous points of the trajectory respectively correspond to the components of the hue-saturation-brightness (HSV). After that, the differences among the feature vectors can be demonstrated on the sampling points of the V-If trajectory. The aforementioned three pieces of literature can generate true-color visual images with smaller size and higher discrimination, while they have the drawback of large redundancy of feature information.
In this study, the high-frequency information of the load is first sampled. Thus, the normalized voltage and current data in the steady-state cycle can be obtained. In addition, the V-I trajectory matrix is established with the voltage as the vertical axis and the current as of the horizontal axis. After that, the average active/reactive power and current peak-to-peak value in this cycle are extracted and standardized as the RGB values of the V-I trajectory matrix image so as to achieve the data visualization and generate true-color feature image. The characteristic image is then input into a 2DCNN and trained to improve the accuracy of the load identification. Finally, the PLAID public data set is utilized to verify the effectiveness of the proposed approach.
2 Principles of NILM Based on Feature Fusion and Color Coding
2.1 Process of Load Identification
The load identification process of the algorithm (Wang et al., 2020) is illustrated in Figure 1, which can be divided into the following four steps:
1) Waveform acquisition: The original waveform of high-frequency voltage and current is first collected over a long period. Since the on/off state of electrical equipment is included, the event detection is required to determine the steady-state cycle including the feature information. In this study, the sliding window bilateral cumulative sum (CUSUM) algorithm proposed by Niu and Jia (2021) is used to detect the rising edge of the power change of specific equipment. The cycle starting from 1s after the end of the rising edge is regarded as the steady-state cycle.
2) Feature extraction: After obtaining the data from the current and voltage waveform during the steady-state cycle, the V-I trajectory matrix can be formed with the current/voltage as the x-axis/y-axis. Meanwhile, the active/reactive power and current peak-to-peak value are calculated simultaneously.
3) Color coding: Values of the RGB channels are respectively assigned by the active/reactive power and current peak-to-peak value after standardization. After that, the user-defined colors are generated and displayed at each sampling point in the V-I trajectory.
4) Deep learning: Generated true-color feature images are input into the trained convolution neural network and the final output is the predicted value of the electrical equipment.
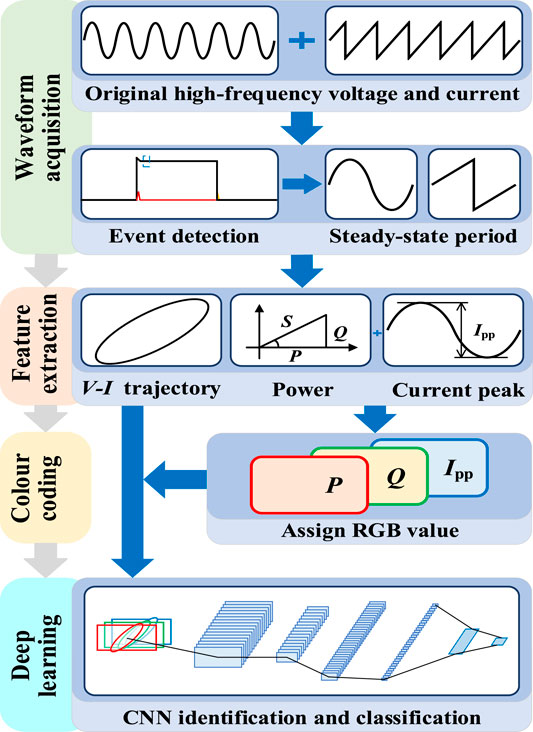
FIGURE 1. Flow chart of the load identification process.
2.2 V-I Trajectory
V-I trajectory is a type of high-frequency feature proposed by Lam et al. (2007), which can reflect the impedance characteristics, current variation, and other characteristics of the electrical equipment at the nominal operating condition. Assuming that the order of the V-I trajectory matrix is generated at k, the voltage/current value sequences v/i during the steady-state cycle are obtained after the acquisition of the waveform, each including N sampling points. Firstly, the voltage and current are standardized as:
where vm and im are the instantaneous voltage and current at mth sampling point; vsm and ism are the voltage and current after standardization, which also correspond to the number of rows and columns of the mth sampling point in the V-I trajectory matrix; ⌊ ⌋ is the downward rounding symbol.
Secondly, a k*k square matrix M is formed and its elements are all 0. The corresponding matrix elements are assigned according to the obtained vsm and ism as:
When the matrix is drawn, the position with element 0 is temporarily displayed as white color while the position with element 1 is displayed as black color. Since the direction of the matrix column is opposite to the positive direction of the y-axis of the plane in the rectangular coordinate, the required V-I trajectory matrix can be obtained by turning matrix M vertically. Figure 2 illustrates the V-I trajectory matrix images of several common household appliances under nominal operating conditions. Figures 2A-F present the binary V-I trajectories of hairdryer, microwave, washing machine, heater, air conditioner and laptop, respectively.
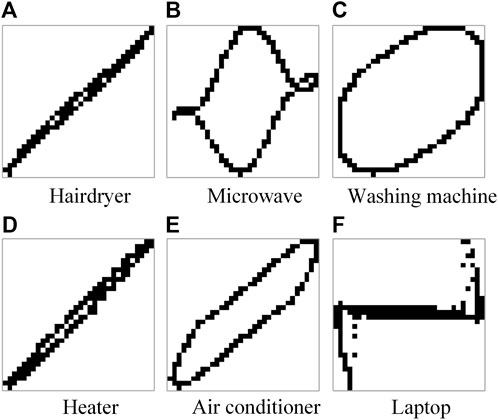
FIGURE 2. Image of the V-I trajectory matrix.
De Baets et al. (2017) conduct an experiment with the PLAID public data set (Gao et al. 2014) and find that under steady-state conditions, the difference in the V-I trajectory caused by the change of the operating states of electrical equipment can be ignored in comparison with the characteristic difference between different equipment. Hence, for multi-state loads such as the air conditioning, the change of their operating states is not considered in this study and is regarded as single-state loads.
2.3 Color Coding
Standardization during the drawing of the V-I trajectory matrix leads to the loss of the amplitude characteristics of the original voltage and current, which can be reflected by the power characteristics of the electrical equipment. Hence, in this study, the average active/reactive power of the electrical equipment during the steady-state cycle is calculated and standardized as the R/G values of the characteristic image. The active and reactive power of the loads are derived as follows:
The standardized derivation of the conversion of the power characteristics into the color values is:
where colR and colG are the values of the R and G channels of the characteristic image; max (Ps)/max (Qs) is the maximum value of the average active/reactive power of electrical equipment during the steady-state cycle in the whole data set.
The current peak-to-peak value describes the variation range of the original signal value during the steady-state cycle, which cannot be reflected by the power characteristics. Similarly, the current peak-to-peak characteristics are standardized to obtain the value of the B channel as:
where Ipp is the peak-to-peak value of steady-state periodic current; max (Ipps) is the maximum peak-to-peak value of steady-state periodic current of the loads among the data set; colB is the value of the B channel of the characteristic image. Thus, the V-I trajectory matrix images in Figure 2 are color-coded and transformed to the true-color feature images, as depicted in Figure 3. Figures 3A-F present the ture-color feature images of hairdryer, microwave, washing machine, heater, air conditioner and laptop, respectively.
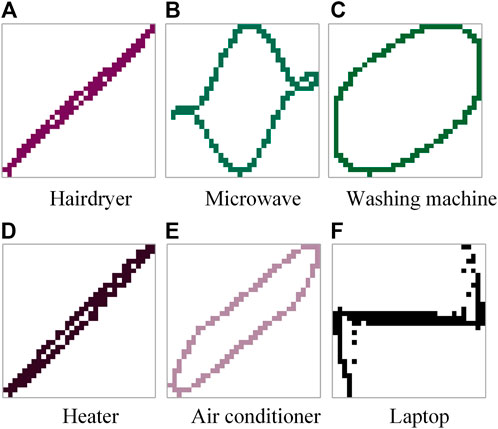
FIGURE 3. True-color feature image.
3 CNN Structure and Training Method
3.1 CNN Structure
As is proved by Russakovsky et al. (2015), CNN has a high sensitivity to subtle color deviation, so it is appropriate to be utilized for classifying the true-color feature images. The CNN classification network used in this study is illustrated in Figure 4.

FIGURE 4. CNN framework.
The specific network parameters are presented in Table 1.
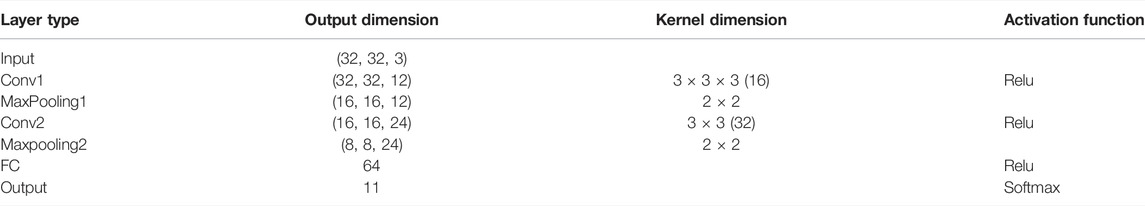
TABLE 1. CNN parameters.
The comparison with the scale of the other networks is illustrated in Table 2.
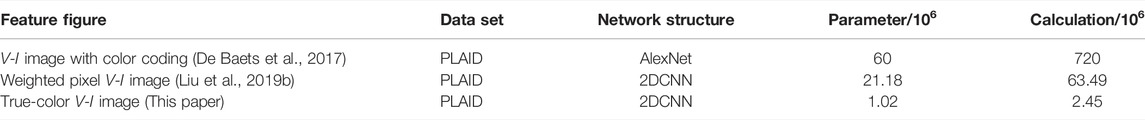
TABLE 2. Comparison of network scales.
It can be seen that compared with the other two networks used by De Baets et al. (2017) and Liu et al. (2019b), the network parameter scale of this algorithm is much smaller and the convergence speed in the training process is also faster. It proves that the algorithm performs higher identification accuracy with a smaller neural network parameter scale.
3.2 CNN Training Method
After completing the establishment of the CNN structure, the deep neural network will be trained. In this study, the PLAID public data set is utilized to generate the required feature image, which is manually divided into the training set and testing set with a ratio of 7:3. The training process activation function uses a sigmoid, and the learning rate is set to 0.01. The loss calculation uses the cross-entropy loss function. In order to prevent overfitting, L2 regularization parameters are added to the full connection layer to control the intensity of the overfitting effect with λ, as is utilized by Li et al. (2016). After testing the neural network, λ is set to 0.05. The final confusion and accuracy of the model can be evaluated according to the matrix.
4 Experimental Results and Analysis
After training 120 times, the accuracy of the testing set reaches 82.87% and the loss of the testing set reaches 2.1106 as shown in Figure 5A. With the same CNN structure in this study, the black-and-white binary V-I trajectory (Gao et al., 2015) has a testing accuracy of 73.68% and a loss of 2.2587 on the PLAID data set as shown in Figure 5B.
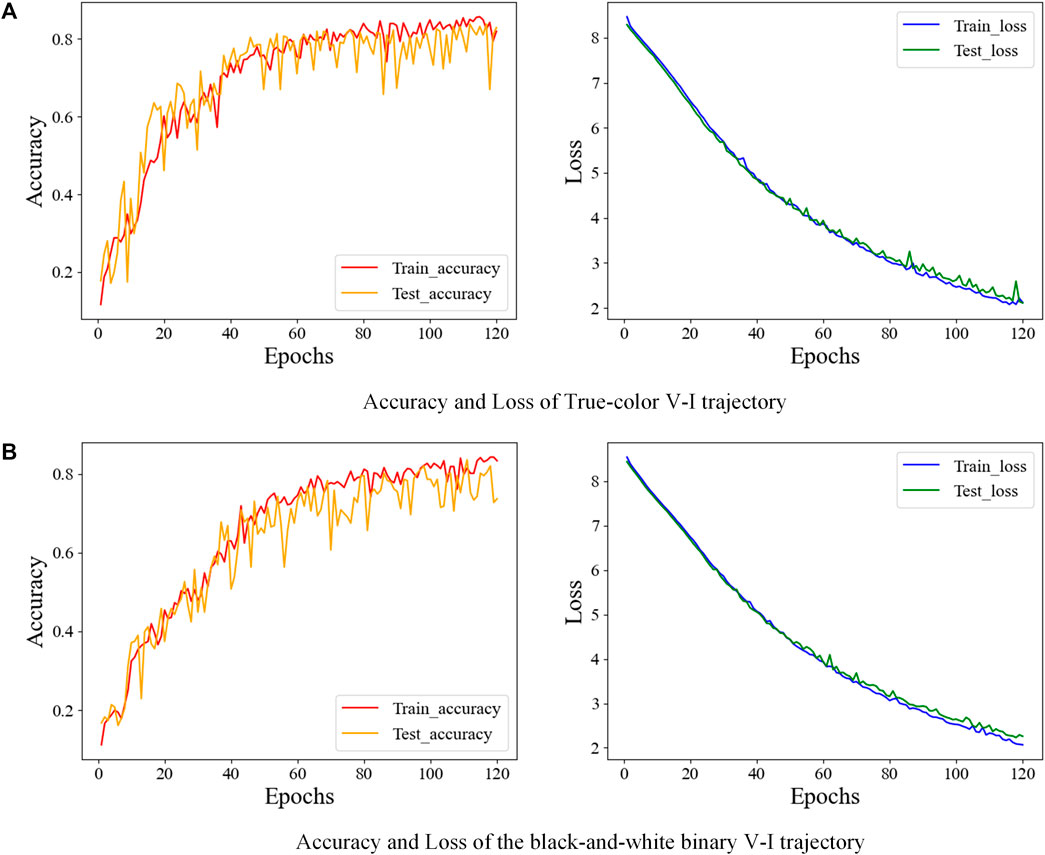
FIGURE 5. Accuracy and loss change curve.
It can be seen from the figure that the accuracy and loss of the method in this study gradually converge with the increase of training times, and there is no overfitting. The accuracy of the method proposed in this study is higher than that proposed by Gao. The comparison of the confusion matrix (Kahl et al., 2016) is shown in Figure 6. Figures 6A,B illustrate the confusion matrix of the ture-color V-I trajectory and the binary V-I trajectory, respectively.
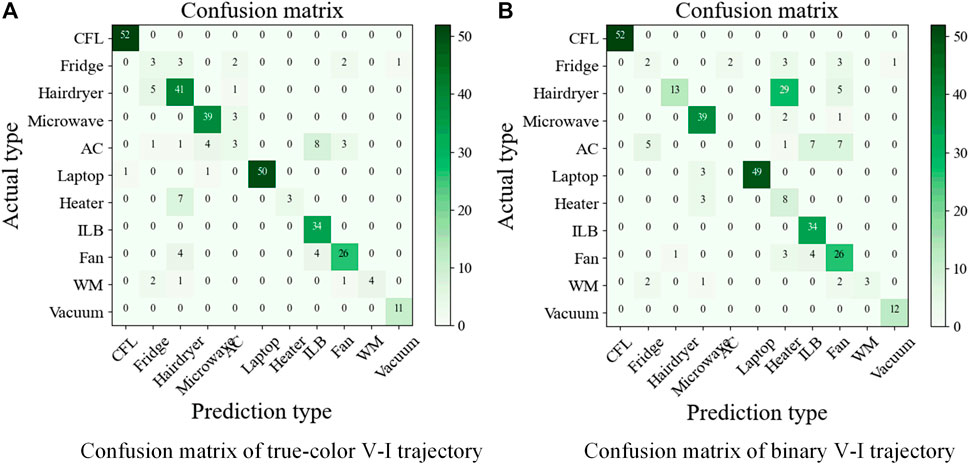
FIGURE 6. Confusion matrix of compound features.
It can be seen from the confusion matrix that there are seven types of equipment with high identification accuracy, e.g., compact fluorescent lamp (CFL), hairdryer, microwave, laptop, incandescent light bulb (ILB), and fan, indicating that these equipment categories have unique V-I trajectory characteristics. The accuracy of multi-state load identification, e.g., the air conditioner (AC) and fridge, is low. The heater and hairdryer are resistive loads with similar power factors, which can hardly be distinguished by the binary V-I trajectory. After adding power parameters, the identification rate is significantly improved, but the accuracy is still not meeting expectations. The reason is that: 1) The power and current level of the air conditioner in the data set is much higher compared with the other electrical appliances as shown in Figure 7, resulting in the concentration of RGB color values of the other electrical appliances in a very small range, which limits the identification accuracy; 2) the number of samples of each electrical appliance in the data set is unbalanced, which also led to the decrease in accuracy. For example, the fluorescent lamp (175 data) is the most sampled appliance, while the washing machine (26 data) is the least sampled appliance.
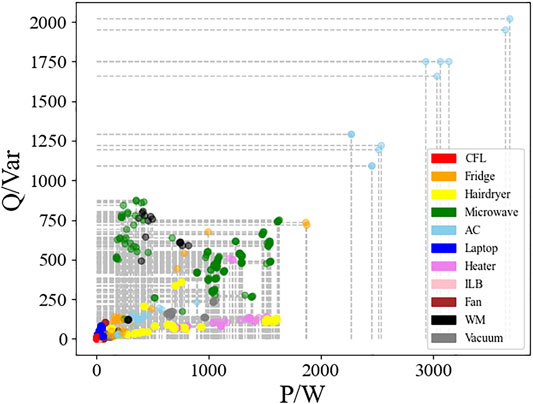
FIGURE 7. Load distributions in two-dimensional plane of the active and reactive power from PLAID.
To solve these two problems, the future work is as follows. First, aiming at the concentration of data of other electrical appliances except for air conditioners, a data interval homogenization algorithm will be proposed to make the feature parameters of all electrical appliances evenly distributed in the interval and enlarge the difference between different electrical parameters; Second, SMOTE algorithm (Liu et al., 2019a) will be used to expand the data set to make the number of data of each type of electrical appliances the same, so as to solve the problem of data imbalance.
5 Conclusion
In order to take both the identification accuracy and the neural network parameter scale into account in the NILM algorithm, a true-color V-I trajectory feature image recognition algorithm integrating active/reactive power and current peak-to-peak amplitude features through color coding has been proposed. Specifically, the features of the active/reactive power and current amplitudes of the loads are transformed into the values of the RGB color channels by the color coding and then fused into the V-I trajectory. As verified with the PLAID public data set, the accuracy and loss of the testing set reach 82.87% and 2.1106, respectively, which indicates that the algorithm proposed has significantly improved the identification efficiency with a smaller neural network parameter scale. Based on the approach proposed in this study, the power feature fusion algorithm can be further optimized to make the power difference of various electrical appliances more intuitive and improve the learning effect of the neural network.
Data Availability Statement
The original contributions presented in the study are included in the article/Supplementary Material, further inquiries can be directed to the corresponding author.
Author Contributions
YX was responsible for conceptualization, methodology, and formal analysis; YD was responsible for the conceptualization, completion of the original draft, and conducted formal analysis; QLuo and PW conducted investigation and validation; QLuo, QLi, and HL was responsible for project administration, funding, and resources. KF and HC was responsible for data processing and supervision. All authors contributed, read, and approved the submitted version.
Funding
This work was supported in part by the National Key Laboratory Fund under Grant 2021-JCJQ-LB-054-06 and in part by the State Grid Corporation of State Grid Jiangsu Electric Power Co., Ltd. Project “Research on optimization and effect evaluation of demand response interaction architecture integrating non metering functions of smart meters (J2020114).”
Conflict of Interest
QLuo was employed by Jiangsu Ling’chuang Electric Automation Co., Ltd. QLi and HL were employed by Tianjin Institute of Power Sources. KF and HC were employed by State Grid Jiangsu Electric Power Co., Ltd.
This study received funding from State Grid Jiangsu Electric Power Co., Ltd. The funder had the following involvement with the study: KF and HC was responsible for data processing and supervision; KF and HC contributed, read, and approved the submitted version.
The remaining authors declare that the research was conducted in the absence of any commercial or financial relationships that could be construed as a potential conflict of interest.
Publisher’s Note
All claims expressed in this article are solely those of the authors and do not necessarily represent those of their affiliated organizations, or those of the publisher, the editors, and the reviewers. Any product that may be evaluated in this article, or claim that may be made by its manufacturer, is not guaranteed or endorsed by the publisher.
References
Cui, H., Cai, J., Chen, L., Jiang, C., Jiang, Y., and Zhang, X. (2021). Non-Intrusive Load Fine-grained Identification Method Based on Color Encoding. Power Syst. Technology 46 (04), 1–12. doi:10.13335/j.1000-3673.pst.2021.0613
De Baets, L., Develder, C., Dhaene, T., Deschrijver, D., Gao, J., and Berges, M. (2017). “Handling Imbalance in an Extended PLAID,” in 2017 Sustainable Internet and ICT for Sustainability (SustainIT), 1–5. doi:10.23919/SustainIT.2017.8379795
Ding, H., Yang, L., Shi, H., and Sun, H. (2021). Realize Intelligent Non-intrusive Load Identification by Using Data Visualization. J. Huazhong Univ. Sci. Technology (NATURAL SCIENCE Edition) 49 (10), 85–90. doi:10.13245/j.hust.211014
Gao, J., Giri, S., Kara, E., et al. (2014). “PLAID: A Public Dataset of High-Resoultion Electrical Appliance Measurements for Load Identification Research: Demo Abstract,” in Proceedings of the 1st ACM Conference on Embedded Systems for Energy-Efficient Buildings, 198–199. (BuildSys'14). doi:10.1145/2674061.2675032
Gao, J., Kara, E. C., Giri, S., and Berges, M. (2015). A Feasibility Study of Automated Plug-Load Identification from High-Frequency Measurements. IEEE Glob. Conf. Signal Inf. Process., Orlando, United States: Dec. 14-16, 220–224. doi:10.1109/GlobalSIP.2015.7418189
Kahl, M., Haq, A., Kriechbaumer, T., et al. (2016). “WHITED—A Worldwide Household and Industry Transient Energy Data Set,” in 3rd International Workshop on Non-Intrusive Load Monitoring, Vancouver, Canada, May 14-15, 1–4.
Lam, H., Fung, G., and Lee, W. (2007). A Novel Method to Construct Taxonomy Electrical Appliances Based on Load Signaturesof. IEEE Trans. Consumer Electron. 53 (2), 653–660. doi:10.1109/TCE.2007.381742
Lei, X. (2021). National Energy Administration: The Power Consumption of the Whole Society. Will Increase by 10.3% Year-on-year in 2021 http://www.cnenergynews.cn/guonei/2022/01/17/detail_20220117115918.html.
Li, Y., Hao, Z., and Lei, H. (2016). Survey of Convolutional Neural Network. J. Computer Appl. 36 (9), 2508–2515. doi:10.11772/j.issn.1001-9081.2016.09.2508
Liu, C., Zhao, Z., Gu, X., Sun, L., Chen, G., Zhang, H., et al. (2019). Establishment and Verification of a Bagged-Trees-Based Model for Prediction of Sentinel Lymph Node Metastasis for Early Breast Cancer Patients. Front. Oncol. 9, 282. doi:10.3389/fonc.2019.00282
Liu, Y., Wang, X., and You, W. (2019). Non-intrusive Load Monitoring by Voltage-Current Trajectory Enabled Transfer Learning. IEEE Trans. Smart Grid 10 (5), 5609–5619. doi:10.1109/TSG.2018.2888581
Niu, L., and Jia, H. (2011). Transient Event Detection Algorithm for Non-intrusive Load Monitoring. Automatic Electric Power Syst. 35 (9), 30–35.
Niu, Q. (2021). Fire and Rescue Department Ministry of Emergency Management Released the National Fire Situation Report from January to October. https://www.emerinfo.cn/2021-11/10/c_1211439935.htm.
Russakovsky, O., Deng, J., Su, H., Krause, J., Satheesh, S., Ma, S., et al. (2015). ImageNet Large Scale Visual Recognition Challenge. Int. J. Comput. Vis. 115 (3), 211–252. doi:10.1007/s11263-015-0816-y
Teshome, D., Huang, T. D., and Lian, K.-L. (2016). A Distinctive Load Feature Extraction Based on Fryze's Time-Domain Power Theory. IEEE Power Energ. Technol. Syst. J. 3 (2), 1. doi:10.1109/JPETS.2016.2559507
Keywords: non-invasive load monitoring (NILM), feature fusion, color channel, color coding, convolutional neural network, true-color feature image
Citation: Xiang Y, Ding Y, Luo Q, Wang P, Li Q, Liu H, Fang K and Cheng H (2022) Non-Invasive Load Identification Algorithm Based on Color Coding and Feature Fusion of Power and Current. Front. Energy Res. 10:899669. doi: 10.3389/fenrg.2022.899669
Received: 19 March 2022; Accepted: 08 April 2022;
Published: 09 May 2022.
Edited by:
Yaxing Ren, University of Warwick, United KingdomReviewed by:
Hailong Zhang, Nanjing Normal University, ChinaFang Shi, Shandong University, China
Dechang Yang, China Agricultural University, China
Copyright © 2022 Xiang, Ding, Luo, Wang, Li, Liu, Fang and Cheng. This is an open-access article distributed under the terms of the Creative Commons Attribution License (CC BY). The use, distribution or reproduction in other forums is permitted, provided the original author(s) and the copyright owner(s) are credited and that the original publication in this journal is cited, in accordance with accepted academic practice. No use, distribution or reproduction is permitted which does not comply with these terms.
*Correspondence: Qiang Luo, bHVvcWlhbmdtYWlsQDE2My5jb20=