 Jonatan J. Gómez Vilchez
 Andreea Julea
 Chiara Lodi
 Alessandro Marotta
94% of researchers rate our articles as excellent or good
Learn more about the work of our research integrity team to safeguard the quality of each article we publish.
Find out more
ORIGINAL RESEARCH article
Front. Energy Res., 27 September 2022
Sec. Sustainable Energy Systems
Volume 10 - 2022 | https://doi.org/10.3389/fenrg.2022.897916
This article is part of the Research TopicTechnologies and Policies for Decarbonisation of the Industrial and Transport SectorsView all 7 articles
A significant proportion of transport greenhouse gas emissions originates from the activity of light-duty trucks and heavy-duty vehicles. The overarching aim of this study is to assess road freight transport decarbonization in Europe by analyzing relevant trends (recent developments and future estimates) and policies. Specifically, the paper investigates the policy measures in place or introduced in the European Union Member States plus the United Kingdom between 2016 and 2018, as reported in their submissions to the European Commission, the market progress and status until 2020/1 and the techno-economic barriers that slow down further emissions mitigation. The study focuses on electric vehicles (battery electric and plug-in hybrid), fuel cell electric vehicles and natural gas-powered vehicles. We find wide differences in the strength of policy support by country, mode and fuel. Our analysis is constrained by data availability and we highlight the need for improvements in data reporting by countries, including the communication of future vehicle estimates and infrastructure targets. We reach the conclusion that, despite some progress, stronger action is needed to timely decarbonize road freight transport in Europe.
Transport generated almost 955 megatonnes of CO2 equivalent (MtCO2eq) in the European Union (EU)1 plus the United Kingdom (UK) in 2019. Of this, 36% (344 MtCO2eq) originated from light-duty trucks and heavy-duty vehicles (HDVs) (UNFCCC, 2021). Taking into account the number of road vehicles in use in Europe, road freight transport seems to be having a disproportionate impact on transport greenhouse gas (GHG) emissions. The perceived need to make road freight transport cleaner has increased among policy-makers in recent years. This, together with the fact that freight transport decarbonization has received less attention than passenger transport decarbonization by the scientific community to date (see e.g., Tsakalidis et al., 2020), motivate the focus of this study. Given the economic nature of road freight transport, technological solutions are receiving the greatest attention and support.
In this paper, we examine the uptake of road freight vehicles powered by alternative fuels and electricity. Specifically, within the scope of this study are light commercial vehicles (LCVs) and heavy commercial vehicles (HCVs) as well as their related recharging and refueling infrastructure. Three alternative sources of energy are examined: electricity, hydrogen and natural gas. This leads to the consideration of the following powertrain technologies: electric [battery electric and plug-in hybrid electric vehicles (BEVs and PHEVs, respectively)], fuel cell electric vehicles (FCEVs), compressed and liquefied natural gas (CNG and LNG) vehicles. When relevant, information on biofuels, liquefied petroleum gas (LPG) and synthetic and paraffinic fuels is provided. The analysis of hybrid electric (i.e., conventional) and hydrogen-powered internal combustion engine vehicles is beyond the scope of this paper.
The overarching aim of this study is to assess road freight transport decarbonization in Europe by analyzing relevant trends (recent developments and future estimates) and policies. This is articulated into three objectives: 1) to determine the speed of market uptake of cleaner powertrain technologies, 2) to summarize the governments’ targets on alternative fuels infrastructure deployment, and 3) to analyze the policies supporting such developments, so that their likely contribution to transport decarbonization goals, or lack thereof, can be gauged. In particular, the paper investigates the policy measures introduced in EU countries plus the UK between 2016 and 2018, as notified to the European Commission in the context of Directive 2014/94/EU on the deployment of alternative fuels infrastructure (EU, 2014), the market progress and status until 2020/1 and the techno-economic barriers that slow down further emissions mitigation.
The structure of the paper is as follows: after this introductory section, Section 2 presents the materials used, including a brief overview of existing research and the methodological approach; in Section 3, the results are reported; the paper ends with the discussion in Section 4.
Analyzing European data from 1979 to 2018, Martulli et al. (2021) reported significant efficiency gains for road freight vehicles, albeit with substantial differences between vehicle types (<3.5 tonnes, 3.5–40 tonnes, >40 tonnes) and variations within each type (cf. their Figure 2). In this subsection, a comparison of GHG emissions by type of vehicle and fuel/technology is provided. The comparison was based on a compilation of recent data from various sources that show well-to-tank (WTT), tank-to-wheel (TTW), well-to-wheel (WTW) and lifecycle GHG emissions.
The left chart in Figure 1 shows the level of WTT and WTW GHG emissions, expressed in grams of carbon dioxide-equivalent per tonne-km [gCO2eq/tkm], by vehicle type (LCV and HCV) for the period 2016–2018. The data represent European conditions, where diesel dominates freight activity, and were sourced from a study commissioned by EEA (2020),2. The data show that: 1) there are significant differences in emissions between LCV and HCVs; 2) the emission levels in Europe for these vehicles have remained relatively stable between 2016 and 2018 and 3) most of the emissions can be attributed to TTW activity. For this reason, and given the fact that the emission levels of HCVs are expected to vary widely by vehicle type [cf. data reported in EEA (2021)], the right chart of the figure shows the annual mileage of four groups of HCVs: rigid lorries with axle configuration 4 × 2 and technically permissible maximum laden mass >16 tonnes (Group 4), tractors with axle configuration 4 × 2 and technically permissible maximum laden mass >16 tonnes (Group 5), rigid lorries with axle configuration 6 × 2 (Group 9) and tractors with axle configuration 6 × 2 (Group 10). These can be further disaggregated into sub-groups as per Table 1 in EU (2019). The annual mileage of each sub-group was sourced from Table 4 in EU (2019).
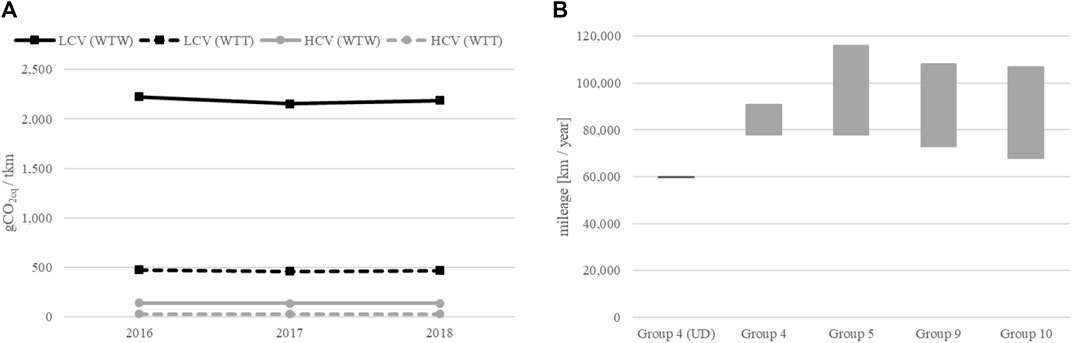
FIGURE 1. Level of GHG emissions by road freight vehicle (A) and truck mileage by group (B). Note on the right chart: the data shows the values associated with regional delivery (RD; bottom of the bar) and long-haul (LH; top of the bar) for each vehicle group. The exception is the first bar, which reflects only urban delivery (UD). Source: adapted from data in EEA (2020) (A) and EU (2019) (B).
Turning to emissions by fuel/technology (see also Supplementary Figure S1), estimates not only of recent but also of future emission levels are useful to gauge the potential for reductions by vehicle type and fuel. This is shown in Figures 2, 3, focusing, respectively on WTW and lifecycle GHG emissions. Figure 2 is based on Prussi et al. (2020), with consideration given to two types of HCVs: RD rigid trucks and tractor semitrailer combination for LH3. Furthermore, their study offers a comparison of numerous options in terms of fuels, powertrains, both for energy and emissions (WTT, TTW and WTW) in two time points: 2016 and beyond 2025. For the purpose of this paper, the charts where the comparison is made in terms of powertrains are most relevant. These are shown below. As can be seen, 1) all the options generate emissions when WTW is measured; 2) the level of emissions is expected to decrease (quite significantly, in some cases) between the two time points; 3) while the emissions pattern looks similar for the rigid and tractor semitrailer options, the emissions level is much lower for LH than for RD; 4) in both cases, the most emitting option is diesel and the least emitting one hydrotreated vegetable oil (HVO). While the potential for biofuel and synthetic fuel use in trucks remains, large-scale fuel availability and attractive end-user prices remain issues to consider (EC, 2020b).
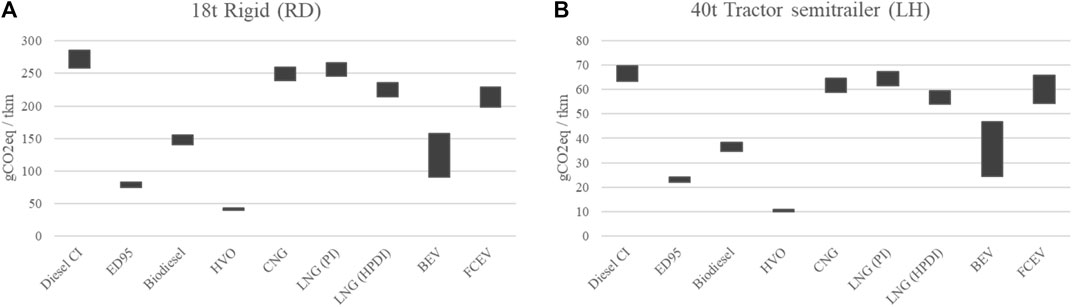
FIGURE 2. HCV powertrain-specific WTW GHG emissions: Group 4 (A) and Group 5 (B). Note: the top of the bar reflects 2016 values while the bottom the 2025+ values (see the methodology in the original source, including assumptions and additional results). CI, compression ignition; ED95, ethanol diesel (95%); PI, positive ignition; HPDI, high pressure direct injection. Source: adapted from Prussi et al. (2020).
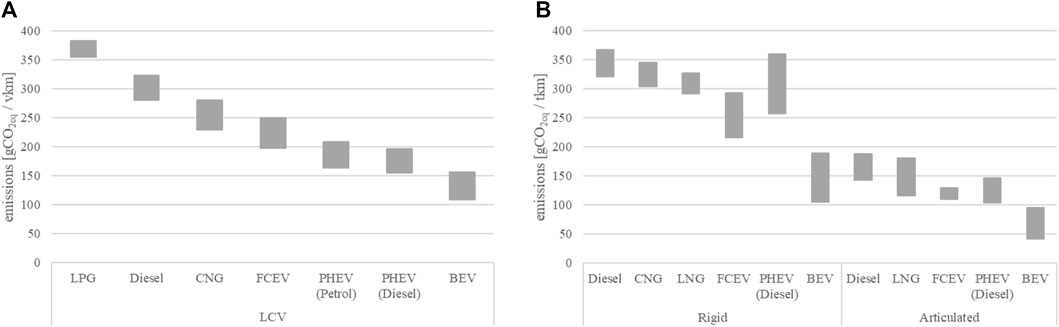
FIGURE 3. LCA emissions, by powertrain: LCV (A) and HCV (B). Note: the top of the bar reflects 2020 values while the bottom the 2030 values. Both are based on the baseline scenario (see the original source for details, including assumptions and additional results). Source: adapted from data in EC (2020a).
The emissions level of the LNG option is placed at the upper end of the chart (lower for HPDI than for PI). Tests reported by T&E (2021) have provided recent evidence that the WTW GHG emissions of a HCV with a gross vehicle weight (GVW) of 28 tonnes powered by LNG are 7.5% lower than a similar LH HCV powered by diesel if the 100-year horizon global warming potential is used but 13% higher than the diesel HCV if the 20-years horizon is considered.
Going a step beyond into lifecycle emissions, Sen et al. (2017) found in their analysis of Class 8 trucks, including diesel (with and without biofuel blend) and hybrid, in the United States that “CNG trucks produced the largest amount of lifetime GHGs emissions compared to other trucks, with BE [V] trucks emitting the least amount” (p. 116). In the European context and more recently, EC (2020a) reports a lifecycle assessment (LCA) for LCVs (N1 Class III vans) and HCVs (rigid 12 tonne-GVW and articulated 40 tonne-GVW; see Figure 3). In contrast to the previous figures, the left chart in Figure 3 is based on the vehicle-km (vkm) metric (see Section 4.2). The threshold between N2 and N3 is 12 tonnes, with N3 exceeding this value [for vehicle definitions, see e.g., UNECE (2014)]. For the 40 tonnes articulated vehicle, Figures 2, 3 coincide in showing higher emissions for FCEVs than for BEVs. Acknowledging that WTT emissions represent a sizeable proportion of LCA emissions for these two powertrains and that the assumed emission factors are a source of uncertainty when comparing the two technologies, the underlying average carbon intensity of the electricity grid is provided: 438.2 gCO2eq/kWh in 2020 and 254 gCO2eq/kWh in 2030. These values reflect an EU electricity generation mix in which the share of renewables increases from almost 40% to around 60%. Concerning hydrogen production, the underlying emission factor goes down from 109.5 gCO2eq/MJ in 2020 (assuming that it is fully produced via steam methane reforming of natural gas) to 102.7 gCO2eq/MJ in 2030 (when 10% of the production occurs via electrolysis).
We conclude the decarbonization analysis with a note on the economic valuation of negative externalities. A common approach in economics is to quantify the money impact of GHG emissions as a climate change external cost. A recent comprehensive study on the external costs of transport, including various modes and types of costs such as accidents, is CE-Delft (2020). Supplementary Figure S2 shows a comparison of such costs for road freight vehicles, with values ranging from zero to 5.46 € cents/tkm.
Concerning model-based policies, in their review of the literature of simulation models dealing with freight transport decarbonization, Ghisolfi et al. (2022) identified four policy instruments (economic, social, legal and knowledge-based) that influence a key decarbonization strategy: “switching to lower-carbon energy.” These authors saw the “coordination of different policy measures as a fundamental challenge for the decarbonization of the freight transport system in the coming years” (p. 24).
Given the heterogeneity of the market for new road freight vehicles, we first performed a decarbonization analysis based on previous research for the purpose of the present paper, reported in Section 2.1. This was one of the three types of analysis our methodology consisted of. The other two were the market analysis and the policy analysis [see Figure 1 in Gómez Vilchez et al. (2022)] for a schematic representation of the methodological approach). While the decarbonization analysis helped us understand the (potential) merits of each fuel/technology option, our work centered on market and policy analyses. The market analysis focused, on the one hand, on the evolution of the stock of vehicles powered by alternative fuels and, on the other hand, on the deployment of its related refueling or recharging infrastructure. Techno-economic barriers were also identified. The policy analysis took into account the infrastructure targets and the national policies proposed or implemented by the Member States to support a diversified use of energy sources in transport.
The core work of market and policy analyses drew from three main sources of information, all generated within the context of Directive 2014/94/EU on the deployment of alternative fuels infrastructure (EU, 2014). Firstly, the work reported in the present paper was based on an extensive research literature we synthetized in EC (2020b), which substantially updated EC (2015). In that report, which was dedicated to analyze the progress in the field of alternative fuels, we disregarded efficiency improvements in internal combustion engines and examined the market development of vehicles powered by biofuels, electricity, hydrogen, LPG, natural gas and synthetic and paraffinic fuels. This report was produced after taking into account the knowledge of stakeholders, whose answers to a questionnaire we co-designed were analyzed, contrasted for coherence and, when appropriate, reflected in the report [see Sections 5.8.1, 5.8.2 of EC (2020b) for further details]. The other two materials used were the in-depth assessments of the Member States’ (including the UK at the time) national implementation reports (NIRs) submitted to comply with the Directive (EC (2021a) and EC (2022). These in turn represent a follow-up of their national policy frameworks (NPFs) (EC, 2019). As an input to the drafting of the NIRs, we co-designed an Excel template and a 33-page guidance document that were sent to the Member State representatives. Their aim was to facilitate their reporting and our assessment, thereby bringing more coherence to the exercise. For a more detailed explanation of the methodology followed to assess the NIRs, see Chapter 2 in EC (2022). These three pieces of work reflect our research on the topic over the past few years.
In the absence of NIR values, the relevant NPF values were used to complete the database. Whenever possible, the data received in the NIRs were complemented with available data from other sources, as cited throughout the paper. Overall, the analysis reported in this paper covers the historical period from 2016 to 2020 as well as the present and future horizon 2021 to 2030.
The results are structured into three sub-sections, with information for each type of fuel. The results of the market analysis are provided in Sections 3.1, 3.2, dealing respectively with alternative fuels infrastructure (AFI) and alternative fuel vehicles (AFVs) (for an overview of the market status and drivers, see respectively Supplementary Figures S3, S4). In Section 3.3, the outcomes of the policy analysis are reported.
Over 38% of the 1,820 bn tkm hauled by HCV in the EU27 + UK in 2019 was international (EC, 2021d). This means that road freight transport in Europe has a strong international dimension, something recognized in the Directive as it sought to promote cross-border continuity. It explicitly acknowledged that LNG and CNG refueling infrastructure “should be adequately coordinated with the implementation of the TEN-T Core Network” (EU, 2014) (p. 7), with TEN-T referring to the Trans-European Network for Transport. The Directive also provided indicative distances between refueling points: 150 km for CNG and 400 km for LNG. Because of this and the fact that AFI at country level is reported in EC (2022), this section briefly considers AFI at European level. It is commonly accepted that alternative fuel refueling and recharging infrastructure availability is a pre-condition for the alternative fuel and electric vehicle markets to respectively develop. The main approach adopted so far in Europe to address this issue has been to allow Member States to set their own deployment targets.
Figure 4 gives an overview of publicly accessible AFI for electricity, hydrogen and natural gas (CNG and LNG). While historical data was available for all the countries examined in this paper, information on targets was not complete because not all the countries reported them for all the required years. For 2025: 20 countries for CNG and LNG, 18 for hydrogen and 17 countries for electricity. For 2030: 19 countries for electricity, 17 for CNG, 14 for hydrogen and LNG. This may help explain the lower number of CNG for 2025 with respect to 2020. Nonetheless, the figure is at least qualitatively useful because it gives a sense of direction for fuel-specific targets for 2025 and 2030. The consideration of hydrogen in the Member State’s NPF was not mandatory. But once a Member Stated decided to include this alternative fuel in its NPF, it was expected that it would also feature in the NIR. As can be seen, there are different levels of ambition for each fuel, even at the EU27 + UK aggregated level. The number of publicly accessible recharging points is expected to grow rapidly between 2025 and 2030.
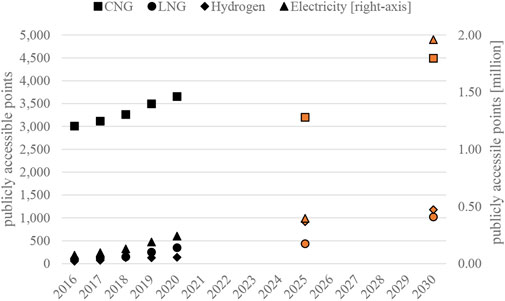
FIGURE 4. AFI deployment in EU27 + UK: historical data (2016–2020) and NIR targets (2025, 2030). Note: targets shown in orange, resulting from the sum of the available targets. Source: adapted from EC (2022), based on NIR and EAFO (2021) data.
Interestingly, the targets for publicly accessible LNG and hydrogen refuelling points–two relevant fuels for HCVs–were respectively 229 and 179 for 2020, by 2025 the number of points supplying hydrogen would double that of LNG, by 2030 LNG refuelling infrastructure would almost catch up with that of hydrogen.
While it is possible to directly link LNG infrastructure to HDVs, the same cannot be done for electricity, hydrogen and CNG-related infrastructure, as light-duty vehicles (LDVs) can be powered by these fuels. Even within LNG, it is unclear whether the NIR refers to HCVs only or included also buses/coaches. For this reason, there is no rational basis for determining which fraction of European recharging infrastructure is expected to serve road freight vehicles.
After briefly highlighting the key results of the market analysis reported in chapter 5 of EC (2020b) (for a more recent overview of HCV powertrain options available in the market, see Supplementary Table S1), in terms of market barriers for each technology, the AFV deployment trends are shown. These include historical data and future estimates of road freight vehicle stock, by type of vehicle and fuel/technology. The term “estimate” refers to a value communicated by the governments of the countries under consideration.
EC (2020b) identified cost as the key market barrier to the deployment of road freight vehicles powered by electricity, particularly of HCVs due to the large battery required to meet the needs of freight operations. Battery recycling was also mentioned as an important aspect. While recharging time can be reduced via (ultra-)fast recharging infrastructure, their relatively high electricity costs were also regarded as a hurdle. A more recent study in seven European countries suggests that the total cost of ownership parity of electric HCV with diesel for LH may be reached between 2024 and 2029 (depending on the country) or earlier if effective policies are introduced (ICCT, 2021).
Figure 5 shows the number of road freight vehicles powered by electricity in use in Europe between 2016 and 2020, disaggregated into LCV and HCV. The figure also shows the 2025 and 2030 estimates for those countries that reported them in their NIR: in both years 14 countries for LCVs and 9 for HCVs (see Supplementary Figure S5). These numbers can be put into context when the global electric road freight vehicle market is considered. In 2020, the European electric LCV (eLCV) and electric HCV (eHCV) stocks accounted for 31% and 4% of the world eLCV and eHCV stocks, respectively. Most of the global eHCV stock, which is almost in its entirety fully electric, is found in China where almost 30,000 electric trucks were in operation in 2020 (IEA, 2021). This can be compared with the ca. 40,000 eHCVs that results from adding the NIR estimates for 2030.
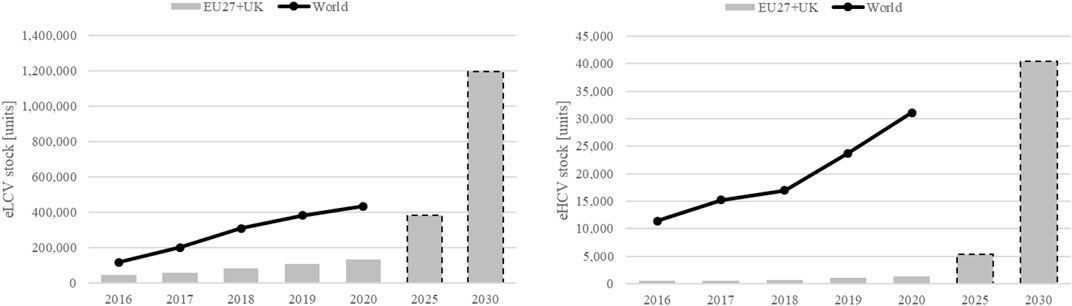
FIGURE 5. Electric LCVs and HCVs stock in EU27 + UK and the world and future estimates in EU27 + UK. Note: the 2025 and 2030 values result from summing the available estimates. Source: adapted from EC (2022), based on NIR, IEA (2021) and EAFO (2021) data.
One of the market-related findings in EC (2020b) was the opposing trends in model availability for natural gas-powered vehicles: downwards for LCV but upwards for HCVs. As stated in that work, cost does not seem to represent an important barrier for the deployment of this alternative fuel, though the cost of HCVs powered by LNG may still be higher than that of counterparts [in part due to the storage tank, see e.g., IEA (2017)].
Concerning FCEVs, the high costs (associated mainly with fuel cells) and low efficiency (compared to the electric option) were highlighted in EC (2020b) as the major market barriers that this powertrain technology needed to overcome to be deployed more widely in Europe. Other relevant issues influencing the success of hydrogen use in road freight applications concerned the fuel cell durability and the investment required in refueling infrastructure.
Figure 6 shows the number of road freight vehicles powered by CNG and hydrogen (and LNG for HCVs) in use in Europe between 2016 and 2020, disaggregated into LCV and HCV. Similar to the previous figure, Figure 6 shows the 2025 and 2030 estimates for those countries that reported them in their NIR: 13 countries for CNG HCVs (in both years), 11 countries for LNG HCVs (in 2030, 9 in 2025), 9 countries for CNG LCVs (in both years) and H2 HCVs (in 2030, 6 in 2025) and 7 countries for H2 LCVs (in 2030, 8 in 2025). The decline compared to 2020 may be explained by the fact that only nine countries reported future LCV estimates for CNG. This numbers are put in perspective by including the total stock of road freight vehicles in the EU27 + UK: these AFVs accounted in 2020 for 0.5% and 0.4% of total LCV and HCVs stocks, respectively.
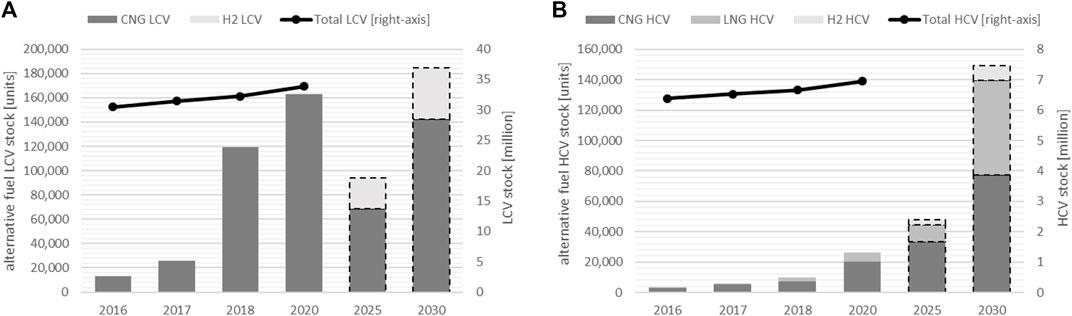
FIGURE 6. Total, natural gas and hydrogen-powered stock and estimates in EU27 + UK: LCV (A) and HCV (B). Note: the 2025 and 2030 values result from summing the available estimates. Source: adapted from EC (2022), based on NIR and EAFO (2021) data.
In order for the future vehicle estimates outlined in the previous section to be met, thereby supporting the AFI targets, a combination of private and public-driven actions needs to take place. The latter are reported in this section, for each fuel/technology, based on the NIR assessment performed during 2020–2021. The emphasis is on policies targeting AFVs, as those directed towards AFI will be reported in future work. For a more recent overview of incentives, see ACEA (2021) and, more specifically for HCVs, ICCT (2021).
The policy analysis is based on the design and application of a thorough assessment methodology, as noted in Section 2.2, which allows us to derive the impact of each cluster of measures. The comprehensiveness of clusters is also assessed. The measures are assessed at the individual level first and then at the cluster level, where each cluster represents a combination of alternative fuel and transport mode. In this paper, only the “road” mode is relevant. Each individual measure that is part of the cluster can receive a “low”, “medium” or “high” score. The highest score assigned to any of the individual measures becomes the score for the cluster.
Because the electricity/road cluster reflects the assessment of measures that prominently cover passenger cars, it contributes little to our understanding of how NIR policies promote eLCVs and eHCVs directly. Alternatively, the relevant policies dedicated to EVs, listed as follows4:
• EV purchase subsidies: AT (€1,500-€10,000 for N1; €20,000 for N2; €50,000 for N3), CZ (for private business; not foreseen for private citizens), EE, HR, IE (including €3,800 for firms purchasing eLCVs), IT (up to €10,000 for BEV and up to €4,500 for PHEV), LT (planned), HU (including non-refundable grants to lease EVs), PT, RO (€10,000 for BEV and €4,250 for PHEV), SK (€5,000 for BEV and €3,000 for PHEV), FI (€2,000 for BEV to private persons and for long-term leases).
• Free parking or discounts: EE (in some cities).
• Tax allowance scheme/concession/incentives/relief (including accelerated depreciation): FR (benefit in kind tax reduction - 50% reduction with a maximum of €1,800 per year), IE (benefit in kind tax exemption/reduction), NL (favorable electricity tax in publicly accessible recharging points), PL (favorable vehicle tax depreciation for firms).
• Other tax reductions or exemptions: IE, RO.
Concerning policy measures targeting recharging points, a distinction can be made between private and publicly accessible infrastructure. While all5 the NIR indicated policies dedicated to publicly accessible recharging infrastructure, only half of them clearly stated policies in support of private recharging infrastructure: BE, CZ, DK, DE, IE, ES, FR, IT, MT, AT, PL, PT, FI, SE, UK (CY, LT, LU, LV and SI mentioned them, but either generically, as a legal measure or under consideration). Because of its importance to eHCVs, high power recharging infrastructure is worth singling out. Three such projects were highlighted in several NIRs: 1) EUROP-E, deploying 340 stations (with on average six points) in AT, BE, DK, FR, DE, IE, IT, NL, PL, PT, ES, SE and UK; 2) Central European Ultra Charging, deploying 118 points in AT (21), BG (4), CZ (21), HU (13), IT (38), RO (9) and SK (12); and 3) E-VIA FLEX-E with 14 stations ES (4), FR 2) and IT (8).
The assessment of measures undertaken in EC (2022), influenced by the reporting requirements of the Directive and the data received from the Member States, concerned the cluster hydrogen/road. This makes it challenging to disentangle the impact of measures for fuel cell road freight vehicles, for hydrogen can be used to power also passenger vehicles.
While there were policy measures targeting hydrogen, they tended to comprise also EVs (see Section 3.3.4). A specific policy targeting hydrogen by offering excise duty exemptions was found to be in place in NL and under discussion in IE. This can be seen as a direct way to tackle one of the relative weakness of FCEVs, their operating cost (given the low efficiency mentioned in Section 3.2.2 and the price of hydrogen). Only Germany received a “high” score for the policy measures.
Since the uptake of FCEVs has been limited to date, actions on research, technological development and demonstration (RTD&D) remain germane. Based on the NIR information (not available for all the Member States for the reason mentioned in Section 3.1), the level of ambition compared to the one exhibited in the NPF, was higher for twelve of them (BE, BG, DE, ES, FR, LT, AT, PL, PT, RO, SI, FI) and comparable for three (CZ, SE, UK).
Table 1 shows the measure assessment results for the cluster LNG/road. Under the assumption that LNG is in practice used only for HDV applications (HCVs and buses/coaches), it is possible to reinterpret these results as being supportive of LNG HCVs6. As can be seen, eight countries (CZ, DE, ES, FR, HR, IT, NL, FI) received a “medium” impact score, with eleven being given a “low” impact score (BE, IE, LV, LT, HU, PL, RO, SI, SK, SE, UK). A direct comparison among countries based on the information provided in this table should not be made, since the measures are assessed in the context of their potential to reach the AFV estimates of the respective country.
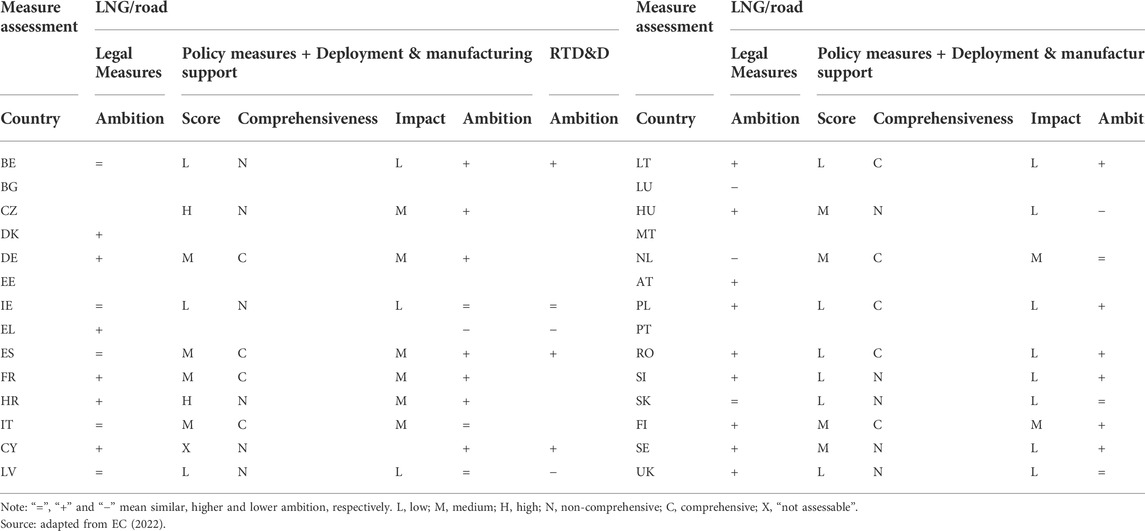
TABLE 1. Results of the measure assessment for LNG/road.
The views on the role to be played by LNG in road transport differ sharply. For instance, while the Danish NIR did not foresee deployment, the Polish NIR did. While the Austrian NIR conveyed caution about the development of LNG, a more prominent role for LNG HCVs was expected by neighbouring Germany.
The level of ambition of legal and RTD&D measures, if any, is reported, apart from hydrogen on RTD&D (as in the previous section), for LNG only. The available information on legal and RTD&D measures does not allow us to draw conclusions of relevance to road freight vehicles for the other fuels.
In contrast to LNG, the policy analysis of CNG is constrained by the applicability of this fuel to passenger vehicles, as in the case of hydrogen. Conversely to fuel cell technology, the maturity of CNG and LNG is high [as evidenced in EC (2015) and EC (2021c)]. Thus, the focus in this section is instead on listing those countries that explicitly mentioned financial support to road freight vehicles powered by CNG. Only IE and FI received a ‘high’ score for the policy measures. The views on the role CNG will be playing in road transport also varied. For instance, while the ambition on this fuel decreased in the SK NIR and LU NIR expected a declining fleet (except in the bus/coach market), the FI NIR expected a growing fleet and SI NIR revised its estimates upwards. Particularly in the HCV market, DE expects CNG to play an important role.
With regards to the individual measures targeting natural gas used in transport, the relevant ones are:
• Excise duty exemption: EE (for biomethane) and LT.
• Excise duty reduction: CZ, IE, FR, NL (favourable tax rate for CNG and temporary refund for LNG), SK (for CNG).
• Investment premium for new HCV: BE (for LNG; Walloon).
• Retrofitting: BE (investment premium in Walloon for LNG vehicle conversions), FI (financial aid for gas- and ethanol-powered vehicle conversions).
Complementing the policy measures identified in the previous sections, this section lists relevant policies that target several alternative fuels and electricity. For instance, policies promoting zero-emission vehicles (ZEVs) can be conceived as targeting electricity and hydrogen. The relevant measures [these refer mainly to the policy measures to ensure national targets and objectives, as highlighted in SWD (2022); for more details and extra measures see the corresponding NIR] are:
• Annual circulation/road tax/toll exemption: BE (Flanders), DE (exemptions for HCVs powered by electricity, hydrogen or natural gas in the toll scheme), HU, NL.
• Annual circulation/road tax/toll incentive or reduction: IE (in the process of adoption for HCVs powered by electricity, CNG, LNG or hydrogen), SK (50% reduction for hybrid, CNG, LNG and hydrogen vehicles).
• Free parking or discounts: FR (green disk for AFVs), RO (12 of the 41 administrative territorial units).
• Purchase grant/incentive/premium/subsidy for AFVs: ES (for LPG and natural gas (CNG, LNG) vehicles), IE (≤30% of the cost differential; in the process of adoption for HCVs powered by CNG or LNG), MT, PL (≤30% of the purchase cost for CNG/LNG M1, M2, N1-N3, L), RO (under consideration for CNG, LNG), SI (€4,500 for N1).
• Purchase grant/incentive/premium/subsidy for ZEVs: BE (Flanders), DE, ES, IE (≤30% of the cost differential; in the process of adoption for HCVs), LU (EVs and FCEVs), PL (≤30% of the purchase cost for M1, M2, N1-N3, L), RO (besides in place for EVs, under consideration also for hydrogen), UK (for vans and trucks).
• Bonus/malus or feebate system: FR, SE (covering also LCVs; HCVs included as procurement aid).
• Other tax reductions or exemptions: MT, PL, PT (depending on vehicle/fuel), FI (depending on fuel).
• Replacement of old/polluting vehicle: BE (for N1 in Brussels-Capital), IT (for old HCVs being replaced by new ones powered by electricity, CNG or LNG).
• Scrappage scheme (with or without replacement): FR, FI, MT, RO.
• Tax allowance scheme/concession/incentives/relief (including accelerated depreciation): AT (for CNG and hydrogen), FR (accelerated depreciation for HCVs powered by electricity, ethanol, hydrogen or natural gas), HU, IE (accelerated capital allowance support scheme regarding corporate tax when purchasing electric and CNG vehicles and related infrastructure; under consideration for hydrogen), LU, NL (environmental investment deduction allowance applicable also to LCVs and lower income tax liability for business users), SE (benefit in kind tax reduction).
• Vehicle registration tax reduction or exemption: DK, LT, NL, PL, SK (50% reduction for hybrid, CNG, LNG and hydrogen vehicles), FI (depending on vehicle/fuel).
No policy measures of a financial nature related to road freight vehicles were identified for CY, EL and LV.
Besides the need to mitigate greenhouse gas emissions to meet European climate goals, there is an economic argument for reducing the external cost of the most emitting road freight vehicle powertrains. The comparison of the various fuel/technologies allowed us to highlight those existing vehicle options that yield and are expected to deliver faster emission reductions to the European road freight transport system. As expected, the European data show that GHG emissions differ by the type of road freight vehicle and the source of energy used to power it. Our key finding of the decarbonization analysis is that the different data sources on emissions point to BEVs being the most attractive option of the ones within the scope of the present paper.
We found that explicit NIR information on road freight vehicles varied by country and was overall rather limited. With the available estimates, eLCVs are expected to greatly outperform CNG and hydrogen fuels in Europe in the future, as a comparison between the left charts in Figure 5 (ca. 1.2 million eLCVs in 2030) and Figure 6 (almost 185,000 units, of which 142,000 powered by CNG) shows. Conversely, their right charts illustrate a HCV market for alternative fuels dominated by natural gas (almost 140,000 in 2030, with CNG and LNG accounting for 55% and 45%, respectively). Given this and the emissions level for CNG and LNG which makes them unfit for transport decarbonization, the role to be played by biomethane remains to be seen.
It is interesting to note that, on the supply side, eHCVs are currently being commercialized by all the major truck manufacturers active in Europe (though electric range for LH operation remains limited), whereas this is not the case for natural gas-powered HCVs. Our market analysis suggests that several barriers to the successful uptake of zero- and low-emission road freight vehicles remain, and this is perhaps best symbolized by the cautious approach in some NIRs towards fuel cell technology, reflected in turn in relatively low future estimates: less than 10,000 fuel cell HCVs were reported in the NIRs for 2030.
Our policy analysis suggests that the responses to decarbonize road freight have so far been rather weak and lag behind the efforts exerted on road passenger transport. Overall, we do not find evidence of the existence of common national policies across Europe. We find wide differences in the strength of policy support by country, freight vehicle type and fuel. For instance, publicly accessible LNG infrastructure in the EU27 + UK is expected to increase by at least 345% between 2020 and 2030, while the estimated stock of LNG HCVs grows by at least a factor of ten over the same period [cf. scenarios reported in SWD (2021)]. However, no country received a “high” impact on the measure assessment for LNG/road. Thus it seems that national policy-makers do not perceive any urgent need for greater policy action to support that development. It is unclear whether this can be traced to confidence that the private sector will be delivering on this front (as some NIRs seem to suggest) or as a result of the aforementioned limited potential for GHG emissions reduction this option offers. Few dedicated measures supporting biomethane were communicated in the NIRs (EE, FI, FR, IE) but it can be assumed that some communicated in the NPFs continue to be valid (CZ, SE, UK) [for a more detailed analysis of the NPFs regarding this topic refer to Prussi et al. (2021)].
We reach the conclusion that, despite some progress, stronger action is needed to timely decarbonize road freight transport in Europe. This is in line with the conclusion reached by EP (2021) in its analysis of AFI for HDVs. Our key finding is that more effective policies are needed to increase the score of various clusters and reduce the inter-country differences. The future actions may consist not only of policy packages addressing specifically road freight vehicles but also of further R&D for certain processes and applications.
While energy taxation is not the focus of Directive 2014/94/EU (the relevant European legislation on this is the Energy Taxation Directive), the NPFs and NIRs typically reported tax incentives for alternative fuels. However, there were discrepancies in policy support by countries towards certain fuels. Taking into account that energy costs represent a large share of the total cost of ownership of road freight vehicles and the international dimension of freight operations, a closer harmonization of energy taxation would perhaps be beneficial in Europe. While there are minimum excise duty rates laid down in the Energy Taxation Directive (EU, 2003), the proposed revision of this Directive (EC, 2021e) may thus be opportune. According to EC (2021f), such revision would “help facilitate the transition away from fossil fuels towards clean fuels” as the new energy taxation rules would “remove outdated exemptions and incentives for the use of fossil fuels” (unpaged). Additionally, the recent events of war and high energy prices might be leading to a reconsideration of the policy support to natural gas for road freight vehicles in Europe. It is still too early to assess this.
By comparing the European performance with the global uptake, such impetus for policy action appears necessary if Europe is to reduce its gap with China, at least in the arena of eHCVs. In our assessment, we found references to specific initiatives such as the European Battery Alliance (EC, 2018). While this is most likely to be a beneficial strategic move from Europe to hedge against battery supply bottlenecks, it does not necessarily tackle resource availability. An explicit reference to a policy measure centered on battery recycling was found only in the RO NIR. The resource base that supports the alternative fuel options must thus be taken into account when promoting them.
We found large differences in emissions values for LCVs due to the reporting metric. CE-Delft (2020) highlighted the mixed purposes (passenger and freight) LCVs have and reported external costs in both the vkm and tkm metric, assuming a payload of 0.7 tonnes. In later work, the authors questioned the usefulness of the tkm metric for LCVs (EEA, 2020). We tried to overcome this by reporting their values for tkm in Figure 1 and showing also Figure 3 with the vkm metric. Besides this complication, the key limitation of our work was related to the quantity and quality of data, which was reflected in a series of issues:
• Some NIRs included information about strategic documents (e.g., BG, EL). While this helps the reporting country claim alternative fuels were considered in their NIRs, without further details the scope for analysis becomes very limited.
• Some NIRs did not disaggregate certain fuel types sufficiently. For instance, FR, SE or UK did not distinguish between CNG and LNG vehicles.
• For certain fuels (prominently hydrogen), national strategies were still pending when the NIR was notified. For instance, the Austrian Hydrogen Strategy.
Our analysis of the potential impact of RTD&D on AFV uptake (and in turn emissions) has been constrained by insufficient data. With better data, inferential statistical analysis [see e.g., Fernández Fernández et al. (2018)] could be conducted.
The most important limitation is perhaps due to the fact that the figures showing future AFI targets and road freight vehicle estimates exclude those countries that did not communicate these in their NIR. In a sense this exercise represented a missed opportunity for some of them. Our analysis was thus constrained by data availability and we highlight the need for improvements in data reporting by countries, including the communication of future vehicle estimates and infrastructure targets. The present paper can be used as a point of reference on road freight transport issues for future NIRs. Moreover, it can be used by researchers willing to compare the European policies supporting the uptake of alternative fuels in this market with those of other countries.
We did not attempt to quantify the changes in GHG emissions associated with uptake of different fuels and powertrain technologies in the road freight transport system. A prerequisite for successful completion of such modelling task is, however, the availability of a comprehensive and accurate dataset. The outcomes of the present study indicate that this might represent a challenge.
Ghisolfi et al. (2022) called for the development of methods that can study the interaction of policy measures. The present paper puts at the disposal of the modeling community a collection of real-world policy measures that can be represented in their models. As an example, work is ongoing to capture some of the policies listed in Section 3.3.4 in the Powertrain Technology Transition Market Agent Model (PTTMAM, 2022). Certain Member States [e.g., AT, DE, ES and BE (in the latter, the NIR was in fact structured by region)] provided information on regional measures. Thus with the available data, further research may be done by analyzing regional measures.
The impossibility of disentangling which proportion of AFI is devoted to certain vehicle types, particularly for electricity and HCVs, is also worth stressing. This might be addressed in the follow-up to Directive 2014/94/EU. The Commission recently proposed that this Directive should become a Regulation, which made clearer provisions to HDVs (EC, 2021c). As a matter of fact, we have perceived a growth in interest in this topic in the last 2 years (see the Supplementary Material).
The cautions expressed by Hao et al. (2019) about potential material supply constraints must also be taken into account when considering road freight electrification. Other alternative fuels and technologies besides the ones examined here may help decarbonize road freight transport (recall Figure 2) but these were not examined in this paper because they fell outside the realm of Directive 2014/94/EU or because NIR data were insufficient. In the case of LPG, which was one of the alternative fuels defined in the Directive, its phase-out seemed to be in prospect in some NIRs. It will be worthwhile to investigate these options.
While the framework of analysis has remained road transport, it is well known that modal shifts may support decarbonization. In their analysis of EU transport, Andrés and Padilla (2018) concluded that among the most effective actions would be the shift from road to rail. While their analysis was based on the 2011 Transport White Paper, additional research is needed to analyze the most recent policies proposed by European legislators. Of particular relevance to this study are the actual impacts of the proposed revision of Regulation (EU) 2019/631 (EC, 2021b), of the “Eurovignette” as well as of Regulation (EU) 2019/1242 (EU, 2019).
The datasets presented in this study can be found in online repositories. The names of the repository/repositories and accession number(s) can be found in the article/Supplementary Materials.
Conceptualization: AM, AJ, CL, and JGV; Data analysis and visualization: All; Writing - original draft: JGV; Writing - review & editing: AM, AJ, and CL; Supervision: AM.
We are grateful to our colleagues Alois Krasenbrink, Beatriz Acosta Iborra, Dominika Klassek-Bajorek, Matteo Prussi and Robert Loos for helping us assess the NIRs and to our colleagues Nicolae Scarlat and Christian Thiel for sharing the data used to generate Figure 2 and their helpful remarks. We are also grateful to colleagues from other Directorates-Generals for their feedback. Finally, we thank the journal reviewers and an internal JRC reviewer.
Author CL was employed by the company Piksel Srl.
The remaining authors declare that the research was conducted in the absence of any commercial or financial relationships that could be construed as a potential conflict of interest.
The views expressed are purely those of the authors and may not in any circumstances be regarded as stating an official position of the European Commission.
All claims expressed in this article are solely those of the authors and do not necessarily represent those of their affiliated organizations, or those of the publisher, the editors and the reviewers. Any product that may be evaluated in this article, or claim that may be made by its manufacturer, is not guaranteed or endorsed by the publisher.
The Supplementary Material for this article can be found online at: https://www.frontiersin.org/articles/10.3389/fenrg.2022.897916/full#supplementary-material
1See the Glossary, which also includes the acronyms for the Member States.
2The results are based on the premise that LCV and HCV have a payload of 0.3 and 12 tonnes, respectively. The same authors indicate that the emissions level goes down to 1,098 gCO2/tkm if a payload of 0.7 tonnes is assumed for LCVs. Note that the original study refers to light-duty and heavy-goods vehicles instead of the acronyms used here.
3Referred to as Type 4 and Type 5, respectively, in the original study. They represent Group 4 and Group 5 HCVs, respectively, and could be seen as comparable to the sub-groups 4-RD in 5-LH in EU (2019).
4Although we first tried to verify whether the policy measure stated in the NIR was applicable also to road freight vehicles, this was not always possible as certain measures were described for vehicles in general. When in doubt, we opted for being inclusive.
5The exception was the EL NIR, which mentioned that the national operational plan for the deployment of electromobility was under preparation with a proposal expected by 30 June 2020.
6Two examples: the LT NIR reported 50 LNG LCVs in 2030, which we consider a possible inaccuracy and interpret this value as referring to HCVs. In the case of SI, the information provided in the NIR on LNG vehicles seems to refer only to HCVs.
ACEA (2021). Overview – electric vehicles: Tax benefits & purchase incentives in the European Union (2021). European automobile manufacturers’ association (ACEA). Retrieved from https://www.acea.auto/fact/overview-electric-vehicles-tax-benefits-purchase-incentives-european-union-2021/.
Andrés, L., and Padilla, E. (2018). Driving factors of GHG emissions in the EU transport activity. Transp. Policy 61, 60–74. doi:10.1016/j.tranpol.2017.10.008
CE-Delft (2020). Handbook on the external costs of transport Report commissioned by European Commission. Version 2019 – 1.1. Retrieved from https://op.europa.eu/en/publication-detail/-/publication/9781f65f-8448-11ea-bf12-01aa75ed71a1/language-en.
EAFO (2021). European alternative fuels observatory (EAFO). European Commission. Retrieved from www.eafo.eu.
EC (2019). Assessment of the MS National Policy Frameworks for the development of the market as regards alternative fuels in the transport sector and the deployment of the relevant infrastructure pursuant to Article 10(2) of Directive 2014/94/EU. STAFF WORKING DOCUMENT SWD/2019/0029.
EC (2020a). Determining the environmental impacts of conventional and alternatively fuelled vehicles through LCA. Final report by ricardo energy & environment for final report for the European Commission (EC) DG climate action. Retrieved from https://op.europa.eu/en/publication-detail/-/publication/1f494180-bc0e-11ea-811c-01aa75ed71a1.
EC (2021a). Detailed Assessment of the Member States Implementation Reports on the National Policy Frameworks for the development of the market as regards alternative fuels in the transport sector and the deployment of the relevant infrastructure. Retrieved from https://eur-lex.europa.eu/legal-content/EN/TXT/?uri=CELEX%3A52021SC0049.
EC (2021e). Proposal for a COUNCIL DIRECTIVE restructuring the Union framework for the taxation of energy products and electricity. European Commission (EC). . Retrieved from https://eur-lex.europa.eu/legal-content/EN/TXT/?uri=CELEX%3A52021PC0563.
EC (2021b). Proposal for a REGULATION OF THE EUROPEAN PARLIAMENT AND OF THE COUNCIL amending Regulation (EU) 2019/631 as regards strengthening the CO2 emission performance standards for new passenger cars and new light commercial vehicles. Retrieved from https://eur-lex.europa.eu/legal-content/en/TXT/?uri=CELEX%3A52021PC0556.
EC (2021c). Proposal for a REGULATION OF THE EUROPEAN PARLIAMENT AND OF THE COUNCIL on the deployment of alternative fuels infrastructure, and repealing Directive 2014/94/EU of the European Parliament and of the Council. European Commission (EC). Retrieved from https://ec.europa.eu/info/sites/default/files/revision_of_the_directive_on_deployment_of_the_alternative_fuels_infrastructure_with_annex_0.pdf.
EC (2021f). Revision of the energy taxation directive (ETD): Questions and answers. European Commission (EC). Retrieved from https://ec.europa.eu/commission/presscorner/detail/en/qanda_21_3662.
EC (2018). Speech by vice-president for energy union Maroš Šefčovič at the industry days forum on the industry-led initiative on batteries/the EU battery alliance. Press release database. European Commission (EC). Retrieved from http://europa.eu/rapid/press-release_SPEECH-18-1168_en.htm.
EC (2020b). State of the art on alternative fuels transport systems in the European Union - 2020 update. European Commission (EC). Retrieved from https://op.europa.eu/en/publication-detail/-/publication/fd62065c-7a0b-11ea-b75f-01aa75ed71a1.
EC (2015). State of the art on alternative fuels transport systems in the European Union European Commission. Final report. Retrieved from https://ec.europa.eu/transport/sites/transport/files/themes/urban/studies/doc/2015-07-alter-fuels-transport-syst-in-eu.pdf.
EC (2021d). Statistical pocketbook 2021. EU transport in figures. European Commission (EC). Retrieved from https://op.europa.eu/en/publication-detail/-/publication/14d7e768-1b50-11ec-b4fe-01aa75ed71a1.
EC (2022). Updated detailed assessment of the member states implementation reports on the national policy frameworks for the development of the market as regards alternative fuels in the transport sector and the deployment of the relevant infrastructure. Staff Working Document SWD(2022) 33. European Union: European Commission (EC). Retrieved from https://transport.ec.europa.eu/system/files/2022-03/SWD_2022_33.pdf.
EEA (2021). CO2 emissions from heavy-duty vehicles. European Environment Agency (EEA). Retrieved from https://discomap.eea.europa.eu/app/CO2HDV/.
EEA (2020). Methodology for GHG efficiency of transport modes. Final report by fraunhofer ISI and CE delft. Karlsruhe: Comissioned by European Environment Agency. (EEA).
EP (2021). Alternative fuel infrastructures for heavy-duty vehicles. Study by CE Delft, requested by the European Parliament (EP)’s Committee on Transport and Tourism. Retrieved from https://www.europarl.europa.eu/RegData/etudes/STUD/2021/690888/IPOL_STU(2021)690888_EN.pdf.
EU (2003). Council Directive 2003/96/EC of 27 October 2003 restructuring the Community framework for the taxation of energy products and electricity. Official Journal of the European Union (EU). Retrieved from https://eur-lex.europa.eu/legal-content/EN/TXT/?uri=celex%3A32003L0096.
EU (2014). Directive 2014/94/EU of the European parliament and of the Council of 22 october 2014 on the deployment of alternative fuels infrastructure. Official journal of the European Union (EU). Retrieved from https://eur-lex.europa.eu/legal-content/en/TXT/?uri=CELEX%3A32014L0094.
EU (2019). REGULATION (EU) 2019/1242 OF THE EUROPEAN PARLIAMENT AND OF THE COUNCIL of 20 June 2019 setting CO2 emission performance standards for new heavy-duty vehicles and amending Regulations (EC) No 595/2009 and (EU) 2018/956 of the European Parliament. Retrieved from https://eur-lex.europa.eu/eli/reg/2019/1242/oj.
Fernández, Y. F., Fernández López, M. A., and Olmedillas Blanco, B. (2018). Innovation for sustainability: The impact of R&D spending on CO2 emissions. J. Clean. Prod. 172, 3459–3467. doi:10.1016/j.jclepro.2017.11.001
Ghisolfi, V., Tavasszy, L. A., Correia, G. H. d. A., Chaves, G. d. L. D., and Ribeiro, G. M. (2022). Freight transport decarbonization: A systematic literature review of system dynamics models. Sustainability 14, 3625. doi:10.3390/su14063625
Gómez Vilchez, J. J., Julea, A., Lodi, C., and Marotta, A. (2022). An analysis of trends and policies promoting alternative fuel vessels and their refueling infrastructure in Europe. Front. Energy Res. 10, 904500. doi:10.3389/fenrg.2022.904500
Hao, H., Geng, Y., Tate, J. E., Liu, F., Chen, K., Sun, X., et al. (2019). Impact of transport electrification on critical metal sustainability with a focus on the heavy-duty segment. Nat. Commun. 10 (1), 5398. doi:10.1038/s41467-019-13400-1
ICCT (2021). Total cost of ownership for tractor-trailers in europe: Battery electric versus diesel. White paper. The international Council on clean transportation (ICCT). Retrieved from https://theicct.org/sites/default/files/publications/TCO-BETs-Europe-white-paper-v4-nov21.pdf.
IEA (2021). Global EV data explorer. International energy agency (IEA). Retrieved from https://www.iea.org/articles/global-ev-data-explorer.
IEA (2017). ). The future of trucks - implications for energy and the environment. International Energy Agency (IEA). Retrieved from https://www.iea.org/publications/freepublications/publication/TheFutureofTrucksImplicationsforEnergyandtheEnvironment.pdf.
JRC (2022). Transport alternative fuels infrastructure data collection. Joint research Centre (JRC) data catalogue. European Commission. Retrieved from https://data.jrc.ec.europa.eu/collection/id-00352.
Martulli, A., Galvin, R., and Ruzzenenti, F. (2021). Evolution of energy and exergy efficiency in the European road freight industry, 1978–2018. Front. Energy Res. 9, 609077. doi:10.3389/fenrg.2021.609077
Prussi, M., Julea, A., Lonza, L., and Thiel, C. (2021). Biomethane as alternative fuel for the EU road sector: Analysis of existing and planned infrastructure. Energy Strategy Rev. 33, 100612. doi:10.1016/j.esr.2020.100612
Prussi, M., Yugo, M., De Prada, L., Padella, M., and Edwards, R. (2020). JEC Well-To-Wheels report v5, EUR 30284 EN. Luxembourg: Publications Office of the European Union. 978-92-76-20109-0.
PTTMAM (2022). Powertrain technology transition market agent model (PTTMAM). Retrieved from https://joint-research-centre.ec.europa.eu/scientific-tools-and-databases/powertrain-technology-transition-market-agent-model-pttmam/powertrain-technology-transition-market-agent-model-pttmam_en.
Sen, B., Ercan, T., and Tatari, O. (2017). Does a battery-electric truck make a difference? – life cycle emissions, costs, and externality analysis of alternative fuel-powered Class 8 heavy-duty trucks in the United States. J. Clean. Prod. 141, 110–121. doi:10.1016/j.jclepro.2016.09.046
SWD (2021). IMPACT ASSESSMENT accompanying the proposal for a regulation of the European parliament and of the Council on the deployment of alternative fuels infrastructure. STAFF Work. Doc. SWD, 631. Retrieved from https://eur-lex.europa.eu/legal-content/EN/TXT/?uri=CELEX:52021SC0631.
T&E (2021). LNG trucks: A dead-end bridge. Emissions testing of a diesel- and gas-powered long-haul truck. Transport & enviroment (T&E). Retrieved from https://www.transportenvironment.org/wp-content/uploads/2021/09/202109_TE_LNG_trucks_a_dead_end_bridge_final.pdf.
Tsakalidis, A., Krause, J., Julea, A., Peduzzi, E., Pisoni, E., and Thiel, C. (2020). Electric light commercial vehicles: Are they the sleeping giant of electromobility? Transp. Res. Part D Transp. Environ. 86, 102421. doi:10.1016/j.trd.2020.102421
UNECE (2014). Consolidated resolution on the construction of vehicles. United Nations economic commission for Europe (UNECE). Retrieved from https://www.unece.org/fileadmin/DAM/trans/main/wp29/wp29resolutions/ECE-TRANS-WP29-78-r3e.pdf.
UNFCCC (2021). Greenhouse gas emissions data. Time series. United Nations framework convention on climate change (UNFCCC). Retrieved from http://di.unfccc.int/time_series.
AFI alternative fuels infrastructure
AFV alternative fuel vehicles
AT Austria
BEV battery electric vehicles
BE Belgium
BG Bulgaria
CI Compression ignition
CNG compressed natural gas
CY Cyprus
CZ Czech Republic
DE Germany
DK Denmark
ED95 ethanol diesel (95%)
EE Estonia
EL Greece
ES Spain
EU European Union
FI Finland
FR France
FCEV fuel cell electric vehicles
GHG greenhouse gas
GVW gross vehicle weight
(e)HCV (electric) heavy commercial vehicles
HDV heavy-duty vehicles
HPDI high pressure direct injection
HR Croatia
HU Hungary
HVO hydrotreated vegetable oil
IE Ireland
IT Italy
LCA lifecycle assessment
(e)LCV (electric) light commercial vehicles
LDV light-duty vehicles
LH long-haul
LNG liquefied natural gas
LPG liquefied petroleum gas
LT Lithuania
LU Luxembourg
LV Latvia
MT Malta
NIR national implementation report
NL The Netherlands
NPF national policy framework
PHEV plug-in hybrid electric vehicles
PI positive ignition
PL Poland
PT Portugal
RD regional delivery
RO Romania
RTD&D Research, technological development and demonstration
SE Sweden
SI Slovenia
SK Slovakia
TEN-T Trans-European Network for Transport
tkm tonne-kilometer
TTW tank-to-wheel
UD urban delivery
UK United Kingdom
vkm vehicle-kilometer
WTT well-to-tank
WTW well-to-wheel
Keywords: alternative fuels, charging infrastructure, electric vehicle, energy policy, freight transport, goods transport, powertrain technologies, road freight
Citation: Gómez Vilchez JJ, Julea A, Lodi C and Marotta A (2022) An analysis of trends and policies supporting alternative fuels for road freight transport in Europe. Front. Energy Res. 10:897916. doi: 10.3389/fenrg.2022.897916
Received: 16 March 2022; Accepted: 30 August 2022;
Published: 27 September 2022.
Edited by:
Helena Martín, Universitat Politecnica de Catalunya, SpainReviewed by:
Arnaldo Walter, State University of Campinas, BrazilCopyright © 2022 Gómez Vilchez, Julea, Lodi and Marotta. This is an open-access article distributed under the terms of the Creative Commons Attribution License (CC BY). The use, distribution or reproduction in other forums is permitted, provided the original author(s) and the copyright owner(s) are credited and that the original publication in this journal is cited, in accordance with accepted academic practice. No use, distribution or reproduction is permitted which does not comply with these terms.
*Correspondence: Jonatan J. Gómez Vilchez, am9uYXRhbi5nb21lei12aWxjaGV6QGVjLmV1cm9wYS5ldQ==
Disclaimer: All claims expressed in this article are solely those of the authors and do not necessarily represent those of their affiliated organizations, or those of the publisher, the editors and the reviewers. Any product that may be evaluated in this article or claim that may be made by its manufacturer is not guaranteed or endorsed by the publisher.
Research integrity at Frontiers
Learn more about the work of our research integrity team to safeguard the quality of each article we publish.