 Madina Primbetova1
 Ihtisham ul Haq
- 1College of Economics and Trade, Hunan University, Changsha, China
- 2Department of Mathematical Economics, Tashkent State University of Economics, Tashkent, Uzbekistan
- 3Department of Economics, Kohat University of Science and Technology, Kohat, Pakistan
As a consequence of globalization, the world’s economies are merging; nonetheless, concerns about how globalization trends may harm the environment locally and worldwide are growing. The globalization-environment nexus has now become a contentious issue among policymakers. As a result, several empirical research studies on the globalization-environment nexus have been conducted. In the context of the environmental Kuznets curve theory, this study explores the influence of globalization on environmental deterioration in Kazakhstan (EKC). Furthermore, energy is a control variable in this research. Unit roots and structural break are used to solve the issue of non-stationarity in time series. The autoregressive distributed lagged (ARDL) model is used in this research for long run relationships between variables as well as to estimate long run and short run coefficients. Income, energy, and globalization are discovered to have a long-term link. Furthermore, the findings revealed that long-term environmental deterioration was exacerbated by economic, political, and social globalization, since these factors were shown to have a positive impact on carbon emissions in Kazakhstan. Energy is to blame for environmental damage both in the short and long term. Furthermore, this research reveals that the EKC theory exists in Kazakhstan. On the basis of the findings, policy suggestions are made.
Introduction
Since gaining independence, Kazakhstan has been one of the fastest-growing transitional economies. For example, between 2000 and 2014, Kazakhstan’s yearly growth rate stayed over 7%; Kazakhstan is Central Asia’s largest economy. Kazakhstan, on the other hand, is confronting environmental concerns, as carbon emissions surged by more than 80% between 2000 and 2014, and Kazakhstan has the highest carbon emissions per capita in Central Asia. Kazakhstan also has one of the world’s highest carbon intensity economies (World Bank, 2021). Agriculture, industry, municipal, and transportation emissions are Kazakhstan’s main sources of pollution. As a result, climate change poses a serious danger to Kazakhstan’s economic development, energy security, and living standards.
Globalization refers to the increasing interdependence of nations via trade and distribution of products and services, capital transfers, financial inclusion, technology transfer, and information dissemination. It has aided economic development in many nations and has a direct impact on socioeconomic, environmental, and political aspects. Recent globalization trends have increased concerns that globalization may jeopardize environmental sustainability in nations with weak environmental legislation, since globalization encourages filthy sectors (Copeland and Taylor 2004). As a result of globalization, industrialization increased energy consumption, resulting in higher emissions in the future; as a result, the quality of the environment is jeopardized. Deforestation, substantial crop decrease, ozone layer degradation, sea level rise, habitat loss, floods, draughts, storms, and earthquakes have all drawn attention to global warming and climate change in recent decades (Shahbaz et al., 2017).
Globalization has economic, political, and social dimensions (Dreher, 2006). Trade, foreign direct investment (FDI), and portfolio investment are all part of economic globalization, as are foreign income payments if a nation employs foreigners in manufacturing. Trade limitations, import barriers, tariffs, and limits on foreign capital are all factors in economic globalization. Public policy, the number of embassies, involvement in the number of United Nations peacekeeping operations, and membership in international organizations are all factors in political globalization. In terms of the social component of globalization, it considers ideas and information flows, people interactions, internet users, radio stations, and international tourism (KOF Swiss Economic Institute, 2021). Each component of globalization, however, has an impact on the environment; it can deteriorate environmental quality by enhancing economic activities, or it can improve environmental quality by disseminating information and raising awareness of best production practices that promote environmentally sustainable energy use in economic operations. Furthermore, globalization aids countries involved in international environmental and climate change talks in complying with international environmental standards (Shahbaz et al., 2013).
In the face of global warming and climate change, the globe is confronted with environmental issues, and Kazakhstan is no different. Kazakhstan has the greatest per capita amount of greenhouse gas emissions in Central Asia, with over 366 million tonnes of carbon dioxide equivalent (World Bank, 2021). Researchers have been drawn to the relationship between globalization and environmental damage. However, there are few empirical research on the topic in Central Asia, and no one has looked into the globalization-carbon emissions nexus in Kazakhstan. As a result, our research addresses this vacuum and adds the instance of Kazakhstan to the current ecological economics literature. Furthermore, Central Asian economies are transitional economies that have encouraged globalization during the past 3 decades, therefore examining the impact of globalization on the environment is vital not just for Kazakhstan but also for the Central Asian area. Furthermore, the findings of this research will aid policymakers in dealing with environmental challenges.
Literature Review
Theoretical Frame Work
Trade liberalization and freer trade are globalization’s drivers and expressions. According to trade theories, trade liberalization increases the efficiency of resource allocation to producers who produce at the lowest cost. However, if all relevant social and environmental costs are included into the cost of natural and environmental resources, global production may be created at the lowest environmental cost owing to freer commerce. Trade liberalization may thereby improve societal welfare and sustainability. Market failure, on the other hand, might manifest itself as unpriced, underpriced, or unaccounted-for externalities, or policy failures in the form of subsidies that are incompatible with environmental norms, thus trade liberalization may result in resource misallocation. However, trade liberalization may still have good consequences (efficiency improvements), but it will also have negative impacts when resources are exhausted, resulting in environmental deterioration. The degree of positive and negative impacts determines the net benefit from trade liberalization (Panayotou, 2000).
Through a variety of ways, globalization has an impact on the natural environment and environmental quality. These channels are covered in great length in this article. Globalization’s scale impact refers to a rise in economic activity and revenue generating. There would be an increase in the aggregate level of natural resources and environmental degradation, and the scale effect’s negative impacts would be more pronounced where market failure and regulatory failure prevail. The income impact has a range of effects on the environment. Increased income causes environmental externalities as well as increased consumption. Furthermore, higher wealth raises environmental consciousness and increases governmental and private environmental spending, resulting in improved environmental quality. Globalization aids in the restructuring of the economy, which is based on a country’s comparative advantage in natural resources. Globalization tends to change the economic structure from resource extraction and processing to manufacturing and eventually to a service-based economy if a country is not facing market or policy failure and if stage of development and scale effects are taken into account; this refers to the structural effects of globalization that improve the country’s environmental quality. Globalization’s benefits to sustainable development, on the other hand, are contingent on whether environmental resources are adequately valued or if globalization-induced structural changes boost unsustainable activity.
The dispersion of goods, technology, ideas, and industrial methods between nations is another way that globalization impacts the environment. Environmentally preferable product trade is a significant contributor to environmental deterioration; the global market is worth around one trillion dollars per year, and it has the potential to grow rapidly (OECD 2012, 2012). On the production side, globalization boosts demand for more efficient capital and greener technology, while on the consuming side, greener items such as low-emission automobiles, organic foods, and recycling expand the potential market for environmentally friendly products. Other aspects of globalization, such as intellectual property rights and investment, also have technical consequences that affect the environment. Demand and supply variables, as well as policy consequences, are all affected by technological changes. On the demand side, corporations are under pressure from authorities, shareholders, consumers, and society to embrace greener manufacturing techniques. In rich nations, Henriques and Sadorsky (1996) suggest that regulatory pressure is a possible driver of greener technology, but in underdeveloped countries, Panayotou (1997) claim that community pressure is a critical determinant of environmental concern.
Empirical Studies
The EKC hypothesis, which depicts an inverted U-shaped association between per capita and environmental degradation, originates from the work of Grossman and Krueger (1991) on the North American Free Trade Agreement (NAFTA), as there are concerns of researchers, environmentalists and policy-makers about free trade and its effect on the environment. The EKC hypothesis postulates that a rise in income is accompanied by environmental degradation in the early stage of development; however, after a certain level of income, a rise in income is not accompanied by environmental degradation. If one considers the environment to be a normal good, then a rise in income due to trade or economic growth will enhance demand for environmental quality, and a high level of income will increase the ability of governments to meet costly environmental protection investments (Copeland and Taylor, 2004).
Many research studies have been conducted to investigate the EKC hypothesis, both in panel and time series investigations; however, we will focus on time series studies in this study. Acaravci and Ozturk (2010), for example, conducted a research including nineteen European nations to investigate the EKC hypothesis. They did, however, come to the conclusion that the EKC hypothesis was only viable in Denmark and Italy. Similarly, Pao and Tsai (2010) did an empirical analysis for the BRIC countries of Brazil, Russia, India, and China and found that the EKC hypothesis is verified in China, India, and Russia. In China and India, Jayanthakumaran et al. (2012) verified the EKC hypothesis by looking at the link between carbon emissions and per capita income while taking trade liberalisation into account. Shahbaz et al. (2015a) did not find evidence for the EKC theory in China, but did find evidence for it in India. Nasir and Rehman (2011) used a time series investigation to establish the link between carbon emissions and per capita income in Pakistan, confirming the EKC hypothesis. In a similar vein, Saboori and Sulaiman (2013) investigated the EKC hypothesis in five ASEAN nations (ASEAN). They came to the conclusion that Singapore and Thailand had the EKC theory. In a similar research, Shahbaz et al. (2015b) looked at 12 African nations and found that the EKC hypothesis is only true in Congo, Ethiopia, South Africa, and Togo.
In the framework of the EKC hypothesis, Haq et al. (2016) looked at the impact of trade openness on carbon emissions. They discovered that trade openness did not worsen environmental deterioration in Morocco since it has a long-term negative relationship with carbon emissions. Furthermore, the study’s findings in Morocco did not support the EKC theory. Using the ARDL bounds testing technique, Shahbaz et al. (2016) investigated the impact of globalisation on carbon emissions in African nations. Globalization increases carbon emissions in Ghana, Morocco, South Africa, Sudan, and Tanzania, whereas it reduces carbon emissions in Angola, Cameroon, Congo, Kenya, Libya, Tunisia, and Zambia, according to this research. In addition, the study’s findings confirmed the EKC theory in Algeria, Cameroon, Congo, Morocco, Tunisia, and Zambia; however, the EKC hypothesis was not confirmed in Sudan and Tanzania.
Khan and Ullah (2019) investigated the effect of globalization on carbon emissions along with other important factors in Pakistan by applying the dynamic ARDL technique over time series data from 1972 to 2016. The results of the study showed that economic, political and social globalization has a positive effect on carbon emissions in the long run as well as in the short run. Thus, the study concluded that globalization aggravates environmental degradation in Pakistan. The study recommended that the government of Pakistan should encourage foreign investment in green energy projects for the sustainable economic development of Pakistan.
Thus, after discussing the related literature above, this study examines the impact of globalization on environmental degradation in the context of the EKC hypothesis through an empirical model that is depicted in Eq. 1 below:
The nonlinear combination of the model is transformed into log-linear as depicted in Eq. 2
where
Research Methodology
Data and Description of Variables
Various indicators can be used as proxies for environmental degradation; however, some researchers (Edoja, Aye, & Abu, 2016; Haq, Zhu, & Shafiq, 2016; Naradda Gamage et al., 2017) argue that carbon emissions are the most significant source of pollution, accounting for more than 75% of greenhouse gas emissions (Abbasi & Riaz, 2016). Furthermore, according to Tutulmaz (2015), carbon emissions are the most often used proxy for environmental deterioration, particularly when evaluating the EKC hypothesis. As a result, carbon emissions are used as a proxy for environmental deterioration in this research. The EKC hypothesis is investigated in most research projects, such as Saud et al. (2019) and Gasimli et al. (2019), by looking at carbon emissions per capita. As a result, while evaluating the EKC hypothesis, this research will also utilise carbon emissions per capita. The British Petroleum internet database provided statistics on carbon emissions (British Petroleum, 2021). However, it is divided by the total population obtained from the World Bank to arrive at per capita figures (2021). Similarly, the British Petroleum online database is used to gather statistics on energy use (British Petroleum, 2021). Similarly, based on Dreher’s assessment, statistics on globalization and its components (economic, political, and social) are gathered from KOF institutions (2006). Economic, political, and social globalization are the three aspects of the KOF Globalization Index. Each dimension’s index is calculated on a scale of one to 100, with 100 being the greatest value for each degree of globalization. The data on these dimensions has been standardized, and the data has a low sensitivity to outliers. Trade and financial globalization make up economic globalization, and both have a 50 percent weighting, whereas political globalization categories are equally weighted. Interpersonal, informational, and cultural globalization are all equally weighted components of social globalization. In addition, the World Development Indicators World Bank online database is used to obtain actual per capita statistics in US dollars (World Bank, 2021). This research used data from 1991 to 2018, and to solve the problem of a limited sample size for time series analysis, it used the quadratic sum technique to transform yearly time series data to quarterly data. As a result, this research includes quarterly data from 1991 to 2018, i.e., 1991Q1 to 2018Q4. The Description of Variables are described in Table 1.
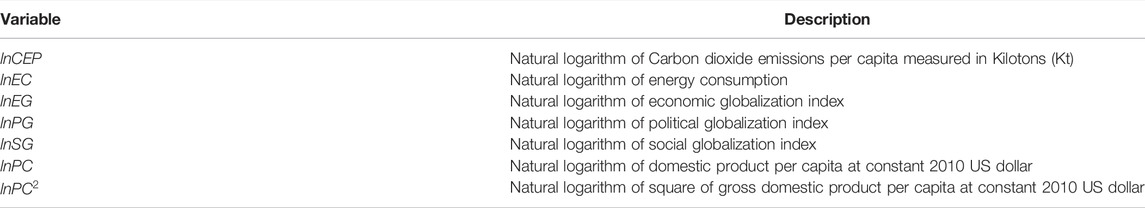
TABLE 1. Description of variables.
Research Techniques
Because time series data tend to trend over time and have nonstationarity issues, using conventional least squares may result in misleading regression. The nonstationarity issue may be solved by differencing variables; however, if a long-run link between variables exists, the differencing procedure may prevent it. The first and most important thing a researcher should do is check for nonstationarity in time series data; for this, the researchers will use the Kwiatkowski–Phillips–Schmidt–Shin (KPSS) test Kwiatkowski et al. (1992) and the Elliott–Rothenberg Stock (ERS) test in this study Elliott et al. (1996). In general, the augmented Dickey-Fuller (ADF) test (Dickey & Fuller, 1979) and Phillips-Perron (PP) test (Phillips & Perron, 1988) have extremely low power against I (0) alternatives that are near to being I (0) (1). These tests are known as efficient unit root tests, and they have much more power than ADF or PP unit root tests, particularly when is near to unity. Furthermore, Zivot and Andrew unit root tests will be used to see whether time series data have an unknown structure. This unit root test detects an unidentified structural flaw.
The cointegration technique is used next in a time series analysis to reveal long-term connections between variables. The autoregressive distributed lagged (ARDL) approach, also known as the limits testing strategy developed by Pesaran et al. (1996) and improved by Pesaran et al., was utilised in this study (2001). This ARDL may be used for long-run cointegration over typical processes such as the Johansen and Juselius (1990) cointegration approach due to various features. For starters, it can be employed on a small dataset with significant long-run cointegration that can be trusted (Boutabba, 2014). Second, this technique can accommodate dummy variables as well. For instance, a dummy is introduced for a structural break. Third, time series variables need not be integrated in the same order. The time series may be integrated using I (0), I (1), or a mix of I (0) and I (1), but no higher order than I will be used. Meo et al., 2018; Shahbaz et al., 2013). Fourth, the ARDL limits test separates dependent and independent variables while providing unbiased short- and long-run estimates. Furthermore, there are no endogeneity difficulties in the ARDL bounds test estimations (Narayan, 2005). The empirical model of this study can be presented in an unrestricted ARDL framework as follows:
Equation 3 is an error correction mechanism that gives us short run and long parameters, whereas
Against Alternative Hypothesis
H0: reveals that variables are not cointegrated in the long run, whereas the alternative hypothesis describes long-run cointegration. This cointegration test is based on two critical values that are lower and upper bounds (Pesaran et al., 2001; Narayan, 2005). One has to accept the alternative hypothesis if the estimated F value is greater than the upper bounds and has to accept a null hypothesis if the estimated F value is lower than the lower bounds. The test is inconclusive if the estimated F value is between the lower and upper bounds.
Results and Discussion
Descriptive Statistics and Results
Table 2 presents descriptive statistics. The descriptive statistics illustrate the mean, minimum, maximum and standard deviation of the data. The carbon emissions per capita mean is 2.72 tons along with its minimum value and maximum value of 1.66 and 3.68, respectively. Likewise, energy consumption per capita has a minimum value and maximum value of 86.16 and 188.64 kg of oil equivalent, respectively, whereas its mean value is 136.20 kg of oil equivalent. The economic globalization index mean is 49.08, and its minimum and maximum values are 23.080 and 61.07, respectively. The mean values of the political and social globalization indices are 56.21 and 53.36, respectively. During the study period, the minimum value of real income per capita was 3,713.98 USD and maximum value of 11,044.59 USD whereas mean income per capita is 6,951.37 USD.
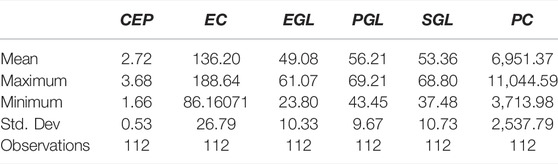
TABLE 2. Descriptive statistics.
Results of correlation are depicted in Table 3. It can be evidenced from the correlation results that energy consumption is highly correlated with carbon emissions and is followed by per capita income. The correlations of these mentioned variables are 0.99 and 0.64, respectively. Among indices of globalization, economic globalization is not only highly correlated compared to political and social globalization but also negatively correlated. Other than carbon emissions and energy consumption, economic globalization is positively correlated with the rest of the variables. Political and social globalization is positively correlated with carbon emissions. Likewise, political and social globalization are highly positively correlated with income per capita in Kazakhstan.
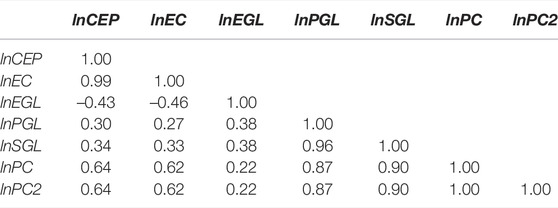
TABLE 3. Correlation results.
Before moving on to regression, it is important to check whether the data are stationary or nonstationary and to determine whether variables are integrated of I (0) or I (1). This study applied KPSS and ERS unit root tests. The results of the KPSS and ERS for all variables used in this study are presented in Table 4. The results of both unit root tests, KPSS and ERS, illustrate that carbon emissions per capita and energy consumption per capita are nonstationary when the variables are at level. Both of these variables became stationary by considering them at the first difference. Hence, carbon emissions per capita and energy consumption per capita are integrated of order I (1), whereas the rest of the variables of the study are integrated of order I (0). It can be concluded from unit root tests that the ARDL bounds test is the appropriate cointegration technique that can be applied for cointegration.
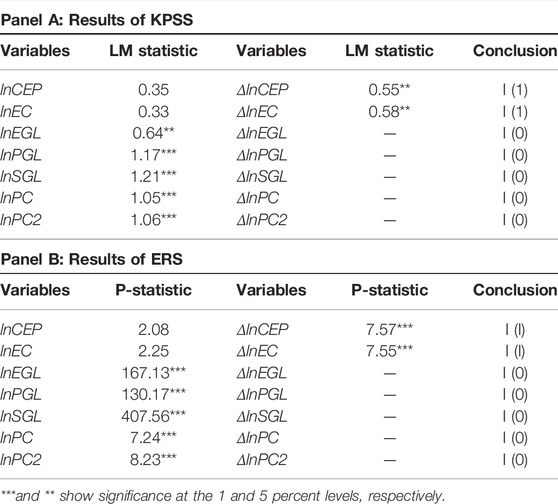
TABLE 4. Results of KPSS and ERS unit root tests.
To capture unknown structural breaks, the Zivot-Andrew unit root test will be conducted, so the results of the Zivot-Andrew unit root test with structural breaks are presented in Table 5. In the presence of structural breaks, all variables are integrated of order one. This means that all variables are stationary at the first difference in the presence of structural breaks.
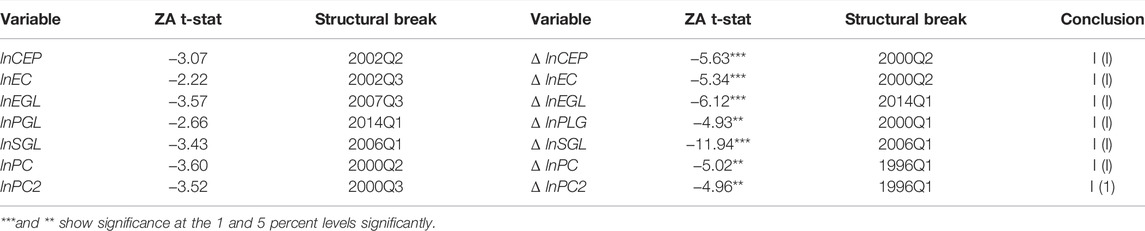
TABLE 5. Unit root results with structural break.
Table 6 depicts results of ARDL F-bounds test. The estimated value of the F-bound statistic is greater than the upper bounds critical value at the 1 percent level of significance. Thus, the variables of the study have a long-term relationship. These results confirm that all explanatory variables are determinants of carbon emissions in the long run in Kazakhstan. In addition, after confirmation of the long-run relationship among variables, one can proceed to obtain short-run and long-run estimates based on ARDL.
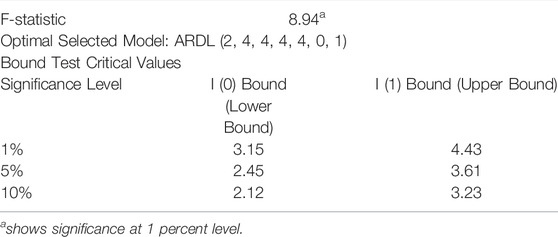
TABLE 6. Bound test results.
Table 7 shows the outcomes, whereas Table 7's Panels (A) and (B) show the long and short run results, respectively. Panel (C) of Table 7 displays the diagnostic tests. Let’s start with the long run findings. Energy consumption is observed to have a beneficial influence on carbon emissions over time; hence, Kazakhstan’s energy structure is unsuitable for environmental quality, since the country’s energy demand is met using nonrenewable energy resources. In terms of the influence of globalization on carbon emissions, all aspects of globalization, economic, political, and social, have shown to have positive and substantial long-term impacts on carbon emissions; nonetheless, globalization is accelerating environmental deterioration in Kazakhstan. This study is in line with Shahbaz, Solarin, and Ozturk (2016), who discovered that globalization causes carbon emissions to accumulate in Ghana, Morocco, South Africa, Sudan, and Tanzania. Similarly, Khan et al. (2019) determined that economic, political, and social globalization are increasing environmental degradation in Pakistan, despite the fact that these aspects of globalization have a favorable impact on carbon emissions in Pakistan. The scale impact of globalization, which leads to increased economic activity and output to fulfil global demand, is responsible for the positive effect of economic globalization. Furthermore, the positive impact of globalization on carbon emissions in Kazakhstan refutes Najam et al. (2016)’s argument that globalization plays a proactive role in reducing the severity of environmental problems by enacting global-level legislation. Meyer (1999) claimed, on the other hand, that national policies are designed and implemented according to a global template, since a country’s modernization is a core part of political globalization, which is responsible for environmental damage. The reason for this is that modernization alters the economy’s structure as well as energy and land consumption, placing additional strain on the environment (Malone, 2002). This theory is backed up by research from Kazakhstan, which shows that political globalization increases carbon emissions, worsening environmental deterioration.
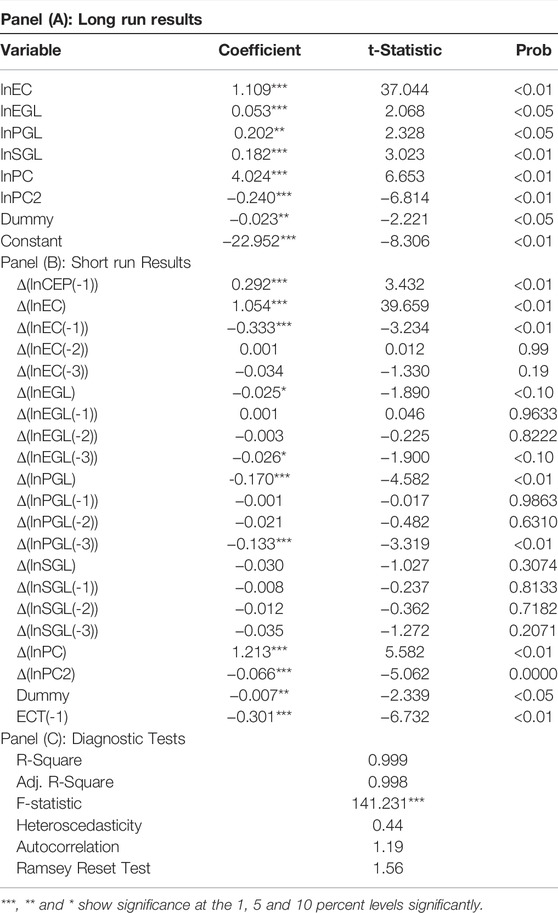
TABLE 7. Results.
The EKC hypothesis is shown to be true in Kazakhstan in the long term, with positive and negative signals for per capita and its squares, respectively. This suggests that carbon emissions rose in tandem with economic activity until they reached a point when they did not, proving an inverted U-shaped link between per capita and environmental deterioration in Kazakhstan. Apergis and Payne (2009), Jalil and Mahmud (2009), Jayanthakumaran et al. (2012), and Khan et al. (2019) in Turkey, China, Bangladesh, and Pakistan, respectively, corroborate this conclusion of the research.
When it comes to short-run outcomes, lags of variables are involved, and the Wald test is used to determine if a variable and its delays are significant or not. Energy consumption has a positive and substantial influence on carbon emissions in the short run, and energy contributes to environmental deterioration in the short run, among the independent variables. Although all aspects of globalization have a negative impact on carbon emissions, economic and political globalization have a substantial impact on whether social globalization has a negligible impact. The EKC hypothesis occurs in Kazakhstan in the short term, since the coefficients of PC and PC2 have the predicted signs and are significant, as shown by the findings. PC has a positive relationship with carbon emissions, but PC2 has a negative relationship. Jalil and Feridun (2011) and Shahbaz et al. (2015a), who tested the EKC hypothesis in China, India, and Ghana, came to the same conclusion. Furthermore, since ECT is significant with a negative sign, the findings demonstrate that the model is stable and in equilibrium. Because the model’s magnitude is 0.30, it may be assumed that it will respond to any external shock in less than a year. The diagnostic test results shown in panel (C) indicated that the overall model is significant (F-test) and stable, as shown by the Ramsey reset test. Similarly, there are no autocorrelation or heteroscedasticity issues in the model.
Discussion
Kazakhstan’s chief sources of pollution are agricultural, industrial, municipal, and transport emissions. Carbon emissions per capita for EU&CA and Kazakhstan is shown in Figure 1. It can be observed that it remained below 8 metric tons for EU and CA during 1995 and 2008 and since 2010 it is decreased and remained around 6.7 metric tons in 2018. As for as Kazakhstan is concerned, during 1995 and 2001, carbon emissions per capita was on decrease as it decreased from almost 11–7.5 metric tons while Kazakhstan per capita increased from USD 3738 to USD 4492 during same period. However, carbon emissions per capita in Kazakhstan almost double as it increased from 7.5 to 14.7 metric tons during 2001 and 2008. Since 2011, carbon emissions per capita fluctuates between 11 and 12 metric tons. Now, if one compares the per capita income and carbon emissions per capita for EU& CA and Kazakhstan in 2018, Kazakhstan is producing around 12 metric ton carbon emissions per capita for USD 11166 per capita income whereas EU and CA produces 6.7 metric tons carbon emissions per capita where EU and CA combined per capita income is more than 2.5 times of Kazakhstan as it remained USD 26336 in 2018. Figure 2 presents carbon emissions per capita for Central Asia. Like Kazakhstan, Turkmenistan also releasing more carbon emissions per capita compare to other Central Asian countries. Carbon emissions increased from eight metric tons to more than 12 metric tons per capita for Turkmenistan during 1995 and 2018 (World Bank, 2021). For Uzbekistan, carbon emissions per capita remained at approximately four metric tons for many years during 1995 and 2011; however, since 2012, they have remained below four metric tons per capita and remained at 3.4 metric tons per capita. Carbon emissions per capita remained below two metric tons and below one metric ton per capita for Kyrgyz and Tajikistan, respectively, during 1995 and 2018.
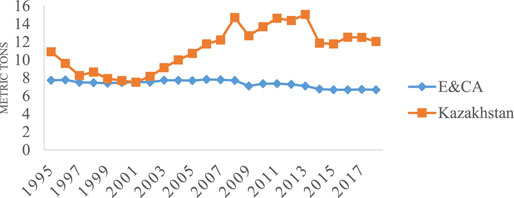
FIGURE 1. Carbon emissions per capita.
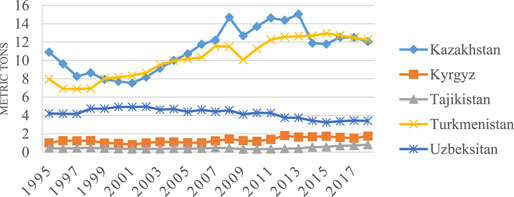
FIGURE 2. Carbon emissions per capita in central asia.
Figure 3 illustrates per capita income in constant United States dollars (USD) of Europe and Central Asia (EU and CA) and Kazakhstan, while Figure 4 depicts per capita in USD for Central Asian Countries over the period from 1995 to 2018. During this period, EU and CA combined per capita income increased from USD 17361 to USD 26336. Per capita income continuously increased for EU and CA from 1995 to 2009; however, there was a decrease in per capita EU&CA in 2010, as it dropped from USD 24272 to USD 23099. Since 2011, EU and CA has experienced a continuous rise in per capita income, as it stood at approximately USD 26336 in 2018. It can be concluded from Figure 1 that EU&CA experienced a rise in per capita income by almost 51 percent during 1995 and 2018. The per capita income of Kazakhstan was USD 3738 in 1995, and a continuous rise in per capita was experienced during 1995 and 2008; however, Kazakhstan experienced a sudden drop in per capita in 2009 as per capita income dropped from USD 8698 to USD 8573. During 1995 and 2018, Kazakhstan was able to increase almost three times in its per capita income. Similarly, during the same period, Turkmenistan performed better than Kazakhstan, as it experienced a more than 3.7 times rise in its per capita income as its per capita increased from USD 2054 to USD 7648. Likewise, Uzbekistan was able to increase its per capita income by 2.7 times during 1995 and 2018 as its per capita income increased from USD 876 to USD 2376. As for as, Tajikistan and Kyrgyz republic is concerned they are also able to increase their per capita income two folds during 1995 and 2018 (World Bank, 2021).
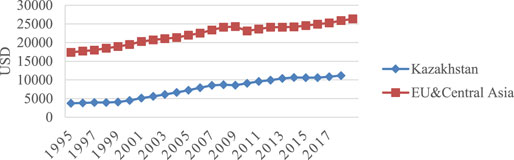
FIGURE 3. Per capita income.

FIGURE 4. Per capita income of central asian countries.
The facts and figure discussed in this section support the findings of the study as increase in per capita of Kazakhstan is accompanied by increase in carbon emissions per capita however; Figures 1, 2 support the finding of the study that EKC hypothesis is valid in case of Kazakhstan as further increase in income is not followed by increase in per capita income. The carbon emissions per capita returned to the level of 2007 whereas income per capita increase from USD 8524 to USD 11165 during 2007–2018. As for as the estimated turning point
Conclusion and Policy Implications
The study’s major goal is to look at the impact of globalization on environmental degradation in Kazakhstan. Because economic, political, and social globalization all contribute to environmental degradation, an empirical model is built that includes all three components of globalization as predictors of environmental degradation, as well as energy as a control variable. Furthermore, the EKC theory is being tested in this research. This research uses quarterly time series data from 1991Q1 through 2018Q4 for this purpose. The KPSS and ERS tests are used to assess the time-trended characteristics of the time series data, while the Zivot-Andrew unit root test is used to capture unknown structural breakdowns. After determining the order of integration for all variables, the ARDL bounds approach is used to identify cointegration among the study’s variables.
The study’s findings verified that all of the study’s factors had a long-term link. Furthermore, this research reveals that energy use worsens environmental deterioration not just in the near term but also over time. The fact that more than 90% of Kazakhstan’s energy demand is fulfilled by fossil fuels explains why energy consumption has a beneficial impact on environmental deterioration. The outcomes of economic globalization, political globalization, and social globalization present policymakers with a window, since the outcomes of various components of globalization vary in the short and long term. In the long run, all of these factors contribute to environmental deterioration; however, economic and political globalization do not contribute to environmental degradation in the near term, since economic and political globalization had negative and substantial impacts on carbon emissions. Furthermore, the EKC hypothesis is shown in Kazakhstan by the findings of the ARDL limits approach, which show an inverted U-shaped connection between per capita income and carbon emissions in both short and long time periods. Kazakhstan is dealing with environmental difficulties, and the findings of this research revealed that energy, economic expansion, and globalization are deteriorating the country’s environmental quality.
The following is a policy framework that we presented. First and foremost, Kazakhstan must develop environmental institutions and standards, since these measures are unlikely to prevent global and local investment or help Kazakhstan regulate environmental damage. The rationale for this is because pollution abatement costs are lower than any other expense, including input prices. Production will not be harmed in the future, but it will not place a strain on environmental quality. However, Kazakhstan’s government must design optimal policies so that marginal social costs of environmental degradation are equal to marginal benefits of environmental regulations. Furthermore, well-designed regulations can encourage innovation and technological improvement, allowing Kazakhstan to reduce not only production costs but also make production more energy efficient. Second, Kazakhstan must diversify its energy capability since it is primarily reliant on fossil fuels and must explore renewable energy options. Third, Kazakhstan must diversify its exports, since energy-related exports account up a significant share of the country’s total. Fourth, for Kazakhstan’s long-term growth, our research suggests that conservative energy policies be implemented to reduce energy-related emissions. In addition, Kazakhstani policymakers should guide the policy framework to stimulate investments in renewable energy sources such as biofuels, nuclear power, wind, solar power, solid biomass, and so on. Kazakhstan will boost the productive capacity of numerous sectors, cut greenhouse gas emissions, and enjoy the benefits of globalization in the form of long-term economic development in this manner.
Data Availability Statement
Publicly available datasets were analyzed in this study. This data can be found here: World Bank Online database.
Author Contributions
Conceptualization, MP and IH; methodology, MP, KS, PA, and IH; validation, MP, KS, PA, and IH; formal analysis, MP, PA, and IH; investigation, MP, KS, PA, and IH; resources, MP, KS, PA, and IH; data curation, MP, KS, PA, and IH; writing—original draft preparation, MP, SK, PA, and IH; writing—review and editing, MP, PA, and IH; supervision, KS and IH. All authors have read and agreed to the published version of the manuscript.”
Conflict of Interest
The authors declare that the research was conducted in the absence of any commercial or financial relationships that could be construed as a potential conflict of interest.
Publisher’s Note
All claims expressed in this article are solely those of the authors and do not necessarily represent those of their affiliated organizations, or those of the publisher, the editors and the reviewers. Any product that may be evaluated in this article, or claim that may be made by its manufacturer, is not guaranteed or endorsed by the publisher.
References
Abbasi, F., and Riaz, K. (2016). CO2 Emissions and Financial Development in an Emerging Economy: an Augmented VAR Approach. Energy Policy 90, 102–114. doi:10.1016/j.enpol.2015.12.017
Acaravci, A., and Ozturk, I. (2010). On the Relationship between Energy Consumption, CO2 Emissions and Economic Growth in Europe. Energy 35 (12), 5412–5420. doi:10.1016/j.energy.2010.07.009
Apergis, N., and Payne, J. E. (2009). CO2 Emissions, Energy Usage, and Output in Central America. Energy Policy 37 (8), 3282–3286. doi:10.1016/j.enpol.2009.03.048
Boutabba, M. A. (2014). The Impact of Financial Development, Income, Energy and Trade on Carbon Emissions: Evidence from the Indian Economy. Econ. Model. 40, 33–41. doi:10.1016/j.econmod.2014.03.005
British Petroleum (2021). BP Statistical Review of World Energy. Data retrieved from http://www.bp.com/statisticalreview.
Copeland, B. R., and Taylor, M. S. (2004). Trade, Growth, and the Environment. J. Econ. literature 42 (1), 7–71. doi:10.1257/.42.1.7
Dickey, D. A., and Fuller, W. A. (1979). Distribution of the Estimators for Autoregressive Time Series with a Unit Root. J. Am. Stat. Assoc. 74 (366a), 427–431. doi:10.1080/01621459.1979.10482531
Dreher, A. (2006). Does Globalization Affect Growth? Evidence from a New Index of Globalization. Appl. Econ. 38 (10), 1091–1110. doi:10.1080/00036840500392078
Edoja, P. E., Aye, G. C., and Abu, O. (2016). Dynamic Relationship Among CO2 Emission, Agricultural Productivity and Food Security in Nigeria. Cogent Econ. Finance 4 (1), 1204809. doi:10.1080/23322039.2016.1204809
Elliott, G., Rothenberg, T. J., and Stock, J. H. (1996). Efficient Tests for an Autoregressive Unit Root. Econometrica 64, 813–836. doi:10.2307/2171846
Gasimli, O., Haq, I. U., Gamage, S. K., Shihadeh, F., Rajapakshe, P. S. K., and Shafiq, M. (2019). Energy, Trade, Urbanization and Environmental Degradation Nexus in Sri Lanka: Bounds Testing Approach. Energies 12 (9), 1655. doi:10.3390/en12091655
Grossman, G. M., and Krueger, A. B. (1991). Environmental Impacts of a North American Free Trade Agreement. NBER Working Paper. (w3914). Cambridge, Massachusetts.
Haq, I. u., Zhu, S., and Shafiq, M. (2016). Empirical Investigation of Environmental Kuznets Curve for Carbon Emission in Morocco. Ecol. Indic. 67, 491–496. doi:10.1016/j.ecolind.2016.03.019
Henriques, I., and Sadorsky, P. (1996). The Determinants of an Environmentally Responsive Firm: An Empirical Approach. J. Environ. Econ. Manag. 30 (3), 381–395. doi:10.1006/jeem.1996.0026
Jalil, A., and Feridun, M. (2011). The Impact of Growth, Energy and Financial Development on the Environment in China: a Cointegration Analysis. Energy Econ. 33, 284–291. doi:10.1016/j.eneco.2010.10.003
Jalil, A., and Mahmud, S. F. (2009). Environment Kuznets Curve for CO2 Emissions: a Cointegration Analysis for China. Energy policy 37 (12), 5167–5172. doi:10.1016/j.enpol.2009.07.044
Jayanthakumaran, K., Verma, R., and Liu, Y. (2012). CO2 Emissions, Energy Consumption, Trade and Income: a Comparative Analysis of China and India. Energy Policy 42, 450–460. doi:10.1016/j.enpol.2011.12.010
Johansen, S., and Juselius, K. (1990). Maximum Likelihood Estimation and Inference on Cointegration with Applications to the Demand for Money. Oxf. Bull. Econ. statistics 52 (2), 169–210.
Khan, D., and Ullah, A. (2019). Testing the Relationship between Globalization and Carbon Dioxide Emissions in Pakistan: Does Environmental Kuznets Curve Exist? Environ. Sci. Pollut. Res. 26 (15), 15194–15208. doi:10.1007/s11356-019-04913-9
Khan, M. K., Teng, J.-Z., Khan, M. I., and Khan, M. O. (2019). Impact of Globalization, Economic Factors and Energy Consumption on CO2 Emissions in Pakistan. Sci. total Environ. 688, 424–436. doi:10.1016/j.scitotenv.2019.06.065
KOF Swiss Economic Institute (2021). Globalization Index. Avaialable at: https://kof.ethz.ch/en/forecasts-and-indicators/indicators/kof-globalisation-index.html.
Kwiatkowski, D., Phillips, P. C. B., Schmidt, P., and Shin, Y. (1992). Testing the Null Hypothesis of Stationarity against the Alternative of a Unit Root. J. Econ. 54, 159–178. doi:10.1016/0304-4076(92)90104-y
Malone, E. L. (2002). Hot Topics: Globalization and Climate Change, Soc. Thought Res. 143–173. Avaialable at: https://kuscholarworks.ku.edu/bitstream/handle/1808/5192/STARV25N1-2A5.pdf?sequence=1. doi:10.17161/str.1808.5192
Meo, M. S., Chowdhury, M. A. F., Shaikh, G. M., Ali, M., and Masood Sheikh, S. (2018). Asymmetric Impact of Oil Prices, Exchange Rate, and Inflation on Tourism Demand in Pakistan: New Evidence from Nonlinear ARDL. Asia Pac. J. Tour. Res. 23 (4), 408–422. doi:10.1080/10941665.2018.1445652
Meyer, J. W. (1999). “The Changing Cultural Content of the Nation-State: a World Society Perspective,” in State/culture: State-Formation after the Cultural Turn. Editor G. Steinmetz (Ithaca: Cornell University Press).
Mohammed Saud, M. A., Guo, P., Haq, I. U., Pan, G., and Khan, A. (2019). Do government Expenditure and Financial Development Impede Environmental Degradation in Venezuela? PloS one 14 (1), e0210255. doi:10.1371/journal.pone.0210255
Najam, A., Runnalls, D., and Halle, M. (2016). “Environment and Globalization: Five Propositions (2010),” in The Globalization and Environment Reader. Editors J. Timmons Roberts, and P. Newell (Wiley), 94. Avaialable at: https://www.wiley.com.
Naradda Gamage, S. K., Hewa Kuruppuge, R., and Haq, I. U. (2017). Energy Consumption, Tourism Development, and Environmental Degradation in Sri Lanka. Energy Sources, Part B Econ. Plan. Policy 12 (10), 910–916. doi:10.1080/15567249.2017.1324533
Narayan, P. K. (2005). The Saving and Investment Nexus for China: Evidence from Cointegration Tests. Appl. Econ. 37 (17), 1979–1990. doi:10.1080/00036840500278103
Nasir, M., and Rehman, F. U. (2011). Environmental Kuznets Curve for Carbon Emissions in Pakistan: An Empirical Investigation. Energy Policy 39 (3), 1857–1864.
Panayotou, T. (1997). Demystifying the Environmental Kuznets Curve: Turning a Black Box into a Policy Tool. Envir. Dev. Econ. 2 (4), 465–484. doi:10.1017/s1355770x97000259
Panayotou, T. (2000). Globalization and Environment. CID Working Paper Series. Harvard University Cambridge, Massachusetts
Pao, H.-T., and Tsai, C.-M. (2010). CO2 Emissions, Energy Consumption and Economic Growth in BRIC Countries. Energy policy 38 (12), 7850–7860. doi:10.1016/j.enpol.2010.08.045
Pesaran, M. H., Shin, Y., and Smith, R. J. (2001). Bounds Testing Approaches to the Analysis of Level Relationships. J. Appl. Econ. 16 (3), 289–326. doi:10.1002/jae.616
Pesaran, M. H., Shin, Y., and Smith, R. J. (1996). Testing For the 'Existence Of a Long-Run Relationship' (No. 9622). Cambridge UK: Faculty of Economics, University of Cambridge.
Phillips, P. C. B., and Perron, P. (1988). Testing for a Unit Root in Time Series Regression. Biometrika 75 (2), 335–346. doi:10.1093/biomet/75.2.335
Saboori, B., and Sulaiman, J. (2013). CO2 Emissions, Energy Consumption and Economic Growth in Association of Southeast Asian Nations (ASEAN) Countries: A Cointegration Approach. Energy 55, 813–822.
Shahbaz, M., Khan, S., Ali, A., and Bhattacharya, M. (2017). The Impact of Globalization on CO2 Emissions in China. Singap. Econ. Rev. 62 (04), 929–957. doi:10.1142/s0217590817400331
Shahbaz, M., Mallick, H., Mahalik, M. K., and Loganathan, N. (2015a). Does Globalization Impede Environmental Quality in India? Ecol. Indic. 52, 379–393. doi:10.1016/j.ecolind.2014.12.025
Shahbaz, M., Ozturk, I., Afza, T., and Ali, A. (2013). Revisiting the Environmental Kuznets Curve in a Global Economy. Renew. Sustain. Energy Rev. 25, 494–502. doi:10.1016/j.rser.2013.05.021
Shahbaz, M., Solarin, S. A., and Ozturk, I. (2016). Environmental Kuznets Curve Hypothesis and the Role of Globalization in Selected African Countries. Ecol. Indic. 67, 623–636. doi:10.1016/j.ecolind.2016.03.024
Shahbaz, M., Solarin, S. A., Sbia, R., and Bibi, S. (2015b). Does Energy Intensity Contribute to CO2 Emissions? A Trivariate Analysis in Selected African Countries. Ecol. Indic. 50, 215–224. doi:10.1016/j.ecolind.2014.11.007
Taylor, M. S., and Copeland, B. R. (2003). Trade, Growth and the Environment. Cambridge, MA, USA: National Bureau of Economic Research, 9823.
Tutulmaz, O. (2015). Environmental Kuznets Curve Time Series Application for Turkey: Why Controversial Results Exist for Similar Models? Renew. Sustain. Energy Rev. 50, 73–81. doi:10.1016/j.rser.2015.04.184
Keywords: globalization, energy consumption, income, environmental degradation, time serie analysis
Citation: Primbetova M, Sharipov K, Allayarov P and Haq Iu (2022) Investigating the Impact of Globalization on Environmental Degradation in Kazakhstan. Front. Energy Res. 10:896652. doi: 10.3389/fenrg.2022.896652
Received: 15 March 2022; Accepted: 30 May 2022;
Published: 27 June 2022.
Edited by:
Simone Borghesi, University of Siena, ItalyReviewed by:
Matteo Mazzarano, University of Siena, ItalyFrancesco Nicolli, University of Ferrara, Italy
Copyright © 2022 Primbetova, Sharipov, Allayarov and Haq. This is an open-access article distributed under the terms of the Creative Commons Attribution License (CC BY). The use, distribution or reproduction in other forums is permitted, provided the original author(s) and the copyright owner(s) are credited and that the original publication in this journal is cited, in accordance with accepted academic practice. No use, distribution or reproduction is permitted which does not comply with these terms.
*Correspondence: Ihtisham ul Haq, aWh0aXNoYW1Aa3VzdC5lZHUucGs=