 Yuling Han
 Yiping Liu1
- 1College of Economics and Management, Nanjing University of Aeronautics and Astronautics, Nanjing, China
- 2College of Management, Nanjing University of Posts and Telecommunications, Nanjing, China
- 3School of Economics and Management, Huaiyin Normal University, Huai’an, China
The 21st Conference of the Parties (COP 21) was a significant attempt by governments to make and monitor commitments to limit global warming. However, COP 23 “sought to continue the global momentum to decouple output from greenhouse gas (GHG) emissions.” Among the GHGs, carbon dioxide (CO2) is the major one most countries worry about. This paper examines the decoupling situations of China’s CO2 emissions and economic growth, considering the country’s progress situation from the year 2000 to 2019. For this, we employed two models: the environmental Kuznets curve (EKC) model for exploring the long-run decoupling status and the influence factors of CO2 emissions and the Tapio model for the short-run decoupling status. Later, the Tapio model was extended to analyze the influence of industrial structure, energy structure, and population structure. The long-term results suggest that China’s CO2 emissions have not decoupled yet, but the emission’s intensity has decoupled in mid-2006. The short-term decoupling results revealed that the degree of decoupling changed to weak from strong in the last five years. According to the influencing structure’s results, the industrial and energy structures inhibited CO2 emissions, but their influence was not strong enough to offset the impact of economic growth; however, the population structure indorsed CO2 emissions. Lastly, we found an unusual verdict that is the change of EKC into a U-shape from an inverted U-shape, and the observed reason is the control variable introduction. We also observed that the turning point became greater after introducing the industrial structure separately. Overall, from the perspective of the observed decoupling trends, it is suggested that China should strengthen and further optimize its energy structure to match the industrial structure.
1 Introduction
The pledge to tackle global warming potential was a significant attempt by nations in the 21st Conference of the Parties (COP 21) (De Moor (2018). The follow-up COP summits have maintained the same pledge; however, in COP 23, there was a global momentum on decoupling the country’s outcome from greenhouse gas emissions (Gough, 2017). Carbon dioxide (CO2) is the most significant GHG that most countries are concerned about. The recent report “State of the Global Climate 2020” (WMO, 2021) from the World Meteorological Organization (WMO) suggests that even though the global economy is declined and the emissions of new GHG were only reduced temporarily, the positive effect of the COVID-19 pandemic is significant here. Also, it did not inhibit the increase in atmospheric GHG concentration and temperature (WMO, 2021). Though this mere effect on decreasing GHG is seen, the theories and proven facts clearly leave the signs of increasing global warming and global climate change, which are the most considerable environmental problems of the present. They pose a greater threat to both developed and developing countries, especially those aiming to achieve sustainable economic growth and development (Alege et al., 2016). As a result, the extent to which decoupling is occurring is still seen as a point of contention. China is one leading nation aiming to achieve sustainable economic growth and development. If we look at China’s historical gross domestic product (GDP) data, as shown in Figure 1A (World Bank, 2020), the trend can be observed clearly. As per the 2020 reports, the annual GDP growth % was maintained at 2.3% (World Bank, 2020). However, if we compare the % of annual GDP growth rates with those of other nations, China’s performance is notable (see Figure 1B) (World Bank, 2020). More recently, in 2020, President Xi Jinping said that China’s CO2 emissions should reach their peak by 2030, and China would strive to achieve net neutrality by 2060. Given China’s current position as one of the largest CO2 emitters, its emission reduction targets are significant in achieving the global target of 2°C in this century.
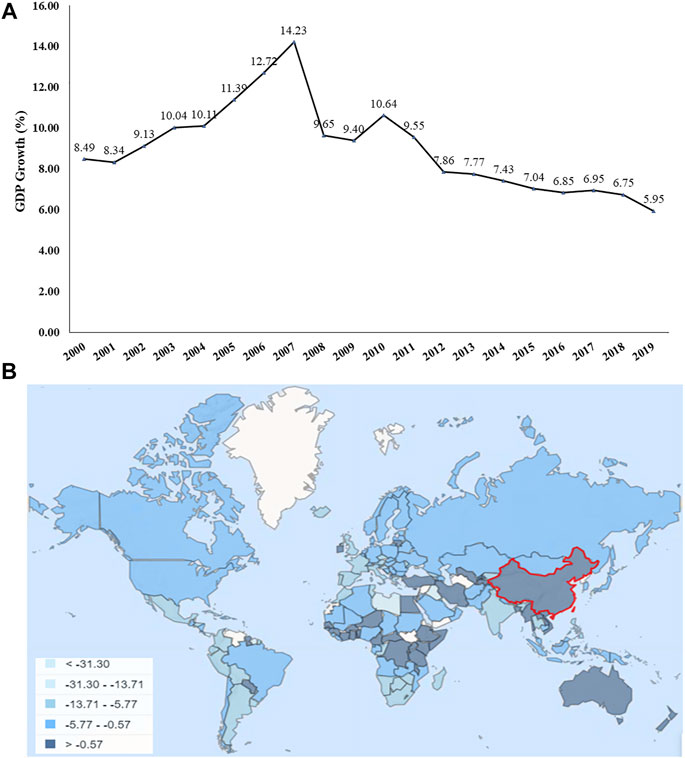
FIGURE 1. (A) China’s annual GDP growth % from 2000 to 2019; (B) comparison of China’s annual GDP growth % with those of other nations. Data source: World Bank national accounts data and OECD National Accounts data files (World Bank, 2020).
In this context, it is imperative to understand the upshot of COP 23’s momentum of decoupling the country’s outcome from GHG. The environmental Kuznets curve (EKC) hypothesis holds that economic growth leads to increased environmental pollution at the beginning of the economic development process. However, when economic growth reaches a turning point, the economic growth will decrease the environmental pollution. The EKC hypothesis has been widely used, and many researchers hope to predict the turning point to help policymakers predict the peak time (Jin et al., 2017; Dong et al., 2018; He et al., 2021). Dong et al. (2018) estimated that the per capita gross domestic product (GDP) at the inflection point is 96,680.47 yuan, which will be reached by 2028. While Jin et al. (2017) suggested that the inflection point would be reached at least five years later in the period from 1995 to 2012, yet the peak did not appear now. This is affected by energy conservation, emission reduction, and related policies; as a result, the growth rate of China’s CO2 emissions has gradually slowed since 2012 (He et al., 2021). Almost at the same time, the speed of China’s economic development has slowed, entering a new development stage. This new development stage triggered numerous questions. For instance, do the CO2 emissions decouple from the economic growth in the new stage? Are there any new changes? What factors affect CO2 emissions by the view of structure change?
Considering the above-raised questions, this study aims to compare the decoupling of economic growth and CO2 emissions from different points. A key focus was made on exploring the potential new changes in this new development stage in China, followed by finding the reasons for such changes.
2 Literature Review
As mentioned earlier in Section 1, many governments and researchers always focus on the relationship between economic growth and environmental pollution. Some even focus on specific sectors or specific technology in a specific sector, as discussed by Shah et al. (2020a), Shah et al. (2020b), and Naqvi et al. (2020). To explain such a relationship, numerous methods are being used in the literature. For the decoupling analysis, there are two main types. One is judging whether CO2 emissions decrease with the growth of economy from the view of absolute quantity.
The popularly used method is the EKC model. Many researchers have verified it in different countries or regions. Shah et al. (2021) tested the EKC model to identify the drivers of environmental degradation with economic development for Western Asia and North African regions and reported that the U-shaped and inverted U-shaped EKC hypotheses are valid. Naqvi et al. (2021) verified EKC and renewable energy environment Kuznets curve (RKC) hypotheses considering the renewable energy, economic development, and ecological footprint nexus for 155 countries. Ali et al. (2021) tested the EKC in Nigeria from 1981 to 2014; their results supported the EKC hypothesis. In Pata (2018) research, the EKC in Turkey from 1974 to 2013 existed in the long term and short term. Prastiyo et al. (2020) found the EKC in Indonesia was in existence, Haseeb et al. (2018) found that BRICS economies supported the EKC hypothesis, and Zaidi et al. (2019) discussed the EKC of Asia-Pacific Economic Cooperation (APEC) member countries; the results supported the EKC too. Gokmenoglu and Taspinar (2018) explored the EKC hypothesis that also existed in the agricultural sector in Pakistan from 1971 to 2014. For China, Li et al. (2020) found the EKC hypothesis held by the province panel data of China from 1997 to 2016. Sun et al. (2021) got similar results in the research period of 2000–2012. In the research by Hao et al. (2019), they found that the EKC was in existence, but the turning point would not appear soon. Furthermore, Xia and Wang (2020) and Liu and Xiao (2018) verified the existence of the CO2 EKC hypothesis in China. However, some studies did not verify the EKC hypothesis. For instance, Jin and Kim (2020) studied 34 Annex I countries and found that only 5 countries supported the EKC. Other researchers found the curves instead showed linear (Hu et al., 2013), U-type (Ajmi and Inglesi-Lotz, 2021; Hasanov et al., 2019), N-type (Allard et al., 2018; Shah et al., 2020a], and inverted N-type (Ameyaw et al., 2020) relationships.
The other type is judged by the growth rate, in other words, whether the CO2 emission growth speed declines or even reaches negative growth as the economic growth rate increases. The commonly used method is the Tapio decoupling model. Some studies showed that the decoupling level of developed countries or regions is more robust than that of developing countries or regions. Li and Jiang (2020) compared the decoupling of the six highest global CO2-emitting countries by using the Tapio decoupling model; their results showed that the decoupling situation of the developing countries was more unstable and weaker than that of the developed countries. The verification results of Ozturk et al. (2021) in China, India, and Pakistan show that all three countries have a decoupling trend. However, Pakistan is the most expensive, followed by India and China. Researchers also produced similar findings in China; the decoupling degree of developed regions or provinces is more robust than that of underdeveloped regions or provinces. Cohen et al. (2018) found that the decoupling of more prosperous provinces is more robust than that of poorer provinces in China. Peng et al. (2011) found that although the degree of decoupling in the eastern region was more robust than that in other regions in China, the regional differences had a noticeable narrowing trend with the improvement of the economy. As China’s per capita income grows continually, our study wants to find whether the degree of carbon emission decoupling is more substantial than before or not. Numerous other approaches are applied in the literature to different countries to understand the relationships between economic growth and CO2 emissions, for instance, the unexplored nexus in ASEAN countries (Haseeb et al., 2019), bootstrap ARDL approach for Singapore (Meirun et al., 2021), fixed asset model for ASEAN countries (Krisada et al., 2021), and Markov switching equilibrium correction model (MS-ECM) for Pakistan (Shah et al., 2022). Additionally, there is some instance of understanding carbon footprint implications due to outward foreign direct investment (OFDI), human well-being, and the public sector’s macro indicators based on the cross-country analysis (Zhang et al., 2021).
In summary, the theoretical and empirical research on the decoupling of CO2 emissions has obtained many essential conclusions. However, most of the existing literature was based on only one decoupling method, and there were fewer studies with two or more methods. Coming to the research on China, the study period was mostly 2016; the conclusions were optimistic and did not lead to a strategic conclusion. In addition, the literature evidence suggests that most studies believe CO2 emissions are affected by exogenous factors, such as energy consumption, urbanization development, transportation, and OFDI.
Hence, this paper will explain the influence factors of CO2 emissions from a new point. For this, we claim that the characteristics of CO2 emissions were affected by the industrial structure. The endowment structure affected the industrial structure (including energy and population structures) (Lin 2011). So, the structure of the CO2 emission was endogenously determined by the endowment structure. The EKC and Tapio models were used to analyze the decoupling in terms of quantity and speed separately. Furthermore, we selected 2000–2019 as the research period, including the latest data after 2016. Firstly, we analyzed the long-term decoupling trend of China’s CO2 emissions based on the EKC hypothesis model. Then, we discussed the short-term CO2 decoupling based on the Tapio model. Finally, we introduced three control variables (including the industrial structure, energy structure, and population structure) into the model to explore the influence on decoupling.
3 Methods and Data Collection
3.1 Decoupling Models
3.1.1 EKC Model
Kuznets originally used the EKC hypothesis to describe the inverted U-shaped curve relationship between economic growth and income inequality. Grossman and Krueger found that an inverted U-shaped curve was also valid in economic growth and environmental pollution. Later, environmental economists extended Kuznets’s hypothesis theory. The inverted U-shaped curve was called the environmental Kuznets curve (EKC) (Lin 2011).
The general formula for the EKC hypothesis is given as follows (Bhattarai and Hammig, 2001):
where Y represents environmental pollution, G represents economic growth, X represents other control variables that significantly impact Y, a is the intercept term, the β’s are the estimation parameters, and ε represents the random error term.
The natural pair of variables is generally used for numerical modeling in practical applications. The advantage of this is that it can change the relationship between variables and reduce the fluctuation of variables and reduce the value of sample heteroscedasticity. Thus, the regression coefficient is transformed into the elasticity coefficient of independent variables to dependent variables. Therefore, Eq. 1 is changed into the following equation:
The curvilinear relationship between G and Y is as follows:
If β1 = β2 = β3 = 0, then G and Y are not related;
If β1 > 0 and β2 = β3 = 0, then G and Y are monotonically increasing;
If β1 < 0 and β2 = β3 = 0, then G and Y are monotonically decreasing;
If β1 > 0, β2 < 0, and β3 = 0, then G and Y show an inverted U-shaped curve;
If β1 < 0, β2 > 0, and β3 = 0, then G and Y show a U-shaped curve;
If β1 > 0, β2 < 0, and β3 > 0, then G and Y show an N-shaped curve;
If β1 < 0, β2 > 0, and β3 < 0, then G and Y are in an inverted N-shaped curve.
Among the above seven relationships, only the fourth relationship is the EKC relationship.
Figure 2A shows the decoupling states of the inverted U-shaped curve. As shown in Figure 2A, G0 is the turning point. When G < G0, Y increases with the growth of G, but the change rate of Y becomes increasingly smaller, i.e., the same difference of G brings a smaller difference of Y, so Y and G are in a relative decoupling state. When G > G0, Y decreases with the increase of G, and Y and G are in an absolute decoupling state. In contrast, in the U-shaped curve shown in Figure 2B, when G < G0, Y decreases with the increase of G, and Y and G are in an absolute decoupling state. When G > G0, Y increases with the increase of G, and the change rate of Y becomes larger and larger, so Y and G are in an expansive coupling state. Similarly, the N-shaped curve is just like a U-shaped curve following an inverted U-shaped curve. When G reaches the first turning point, Y and G are in an absolute decoupling state from a relative decoupling state. Then, with the uncontrolled economic development, the capacity of the environment regarding pollution exceeds the limit, and the decrease of Y becomes smaller; when G reaches the second turning point, Y and G are in the coupling state again, also called re-linking (Grossman and Krueger, 1995). In contrast, the inverted N-shaped curve is a U-shaped curve in the first half and an inverted U-shaped curve in the second half. When G reaches the first turning point, it will experience a more expansive coupling process and then gradually improve to a relative decoupling state. When G reaches the second turning point, Y and G are again in the absolute decoupling state.
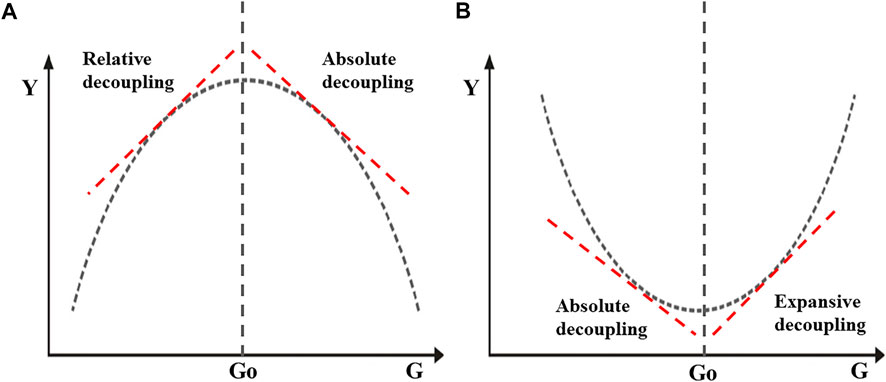
FIGURE 2. Decoupling states: (A) inverted U-shaped and (B) U-shaped curves.
As discussed in Section 1 and Section 2, there were some different research results regarding the EKC, and the results showed that the EKC is sensitive to research years and research indicators. When the economic growth of an economy achieves a high level, the “CO2 emissions per unit GDP” will first reach an inflection point that displays a downward trend. However, the “CO2 emissions per capita” peak will lag behind. However, they achieved a real turning point only when per capita CO2 emissions began to decline continuously (Mikayilov et al., 2018). Hence, this study selected per capita CO2 emissions (PC) and CO2 emission intensity (CI) to represent the variable Y and used total CO2 emissions (TC) to test the stability. The economic growth variable G was the per capita gross domestic product (PGDP) (Bhattarai and Hammig, 2001). So, Eq. 2 is changed and represented as follows:
According to Lin (2011), the factor endowment structure of an economy determines its production structure, including the industrial structure and technological structure, and the characteristics of the production structure determine its environmental structure. Energy is the major force of motive in the industry. Fossil energy consumption, especially coal, is the major leading source of CO2 emissions. Therefore, we selected the energy structure (ES) and population structure (PS) in factor endowment and industrial structure (IS) as control variables; then, Eq. 2 is changed into the following equation:
3.1.2 Tapio Decoupling Model
The Organisation for Economic Co-operation and Development (OECD) developed the Tapio decoupling model. While Tapio studied the correlation between the transportation CO2 emissions and the GDP of EU 15 countries, taking the elastic value of environmental pressure on driving factors as the division basis, he improved the OECD. Decoupling theory extended the decoupling situations into eight types, usually called them decoupling states. The following equation represents the GDP elasticity of CO2 emissions (Tapio 2005):
where DI(C, GDP) represents the GDP elasticity of CO2 emissions, ΔCO2 represents the growth of CO2, and ΔGDP is the growth of the economy.
The judgment rules of Tapio decoupling were divided into two categories according to economic expansion and economic recession. Table 1 shows the judgment rules’ details.
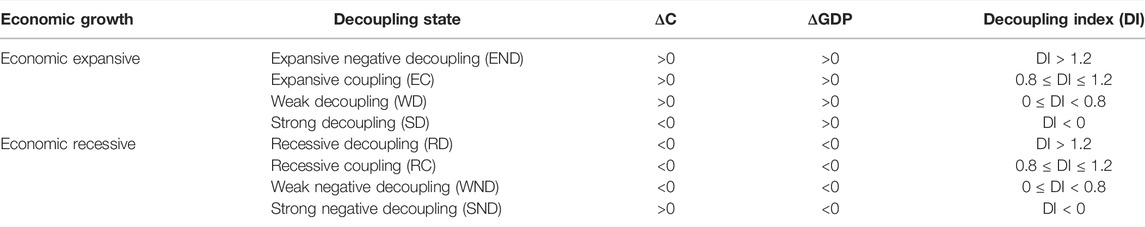
TABLE 1. Judgment rules of the Tapio decoupling index.
As the decoupling index constructed by Tapio is not affected by the base period year, the division is detailed, making it more objective and accurate than the OECD index. According to Table 1, due to China’s stable economic growth, %ΔGDP is always greater than 0, and the decoupling state is in four states in the stage of economic expansion. For different CO2 emission variables, if %ΔGDP is constant, then the smaller %ΔC is, the smaller the decoupling coefficient DI is and the stronger the decoupling degree is. Conversely, %ΔC is more significant, the decoupling coefficient DI is greater, and the degree is weaker.
We extended the Tapio model to analyze the role of different driving factors, where the driving factor decoupling model is given as
where ΔCO2 implies the difference in CO2 emission growth and X implies the growth of three different driving factors (energy structure, industrial structure, and population structure). According to Eq. 8, if %ΔC is constant, then the smaller %ΔX is, the greater the decoupling coefficient DI is and the greater the effect of the corresponding driving factors on CO2 emissions is. Conversely, the larger %ΔX is, the smaller DI is and the smaller the effect of the corresponding driving factors on CO2 emissions is.
3.2 Data Sources
3.2.1 CO2 Emission Estimation Model
The standard method used to estimate CO2 emissions is the emission factor by the IPCC, and it has been the most widely used method even at present. This method estimates carbon emissions based on the greenhouse gas inventory, such as “the 2006 IPCC national GHG guide” prepared by the IPCC (The Intergovernmental Panel on Climate Change, 2006) and “the provincial GHG inventory preparation guide” prepared by China (NDRC, 2011). We used the following specified formula for estimation:
where CO2 is total CO2 emissions related to energy consumption, ED represents the energy consumption, EF represents the carbon emission factors (Table 2), and the subscript I represents the energy type; here, we selected eight types that include coal, coke, crude oil, gasoline, kerosene, diesel, fuel oil, and natural gas.
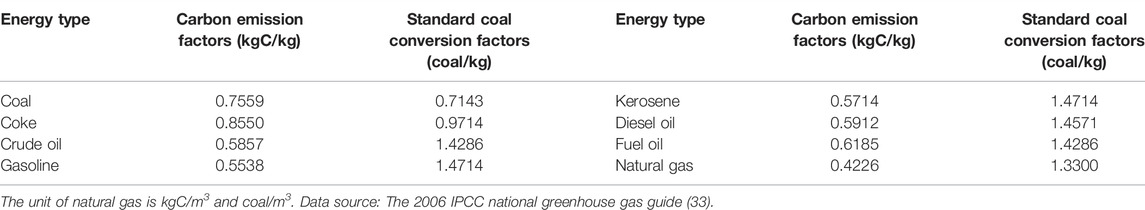
TABLE 2. Carbon emission factors and standard coal conversion factors of energy types.
3.2.2 Variables and Data Sources
Table 3 indicates the selected variables for this study, along with definitions. The energy consumption data were collected from the China Energy Statistical Yearbook (2001–2020) (NBS, 2001–2020). The GDP was calculated at the constant price of 2000. The population was counted at the end of the year. Total urban population, total population, GDP, and GDP index (last year = 100) were accumulated from China Statistical Yearbook 2020 (NBS, 2020).
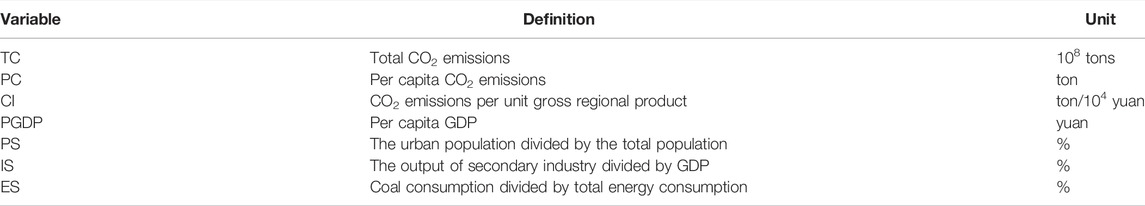
TABLE 3. Definitions of variables.
As shown in Table 4, the maximum amount of total CO2 emissions and the per capita CO2 emissions were about three times the minimum over the whole study period separately. The average annual growth rate was 6.05% from 2000 to 2019, slightly higher than the per capita CO2 emissions, which were 5.49% of the average annual growth rate. The CO2 emission intensity was 4.49 tons/104 yuan in 2000, but only 2.44 tons/104 yuan in 2019, i.e., nearly half in 20 years. The average per capita income was 20,417 yuan, and the highest was 37,000 yuan, about four times the minimum. The value of the industrial structure decreased from 47.56 to 38.97%, which showed that some achievements were made, but there is still much room for improvement. The mean of the energy structure was as high as 67.51%, but the minimum value was 57.7%. Although it was still more than half and was the primary energy consumption category, the gap between the proportion of non-coal energy and coal was narrowing. The maximum population structure was 60.6%, the minimum was 36.22%, and the average annual growth rate was 9.8%. It seemed that China’s urbanization was developing rapidly.
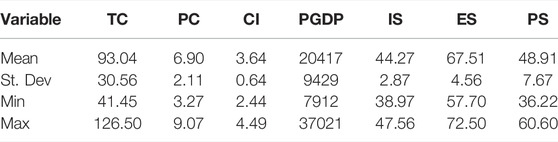
TABLE 4. Description statistics of the variables.
4 Results
4.1 EKC Model Results
Using Eqs. 3–5, the EKC model was tested. We first selected the square term for regression, if the results were significant, and then added the cubic term for regression. Rs.(1) and Rs.(2) showed the results of Eq. 3, Rs.(3) and Rs.(4) were for Eq. 4, and Rs.(5) and Rs.(6) were from Eq. 5.
As can be seen from Table 5, for Rs.(1), Rs.(3), and Rs.(5), each coefficient of the PGDP was positive, and each quadratic term coefficient was negative at the 1% level suggesting that China’s CO2 emission and per capita GDP follow an inverted U-shape. Meanwhile, for Rs.(2), Rs.(4), and Rs.(6), each of the coefficients of the PGDP was negative, each square term coefficient was positive, and each of the cubic term coefficients was negative. The results indicated that the relationship between CO2 emissions and PGDP was an inverted N curve, but none of the coefficients was significant. Therefore, it could be considered that the relationship supported the EKC hypothesis, that is, CO2 emissions enhanced first and then fell down with economic development. The turning point was 10.5432 for total CO2 emissions, 10.4674 for per capita CO2 emissions, and 9.4187 for CO2 emission intensity. The corresponding PGDP was CNY 37,919, CNY 35,151, and CNY 12,317, respectively. In 2006, the per capita GDP was CNY 13,722, more significant than the turning point of CO2 emission intensity, so it was obviously found that the CO2 emission intensity absolutely decoupled from the PGDP in 2006. The per capita GDP in 2019 was CNY 37,021, which was greater than the turning point of per capita CO2 emissions and smaller than the point of total CO2 emissions. Therefore, the per capita CO2 emissions were absolute decoupling too. However, the total CO2 emissions were relative decoupling.
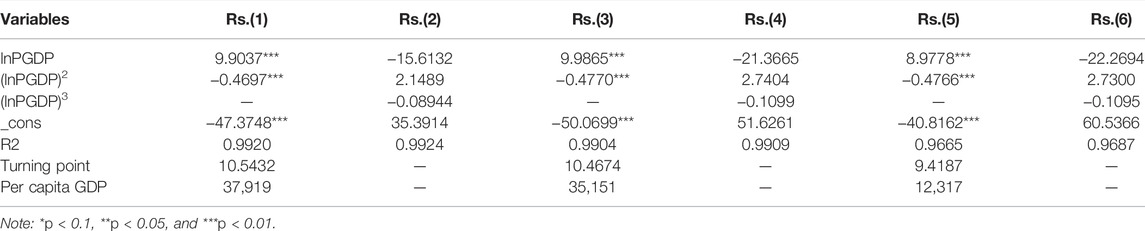
TABLE 5. Results of the EKC model.
4.2 Tapio Decoupling Model Results
Equation 7 was used for Tapio decoupling, and the results are revealed in Table 6. First, the decoupling index was calculated year by year, and then the decoupling coefficient was calculated per five years.
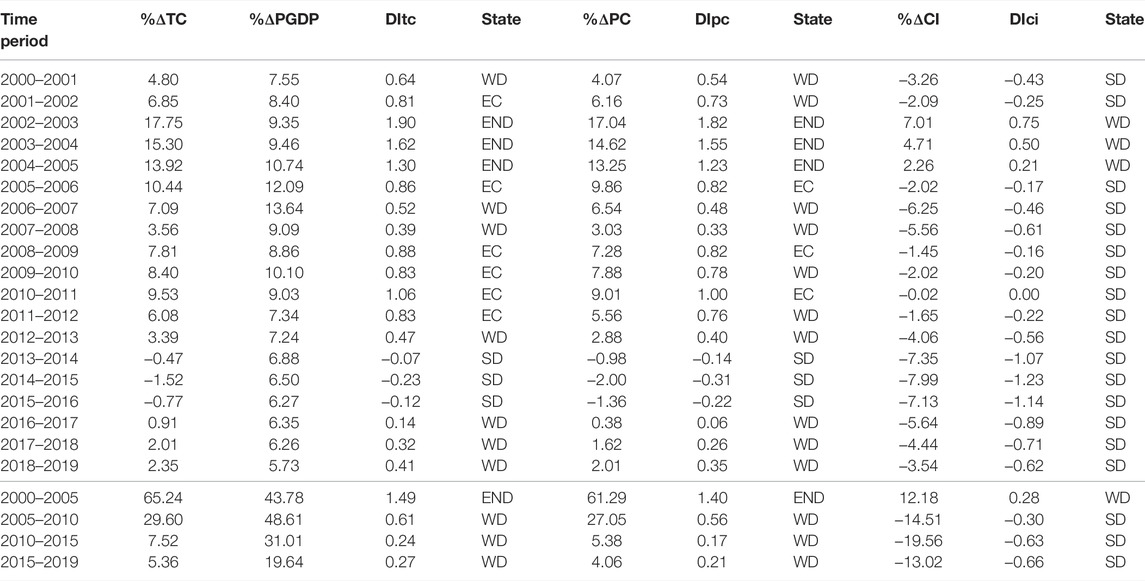
TABLE 6. Results of Tapio decoupling.
As shown in Table 7, the decoupling results corresponding to different CO2 emission variables were considerably different. From 2000 to 2019, the per capita CO2 emission decoupling index rose and fell. It did not achieve decoupling except in 2013–2016. The decoupling index of total CO2 emissions showed similar results, while the CO2 emission intensity showed strong decoupling except 2002–2005 with a state of weak decoupling. Figure 3A shows that the earliest decoupling time was CO2 emission intensity, followed by per capita CO2 emissions and total CO2 emissions. It was obviously confirmed that the decoupling index was periodic, but the peak decoupling coefficient gradually decreased; that is to say, the decoupling state was periodically enhanced.
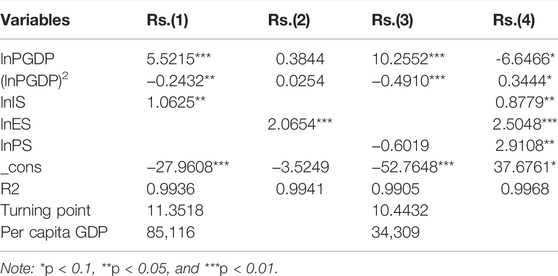
TABLE 7. Results of the influence factors.
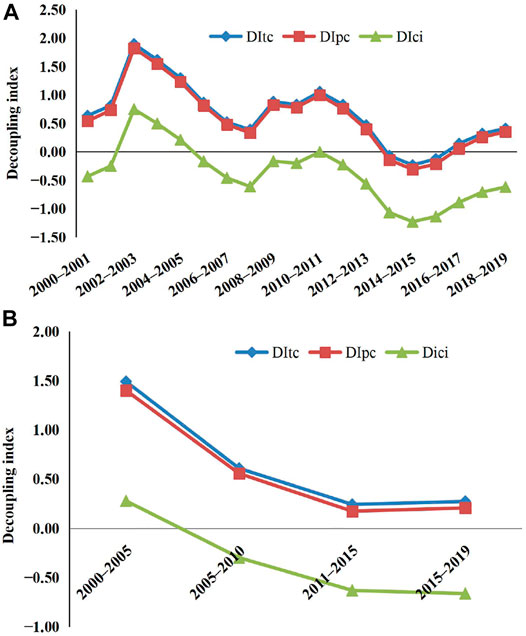
FIGURE 3. Trends of decoupling index from 2000 to 2019: (A) trends for year ; (B) trends for 5-year.
For the Five-Year Plan results, the decoupling index of the total CO2 emissions and the per capita CO2 emissions was weak decoupling except for the first five years. The decoupling for the CO2 emission intensity was weak decoupling only during the 10th Five-Year Plan period and was strong decoupling in the rest period. However, Figure 3B seems to show a U-shaped trend of each variable’s decoupling index.
4.3 Regression Results Showing the Influence Factors
As stated earlier, we used Eq. 6 to observe the effects of influence factors. As Table 5 already exhibited no complex N-shaped or inverted N-shaped curves, we removed the cubic term when adding the control variables. The regression results are exhibited in Table 7. Results (1)–(3) show the results of a single control variable; result (4) shows all control variables.
The industrial structure presented a significant and co-directional influence on the per capita CO2 emissions. The inverted U-shaped curve still existed, but the turning point was 11.3518, which changed a lot, and the corresponding per capita income was CNY 85,116, which was more greater than above. The per capita GDP and per capita CO2 had relative decoupling. The energy structure positively influenced the per capita CO2 emissions at the 1% level. However, the linear and quadratic coefficients of per capita GDP were positive and were not statistically significant. The EKC hypothesis was not valid. Therefore, the decoupling state was indeterminate. The population structure had a negative but non-significant impact. However, the EKC hypothesis still existed, and the threshold point was CNY 34,309, which was consistent with CNY 35,151 above.
When added, all three control variables, the industrial structure, energy structure, and population structure, all significantly presented a positive influence on the per capita CO2 emissions. While the relationship displayed a U-shaped curve, the EKC hypothesis did not exist.
Equation 8 was used to explore the influence of factors further. Table 8 shows the decoupling results between the influence factors, industrial structure, energy structure, and population structure, and per capita CO2 emissions.

TABLE 8. Influence factors’ decoupling results.
Table 8 indicates the impact factors’ decoupling results. Overall, the expansive negative decoupling was mainly shown for the industrial structure from 2000 to 2011, and strong negative decoupling was mostly exhibited from 2011 to 2019. The decoupling results were roughly divided into two stages for the energy structure too. They were mostly expansive negative decoupling in 2000–2011 and strong negative decoupling in 2011–2019. During the sample period 2000–2019, the decoupling of the population structure was mainly expansive negative decoupling, and the decoupling elasticity coefficient changed little.
From the Five-Year Plan results, it can be seen the decoupling between the industrial structure and per capita CO2 emissions manifested expansive negative decoupling only in 2000–2005 and showed strong negative decoupling in 2006–2019. The energy structure displayed similar results to the industrial structure. During the first two “Five-Year Plans,” the population structure showed expansive negative decoupling and then turned to weak decoupling during the following two “Five-Year Plans.” As displayed in Figure 4, the increment of CO2 emissions was positive, but the change rate strongly decreased from 61.29% in 2000–2005 to 4.06% in 2015–2019. Industrial and energy structures were negative with CO2 emissions, unlike the population structure that positively impacted CO2 emissions.
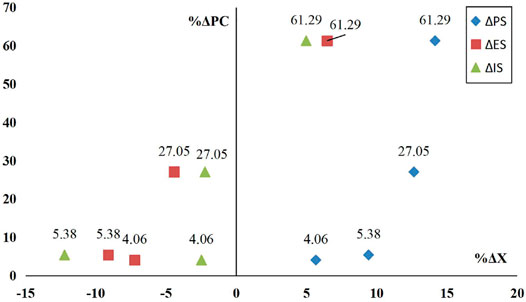
FIGURE 4. Decoupling index of influence factors per five years.
5 Discussion and Conclusion
5.1 Discussion of the EKC Results
From the EKC results shown in Section 4.1, the order for decoupling was CO2 emission intensity, per capita CO2 emissions, and total CO2 emissions. This was in support of the literature results by Wu et al. (2018) and Shuai et al. (2018). However, a new insight was that the per capita CO2 emissions in 2019 were greater than those in 2018, i.e., ΔC > 0, which is inconsistent with the result above. In other words, the change in per capita CO2 emissions did not decrease with economic growth. The probable reason was that other factors impacted the relationship between CO2 emissions and economic growth. Actually, after adding the control variable of industrial structure, the turning point has swollen significantly. The use of fossil fuels may lead to endogeneity, which distorts EKC results (Jin and Kim, 2020). As a result, the EKC was invalid after adding the control variable of energy structure.
The sign of the industrial structure matched expectations. The proportion of China’s secondary industry decreased from 47.56% in 2006 to 38.97% in 2019, so the industrial structure positively influenced CO2 emission reduction; a similar conclusion was found by Simbi et al. (2021), when they studied the CO2 emission patterns in Africa. However, the industrial structure led to a severe lag of the turning point; in other words, the absolute decoupling state could not be achieved in a short time. In the early stage of industrialization, there was an inhibitory influence on decoupling because of the scale effect (Wang and Su, 2019). The advantages of industrial structure upgrading seemed to be limited to reducing CO2 emissions. Liu et al. (2021) found the tertiary industry beginning to become a new growth point of China’s CO2 emissions, which supported our finding.
The elasticity coefficient of energy structure was positive and significant. This showed that upgrading the energy structure made an essential reduction effect on CO2 emissions. The elasticity coefficient of population structure was not significant in Rs.(3) but positive and significant in Rs.(4). The influence of the population structure was different on CO2 emissions of the economic structure and the technical structure (Liu and Han, 2021).
However, after introducing control variables, the U-shaped curve was unexpected. From the perspective of factor endowment structure, the growth of population structure fueled the shift of labor from agriculture to industry and service industry, and population has a negative impact on CO2 emissions (Roy et al., 2017; Shahbaz et al., 2017). The energy structure has declined, but the proportion of coal was still as high as 57.7% in 2019. Although some studies declared that clean energy could effectively reduce CO2 emissions (Pilatowska et al., 2020; Moutinho et al., 2018), other studies had found that the energy structure had little contribution to CO2 emissions (Ghazali and Ali, 2019; Han and Liu, 2018; Wang and Feng, 2017). For China, the power structure was heavily dependent on coal-fired power generation. Although the proportion of renewable energy has increased significantly, the utilization rate of new energy power generation is low, and the average wind and light rejection rate is high (Liu et al., 2021). Isik et al. (2019) found that renewable energy consumption was much higher than that of fossil energy in Texas, but they did not find the CO2 emissions reduced because of the swollen renewable energy consumption. Therefore, the inhibitory effect of energy structure optimization temporarily cannot offset the advancement effect of economic growth on CO2 emissions. To reduce the CO2 emissions and to develop the economy, we not only need to enhance the proportion of renewable energy and reduce the proportion of coal but also need to make technological breakthroughs, improve new energy power generation and energy storage technology (Liu et al., 2021), stabilize grid connection technology, and improve the utilization rate of renewable energy.
5.2 Discussion of the Tapio Decoupling Results
The periodicity of decoupling results was synchronized with the change cycle of economic growth. In 2000, the primary industry accounted for 14.7%. Due to the low consumption of fossil energy by agriculture, the CO2 emissions were also relatively low. However, the output of agriculture was low; to pursue higher economic growth, the proportion of industry increased, from 44.5% in 2002 to 47% in 2008 (NBS, 2020). According to China’s previous strong environmental pollution absorption capacity and the limit of science and technology development, many industrial projects with high energy consumption and high emissions were implemented in the climax of economic growth from 2002 to 2008. Consequently, an extensive economic growth model would lead to a doubling of environmental pressure (Li et al., 2021).
The US subprime mortgage crisis in 2008 triggered the global economic crisis, which affected China’s economic growth. Subsequently, with the efforts of the government, China’s economy recovered rapidly, triggering another wave of growth in CO2 emissions. China’s leading power’s economic development was still a secondary industry at that time (Li et al., 2021). Even though technology progressed, and carbon emission intensity was declining, the positive effect of technological progress on CO2 emissions was even offset by the negative effect of economic burgeoning growth (Wang and Feng, 2017) Since 2012, the industrial structure adjustment has achieved a part and positive effect in controlling CO2 emissions. In 2012, the output of the tertiary industry accounted for 45.5% of GDP, surpassed that of the secondary industry for the first time, and rose to 53.9% by 2019 (NBS, 2020). As a result, the decoupling index gradually decreased and even reached negative decoupling from 2013 to 2016.
However, the re-link phenomenon from 2016 to 2019 might be caused by the low level of scientific and technological innovation and slow structural adjustment in the high-carbon industry (Liu, et al., 2021). The high-carbon industries were energy-intensive industries and highly depended on fossil energy. The emission reduction effect of industrial structure optimization had not reached the expectation, and the impact of technological progress and technological efficiency of the manufacturing industry on decoupling was still relatively small (Hang et al., 2019). However, from the long-term trend, the peak value of the decoupling index future will not exceed the decoupling index in 2010–2011.
The CO2 intensity had been decoupled, but the decoupled index also increased slightly from 2016 to 2019. Although China’s CO2 intensity had decreased significantly by 40.96% from 2000 to 2019 (NBS, 2020), there is still a considerable difference between developed and developing countries. At present, China’s carbon intensity is 2.8 times that of the United States and Japan, 3.6 times that of Germany, 5.5 times that of Britain, and 6 times that of France (Mikayilov et al., 2018).
5.3 Discussion of the Influence Factors
The industrial structure greatly impacted CO2 emissions from the decoupling index of the three influencing factors. Different industrial structures have different characteristics of carbon dioxide emission density and energy consumption intensity (Zhou, 2022). During the course of an industrial structure optimization, the proportion of agriculture continues to decline, and the proportion of industry first rises and then falls. The proportion of the service industry continues to rise. The emission density of the service industry is lower than that of industry, and the economic output is higher than that of agriculture. It can be convinced that upgrading the industrial structure can not only reduce energy consumption (Qu and Li, 2019) but also ensure economic growth. However, the decoupling results from 2016 to 2019 showed that the advantages of industrial structure did not seem significant at this stage. For this reason, on the one hand, we need to increase investment in clean technology and vigorously develop clean technology in the tertiary industry. On the other hand, energy-intensive industries need to transfer to capital-intensive industries as soon as possible to satiate the advantages of energy structural updating.
The energy structure impacted little CO2 emissions, which was distinct from the EKC conclusion. From 2000 to 2011, the proportion of coal in energy consumption was almost unchanged, while CO2 emissions continued to proliferate. From 2011 to 2019, the proportion of coal continued to decline, but in Figure 4, the growth rate of carbon dioxide did not decline much from 2010 to 2019. On the changes in CO2 emissions, energy-intensive industries mainly depended on the impact of industrial structure and energy structure (Moreau et al., 2018). Therefore, on the one side, our enterprises should strive to raise energy efficiency and innovative technologies to enhance the utilization of renewable energy and reduce carbon dioxide emission intensity; on the other side, it is more important for the government to push for industrial structure transformation.
With the transfer of population structure to cities and towns, the rapid urbanization process affected the increase in CO2 emissions (Ali et al., 2019; Abbasi et al., 2020). The proportion of CO2 emissions from residents’ life, transportation, storage, and postal industries increased. In 2018, the CO2 emissions from these two industries accounted for 72.6% of the total emissions of the tertiary industry (Liu et al., 2021). Wang et al. (2018) also found that the population limits the decoupling of China and the United States. Therefore, in the urbanization process, the government should improve residents’ low-carbon awareness and advocate a low-carbon lifestyle, such as reducing takeout and reducing fuel vehicles.
5.4 Conclusions, Executive Suggestions, and Research Direction
The purpose of our work was to compare the decoupling of China with two different decoupling models from 2000 to 2019, mainly to investigate the changes in the new economic growth between 2012 and 2019. Investigation using both methods found the CO2 emission intensity had decoupled since 2006, but the CO2 emissions had not decoupled. The results of the EKC model showed that the PGDP had not spanned the turning point. Moreover, the results of the Tapio model displayed that CO2 emissions strongly decoupled from 2013 to 2016 but retreated to weak decoupling after 2016. In terms of influencing factors, energy and industrial structures positively impacted CO2 emission reduction. However, the advantages were not significant at the new stage because the decoupling situation was weaker in 2015–2019 than in 2010–2015, and the growth of CO2 emission rebounded after 2016. The population structure had a negative impact on CO2 emissions. Then, there was a new finding in the results of the EKC model; the EKC was not valid after the introduction of control variables and showed a U-shape. When the control variables were introduced one by one, only the energy structure caused the EKC hypothesis to be invalid. After adding the industrial structure, the turning point more than doubled from 37,919 yuan to 85,116 yuan.
We provided the following executive suggestions along with future research directions based on the above-drawn conclusions:
1) First, from the perspective of the decoupling trend, it is suggested that China should strengthen and further optimize its energy structure to match the industrial structure. Also, at the new stage of China’s economic development, the mismatch between the energy structure that is heavily dominated by coal and the industrial structure is the primary reason leading to the CO2 emission increase. Clean energy and circular economy strategies could possibly be the main driving force for achieving “carbon peak and carbon neutralization.” Under clean energy, the government should encourage the energy structure that of renewables, power to hydrogen-based. At the same time, research and innovation in the listed areas be considered.
2) Second, the government should strengthen low-carbon education for the public and let people change the traditional high-carbon lifestyle into a low-carbon lifestyle. The continuous growth of the population structure has become the main influencing factor for CO2 emission growth in recent years. Although the expansion of the urban population has promoted economic development, the lifestyles of many rural people remain traditional when they transfer to cities and towns. Publicity and guidance should be strengthened to enhance people’s low-carbon awareness.
3) Third, the government should strengthen and encourage technological innovation and encourage the synergistic effects of technological innovation, the industrial structure, and the energy structure on emission reduction. In addition to providing full support for low-carbon, energy-saving technologies, improving energy efficiency, and replacing coal with clean energy, China also needs to vigorously promote carbon capture and storage technologies to reduce carbon dioxide content in the atmosphere directly.
4) In addition, we need to strengthen institutional innovation, for example, using the carbon emission market to promote the establishment and improvement of the carbon financial system, implementing an individual carbon credit system, and encouraging the participation of everyone. China needs to seize the opportunities and challenges and strive to achieve the “carbon peak and carbon neutralization” goal as soon as possible.
Overall, the findings of this study can be helpful for China to take measures to manage carbon emissions. Given the data availability, the same models can be leveraged in other nations (Department of energy statistics, National Bureau of Statistics, 2001-2020).
Data Availability Statement
The original contributions presented in the study are included in the article/Supplementary Material, and further inquiries can be directed to the corresponding author.
Author Contributions
YH conceptualized the research idea, performed the methodology and formal analysis, administrated the project, supervised the work, validated the data, and wrote the original draft. YL curated and investigated the data. XL was involved in funding acquisition and reviewing and editing the paper.
Funding
This research was funded by the National Science Fund for Distinguished Young Scholars (Grant No. 71904059), Natural Science Research of Jiangsu Higher Education Institutions of China (Grant No. 19KJB580007), and Humanities and Social Science Research of Nanjing University of Posts and Telecommunications (Grant No. NYS217021).
Conflict of Interest
The authors declare that the research was conducted in the absence of any commercial or financial relationships that could be construed as a potential conflict of interest.
Publisher’s Note
All claims expressed in this article are solely those of the authors and do not necessarily represent those of their affiliated organizations, or those of the publisher, the editors, and the reviewers. Any product that may be evaluated in this article, or claim that may be made by its manufacturer, is not guaranteed or endorsed by the publisher.
References
Abbasi, M. A., Parveen, S., Khan, S., and Kamal, M. A. (2020). Urbanization and Energy Consumption Effects on Carbon Dioxide Emissions: Evidence from Asian-8 Countries Using Panel Data Analysis. Environ. Sci. Pollut. Res. 27 (15), 18029–18043. doi:10.1007/s11356-020-08262-w
Ajmi, A. N., and Inglesi-Lotz, R. (2021). Revisiting the Kuznets Curve Hypothesis for Tunisia: Carbon Dioxide vs. Ecological Footprint. Energy Sources, Part B Econ. Plan. Policy 16 (5), 1–14. doi:10.1080/15567249.2020.1850923
Alege, O. P., Adediran, S. O., and Ogundipe, A. A. (2016). Pollutant Emissions, Energy Consumption and Economic Growth in Nigeria. Int. J. Energy Econ. Policy 6 (2), 202–207.
Ali, R., Bakhsh, K., and Yasin, M. A. (2019). Impact of Urbanization on CO2 Emissions in Emerging Economy: Evidence from Pakistan. Sustain. Cities Soc. 48, 101553. doi:10.1016/j.scs.2019.101553
Ali, A., Usman, M., Usman, O., and Sarkodie, S. A. (2021). Modeling the Effects of Agricultural Innovation and Biocapacity on Carbon Dioxide Emissions in an Agrarian-Based Economy: Evidence from the Dynamic ARDL Simulations. Front. Energy Res. 8, 592061. doi:10.3389/fenrg.2020.592061
Allard, A., Takman, J., Uddin, G. S., and Ahmed, A. (2018). The N-Shaped Environmental Kuznets Curve: an Empirical Evaluation Using a Panel Quantile Regression Approach. Environ. Sci. Pollut. Res. 25 (6), 5848–5861. doi:10.1007/s11356-017-0907-0
Ameyaw, B., Li, Y., Annan, A., and Agyeman, J. K. (2020). West Africa's CO2 Emissions: Investigating the Economic Indicators, Forecasting, and Proposing Pathways to Reduce Carbon Emission Levels. Environ. Sci. Pollut. Res. 27 (12), 13276–13300. doi:10.1007/s11356-020-07849-7
Bhattarai, M., and Hammig, M. (2001). Institutions and the Environmental Kuznets Curve for Deforestation: A Crosscountry Analysis for Latin America, Africa and Asia. World Dev. 29 (6), 995–1010. doi:10.1016/s0305-750x(01)00019-5
Cohen, G., Jalles, J. T., Loungani, P., Marto, R., and Wang, G. (2019). Decoupling of Emissions and GDP: Evidence from Aggregate and Provincial Chinese Data. Energy Econ. 77, 105–118. doi:10.1016/j.eneco.2018.03.030
De Moor, J. (2018). The 'efficacy Dilemma' of Transnational Climate Activism: the Case of COP21. Environ. Polit. 27 (6), 1079–1100. doi:10.1080/09644016.2017.1410315
Department of energy statistics, National Bureau of Statistics (2001-2020). China Energy Statistical Yearbook. Beijing: Chinese Statistics Press.
Dong, K., Sun, R., Jiang, H., and Zeng, X. (2018). CO2 Emissions, Economic Growth, and the Environmental Kuznets Curve in China: What Roles Can Nuclear Energy and Renewable Energy Play? J. Clean. Prod. 196, 51–63. doi:10.1016/j.jclepro.2018.05.271
Ghazali, A., and Ali, G. (2019). Investigation of Key Contributors of CO2 Emissions in Extended STIRPAT Model for Newly Industrialized Countries: A Dynamic Common Correlated Estimator (DCCE) Approach. Energy Rep. 5, 242–252. doi:10.1016/j.egyr.2019.02.006
Gokmenoglu, K. K., and Taspinar, N. (2018). Testing the Agriculture-Induced EKC Hypothesis: the Case of Pakistan. Environ. Sci. Pollut. Res. 25 (23), 22829–22841. doi:10.1007/s11356-018-2330-6
Gough, I. (2017). Beyond Bonn: Eco-Social Policies for Social Justice and Environmental Sustainability”, Social Europe.
Grossman, G. M., and Krueger, A. B. (1995). Economic Growth and the Environment. Q. J. Econ. 110, 353–377. doi:10.2307/2118443
Han, Y. L., and Liu, Y. P. (2018). Study on Influencing Factors of Industrial in Jiangsu Based on LMDI Model. Environ. Sci. Technol. 41 (12), 278–284.
Hang, Y., Wang, Q., Zhou, D., and Zhang, L. (2019). Factors Influencing the Progress in Decoupling Economic Growth from Carbon Dioxide Emissions in China's Manufacturing Industry. Resour. Conservation Recycl. 146, 77–88. doi:10.1016/j.resconrec.2019.03.034
Hao, Y., Huang, Z., and Wu, H. (2019). Do Carbon Emissions and Economic Growth Decouple in China? an Empirical Analysis Based on Provincial Panel Data. Energies 12 (12), 2411. doi:10.3390/en12122411
Hasanov, F. J., Mikayilov, J. I., Mukhtarov, S., and Suleymanov, E. (2019). Does CO2 Emissions-Economic Growth Relationship Reveal EKC in Developing Countries? Evidence from Kazakhstan. Environ. Sci. Pollut. Res. 26 (34), 30229–30241. doi:10.1007/s11356-019-06166-y
Haseeb, A., Xia, E., DanishBaloch, M. A., and Baloch, M. A. (2018). Financial Development, Globalization, and CO2 Emission in the Presence of EKC: Evidence from BRICS Countries. Environ. Sci. Pollut. Res. 25 (31), 31283–31296. doi:10.1007/s11356-018-3034-7
Haseeb, M., Wattanapongphasuk, S., and Jermsittiparsert, K. (2019). Financial Development, Market Freedom, Political Stability, Economic Growth and C [O. Sub. 2] Emissions: An Unexplored Nexus in ASEAN Countries. Contemp. Econ. 13 (3), 363–375. doi:10.5709/ce.1897-9254.319
Hu, Z. Y., Liu, Y. W., and Tang, L. W. (2013). The Study on EKC Curve of Carbon Dioxide Emissions in China at the Background of Lower-Carbon Economy. Stat. Res. 30 (02), 73–79.
He, Y. D., Wen, H., and Sun, C. W. (2021). Forecasting China’s Total Carbon Emission and its Structure in the 14th Five-Year Plan: Based on Mixed-Frequency ADL-MIDAS Model. Econ. Prob. 4, 31–40.
Isik, C., Ongan, S., and Özdemir, D.(2019). The Economic Growth/development and Environmental Degradation: Evidence from the US State-Level EKC Hypothesis. Environ. Sci. Pollut. Res. 26, 30772–30781. doi:10.1007/s11356-019-06276-7
Jin, L., Duan, K. R., Shi, C. M., and Ju, X. W. (2017). The Impact of Technological Progress in the Energy Sector on Carbon Emissions: An Empirical Analysis from China. Int. J. Environ. Res. Public Health 14 (12), 1505. doi:10.3390/ijerph14121505
Jin, T., and Kim, J. (2020). Investigating the Environmental Kuznets Curve for Annex I Countries Using Heterogeneous Panel Data Analysis. Environ. Sci. Pollut. Res. 27 (9), 10039–10054. doi:10.1007/s11356-020-07668-w
Krisada, C., Chanakan, C., Nutnapha, L., and Kittisak, J. (2021). The Impact of Economic Growth, Globalization, and Financial Development on Co2 Emissions in ASEAN Countries. Acad. Strategic Manag. J. 20, 1–14.
Li, R. R., and Jiang, R. (2020). Investigating Effect of R&D Investment on Decoupling Environmental Pressure from Economic Growth in the Global Top Six Carbon Dioxide Emitters. Sci. Total Environ. 740, 140053. doi:10.1016/j.scitotenv.2020.140053
Li, Z., Sun, R. J., Qin, M. M., and Hu, D. O. (2020). Gasoline to Diesel Consumption Ratio: A New Socioeconomic Indicator of Carbon Dioxide Emissions in China. Sustainability 12 (14), 5608. doi:10.3390/su12145608
Li, M. Y., Zhang, S. H., Wang, C., and Cai, B. F. (2021). The Carbon Emission Status and Emission Reduction Positioning of Key Industrial Sectors. Chin. J. Environ. Manage. 3, 28–39.
Lin, J. Y. F. (2011). New Structural Economics: A Framework for Rethinking Development. World Bank Res. Observer 26 (2), 193–221. doi:10.1093/wbro/lkr007
Liu, D. N., and Xiao, B. W. (2018). Can China Achieve its Carbon Emission Peaking? A Scenario Analysis Based on STIRPAT and System Dynamics Model. Ecol. Indic. 93, 647–657. doi:10.1016/j.ecolind.2018.05.049
Liu, R. H., Wang, G., Huang, N., and Ding, M. L. (2021). Research on the Path of China's Scientific and Technological Innovation Supporting Carbon Peak and Carbon Neutralization. Soc. Sci. Guangxi. 8, 1–7.
Liu, Y. P., and Han, Y. L. (2021). Impacts of Urbanization and Technology on Carbon Dioxide Emissions of Yangtze River Economic Belt at Two Stages: Based on an Extended STIRPAT Model. Sustainability 13, 7022. doi:10.3390/su13137022
Meirun, T., Mihardjo, L. W., Haseeb, M., Khan, S. A. R., and Jermsittiparsert, K. (2021). The Dynamics Effect of Green Technology Innovation on Economic Growth and CO2 Emission in Singapore: New Evidence from Bootstrap ARDL Approach. Environ. Sci. Pollut. Res. 28 (4), 4184–4194. doi:10.1007/s11356-020-10760-w
Mikayilov, J. I., Hasanov, F. J., and Galeotti, M. (2018). Decoupling of CO2 Emissions and GDP: A Time-Varying Cointegration Approach. Ecol. Indic. 95, 615–628. doi:10.1016/j.ecolind.2018.07.051
Moreau, V., Neves, C. A. De. O., and Vuille, F. (2018). Is Decoupling a Red Herring? the Role of Structural Effects and Energy Policies in Europe. Energy Policy 128, 243–252. doi:10.1016/j.enpol.2018.12.028
Moutinho, V., Madaleno, M., Inglesi-Lotz, R., and Dogan, E. (2018). Factors Affecting CO 2 Emissions in Top Countries on Renewable Energies: A LMDI Decomposition Application. Renew. Sust. Energy Rev. 90, 605–622. doi:10.1016/j.rser.2018.02.009
Naqvi, S. A. A., Shah, S. A. R., and Mehdi, M. A. (2020). Revealing Empirical Association Among Ecological Footprints, Renewable Energy Consumption, Real Income, and Financial Development: a Global Perspective. Environ. Sci. Pollut. Res. 27 (34), 42830–42849. doi:10.1007/s11356-020-09958-9
Naqvi, S. A. A., Shah, S. A. R., Anwar, S., and Raza, H. (2021). Renewable Energy, Economic Development, and Ecological Footprint Nexus: Fresh Evidence of Renewable Energy Environment Kuznets Curve (RKC) from Income Groups. Environ. Sci. Pollut. Res. 28 (2), 2031–2051. doi:10.1007/s11356-020-10485-w
National Development and Reform Commission (2011). The Provincial Greenhouse Gas Inventory Preparation Guide. Beijing: China Statistics Press.
Ozturk, I., Majeed, M. T., and Khan, S. (2021). Decoupling and Decomposition Analysis of Environmental Impact from Economic Growth: a Comparative Analysis of Pakistan, India, and China. Environ. Ecol. Stat. 28, 793–820. doi:10.1007/s10651-021-00495-3
Pata, U. K. (2018). The Effect of Urbanization and Industrialization on Carbon Emissions in Turkey: Evidence from ARDL Bounds Testing Procedure. Environ. Sci. Pollut. Res. 25 (8), 7740–7747. doi:10.1007/s11356-017-1088-6
Peng, J. W., Huang, X. J., Zhong, T. Y., and Zhao, Y. T. (2011). Decoupling Analysis of Economic Growth and Energy Carbon Emissions in China. Res. Sci. 33 (4), 626–633.
Pilatowska, M., Geise, A., and Wlodarczyk, A. (2020). The Effect of Renewable and Nuclear Energy Consumption on Decoupling Economic Growth from CO2 Emissions in Spain. Energies 13 (9), 2124. doi:10.3390/en13092124
Prastiyo, S. E., Irham, , , Hardyastuti, S., and Jamhari., (2020). How Agriculture, Manufacture, and Urbanization Induced Carbon Emission? the Case of Indonesia. Environ. Sci. Pollut. Res. 27 (33), 42092–42103. doi:10.1007/s11356-020-10148-w
Qu, J. Y., and Li, K. (2019). Measurement and Analysis of “Decoupling” between Industrial Growth and Carbon Dioxide Emissions in China. J. Xi’an Jiaot. Univers. 39 (5), 92–104.
Roy, M., Basu, S., and Pal, P. (2017). Examining the Driving Forces in Moving toward a Low Carbon Society: an Extended STIRPAT Analysis for a Fast Growing Vast Economy. Clean. Technol. Environ. Policy 19 (9), 2265–2276. doi:10.1007/s10098-017-1416-z
Shah, S. A. R., Naqvi, S. A. A., and Anwar, S. (2020a). Exploring the Linkage Among Energy Intensity, Carbon Emission and Urbanization in Pakistan: Fresh Evidence from Ecological Modernization and Environment Transition Theories. Environ. Sci. Pollut. Res. 27 (32), 40907–40929. doi:10.1007/s11356-020-09227-9
Shah, S. A. R., Naqvi, S. A. A., Riaz, S., Anwar, S., and Abbas, N. (2020b). Nexus of Biomass Energy, Key Determinants of Economic Development and Environment: A Fresh Evidence from Asia. Renew. Sustain. Energy Rev. 133, 110244. doi:10.1016/j.rser.2020.110244
Shah, S. A. R., Naqvi, S. A. A., Nasreen, S., and Abbas, N. (2021). Associating Drivers of Economic Development with Environmental Degradation: Fresh Evidence from Western Asia and North African Region. Ecol. Indic. 126, 107638. doi:10.1016/j.ecolind.2021.107638
Shah, S. A. R., Naqvi, S. A. A., Anwar, S., Shah, A. A., and Nadeem, A. M. (2022). Socio-economic Impact Assessment of Environmental Degradation in Pakistan: Fresh Evidence from the Markov Switching Equilibrium Correction Model. Environ. Dev. Sustain.. doi:10.1007/s10668-021-02013-8
Shahbaz, M., Chaudhary, A. R., and Ozturk, I. (2017). Does Urbanization Cause Increasing Energy Demand in Pakistan? Empirical Evidence from STIRPAT Model. Energy 122, 83–93. doi:10.1016/j.energy.2017.01.080
Shuai, C. Y., Chen, X., Wu, Y., Zhang, Y., and Tan, Y. T. (2018). A Three-step Strategy for Decoupling Economic Growth from Carbon Emission: Empirical Evidences from 133 Countries. Sci. Total Environ. 646, 524–543. doi:10.1016/j.scitotenv.2018.07.045
Simbi, C. H., Lin, J. Y., Yang, D. W., Ndayishimiye, J. C., Liu, Y., Li, H. M., et al. (2021). Decomposition and Decoupling Analysis of Carbon Dioxide Emissions in African Countries during 1984-2014. J. Ecviron. Sci. 102, 85–98. doi:10.1016/j.jes.2020.09.006
Sun, Y., Li, M. X., Zhang, M. J., Khan, H. S. U. D., Li, J. Q., Li, Z. Y., et al. (2021). A Study on China's Economic Growth, Green Energy Technology, and Carbon Emissions Based on the Kuznets Curve (EKC). Environ. Sci. Pollut. Res. 28 (6), 7200–7211. doi:10.1007/s11356-020-11019-0
Tapio, P. (2005). Towards a Theory of Decoupling: Degrees of Decoupling in the EU and the Case of Road Traffic in Finland between 1970 and 2001. Transp. Pol. 12 (2), 137–151. doi:10.1016/j.tranpol.2005.01.001
The Intergovernmental Panel on Climate Change (IPCC) (2006). IPCC Guidelines for National Greenhouse Gas Inventories. Hayama, Kanagawa, Japan: Institute for Global Environmental Strategies.
Wang, M., and Feng, C. (2017). Decomposition of Energy-Related CO2 Emissions in China: An Empirical Analysis Based on Provincial Panel Data of Three Sectors. Appl. Energy 190, 772–787. doi:10.1016/j.apenergy.2017.01.007
Wang, Q., and Su, M. (2019). The Effects of Urbanization and Industrialization on Decoupling Economic Growth from Carbon Emission - A Case Study of China. Sustain. Cities Soc. 51, 101758. doi:10.1016/j.scs.2019.101758
Wang, Q., Zhao, M. M., Li, R. R., and Su, M. (2018). Decomposition and Decoupling Analysis of Carbon Emissions from Economic Growth: A Comparative Study of China and the United States. J. Clean. Prod. 197, 178–184. doi:10.1016/j.jclepro.2018.05.285
WMO (2021). The State of the Global Climate 2020 (WMO-No.1264). Switzerland: World Meteorological Organization.
GDP Growth Annual (%)-China (2020). Available on: https://data.worldbank.org/indicator/NY.GDP.MKTP.KD.ZG?end=2020&locations=CN&start=1961&view=map&year=2020.
Wu, Y., Tam, V. W. Y., Shuai, C. Y., Shen, L. Y., Zhang, Y., and Liao, S. J. (2018). Decoupling China's Economic Growth from Carbon Emissions: Empirical Studies from 30 Chinese Provinces (2001-2015). Sci. Total Environ. 656, 576–588. doi:10.1016/j.scitotenv.2018.11.384
Xia, C. X., and Wang, Z. L. (2020). The Effect of Fossil Fuel and Hydropower on Carbon Dioxide Emissions: EKC Validation with Structural Breaks. J. Environ. Eng. Landsc. 28 (1), 36–47. doi:10.3846/jeelm.2020.11832
Zaidi, S. A. H., Zafar, M. W., Shahbaz, M., and Hou, F. J. (2019). Dynamic Linkages between Globalization, Financial Development and Carbon Emissions: Evidence from Asia Pacific Economic Cooperation Countries. J. Clean. Prod. 228, 533–543. doi:10.1016/j.jclepro.2019.04.210
Zhang, Q., Naqvi, S. A. A., and Shah, S. A. R. (2021). The Contribution of Outward Foreign Direct Investment, Human Well-Being, and Technology toward a Sustainable Environment. Sustainability 13 (20), 11430. doi:10.3390/su132011430
Zhou, M. Z. (2022). Global Carbon Emission Pattern and China's Challenges. Available at: https://baijiahao.baidu.com/s?id=1698066633643641593&wfr=spider&for=pc (Accessed February 15, 2022).
Keywords: carbon dioxide emissions, decoupling analysis, economic growth, EKC, Tapio decoupling model
Citation: Han Y, Liu Y and Liu X (2022) Decoupling Re-Analysis of CO2 Emissions and Economic Growth From Two Dimensions. Front. Energy Res. 10:896529. doi: 10.3389/fenrg.2022.896529
Received: 15 March 2022; Accepted: 31 May 2022;
Published: 08 July 2022.
Edited by:
Anshu Priya, City University of Hong Kong, Hong Kong SAR, ChinaReviewed by:
Kittisak Jermsittiparsert, University of City Island, CyprusSyed Ale Raza Shah, Xi’an Jiaotong University, China
Copyright © 2022 Han, Liu and Liu. This is an open-access article distributed under the terms of the Creative Commons Attribution License (CC BY). The use, distribution or reproduction in other forums is permitted, provided the original author(s) and the copyright owner(s) are credited and that the original publication in this journal is cited, in accordance with accepted academic practice. No use, distribution or reproduction is permitted which does not comply with these terms.
*Correspondence: Yuling Han, aGFubmp1cHRAMTYzLmNvbQ==