 Qifeng Huang1
 Kaijie Fang
 Hanmiao Cheng
- 1Marketing Service Center, State Grid Jiangsu Electric Power Co., Ltd, Nanjing, China
- 2School of Automation, Nanjing University of Science and Technology, Nanjing, China
- 3Xi’an XD Power Systems Co., Ltd., Xi’an, China
Taking into account energy management and fire safety, electric bicycles are one of the most significant household loads that require real-time sensing for nonintrusive load monitoring. V–I trajectories, power quantities, and harmonic characteristics are the basic selection in feature space for appliance identification. Based on the study of the charging mode of electric bicycles, this study expands the V–I trajectory into V-△I trajectory for gaining the load signature with multi appliances working simultaneously. We perform linear interpolation and pixelation to obtain a bitmap of the V-△I trajectory. Meanwhile, active and harmonic features are encoded and combined to form a hybrid feature bitmap, which is unique to compensate for the high harmonic feature loss caused by the pixelation of the V-△I trajectory. Furthermore, we trained the DeiT model on the self-built dataset and UK-DALE dataset and performed two experiments under single and superposition working conditions for electric bicycles. Our case results indicate that the DeiT model using hybrid feature bitmap offers better overall precision in the prediction of electric bicycles, against other deep convolutional neural networks.
1 Introduction
Benefiting from the cheap price and convenient usage, electric bicycles are an important means of transportation for people, especially in China and Southeast Asian countries, and the number of electric bicycles has exceeded 300 million in China.
However, due to poor product quality, illegal modification, and chaotic parking and charging, safety accidents such as fires caused by electric bicycle charging have frequently occurred, which seriously endangered users and their neighborhoods. According to the data from the Fire and Rescue Bureau of the Ministry of Emergency Management of China, there are about 2,000 electric bicycle fire incidents every year around China, and about 80 percent of the accidents occurred during the charging process. For instance, on 8 August 2020, three residents lost their lives in an electric bicycle fire in Gulou District, Nanjing City, Jiangsu Province.
From a security and management perspective, the charging electric bicycles become one kind of malignant load in the grid. The behaviors have high randomness and strong concealment, which cause low efficiency and a high missed detection rate in the human inspection executed by managerial staff. The simple and convenient way to handle this problem is to monitor the charging behavior all the time on the grid side.
Professor Hart proposed the concept of load monitoring in the 1980s (Hart, 1992). Also, the nonintrusive load monitoring (NILM) technology rapidly received a lot of attention from scholars around the world. By analyzing the bus current from a smart meter, NILM can monitor the start and stop of each appliance of residential users and sense the detailed electricity consumption in the household (Zoha et al., 2012). As a special household load, electric bicycles can be completely recognizable and sensed by NILM without any additional plug-in equipment in the household.
Generally, four main stages are vital in NILM, consisting of data collection, event detection, feature extraction, and load identification (Ruano et al., 2019). Relying on metering, data collection can obtain voltage, current, active power, reactive power, and other features at low frequency and gain harmonic, transient waveform, and other information at high frequency. Then, the load event should be detected for gaining the start and end time. Li proposed an algorithm for load event detection in smart homes based on wide and deep learning that combines the convolutional neural network and the soft-max regression (Li et al., 2021). As for data collection and event detection, electric bicycles follow many commercial plug-in devices and detectors of NILM.
In terms of feature extraction, the active, reactive, and apparent powers denoted as P, Q, and S, respectively, calculated from the time series of current variables are the most used features (Kelly and Knottenbelt, 2015a; Le et al., 2015). Some start-up transient feature parameters with clear physical meanings are designed for motor load identification (Liu et al., 2022). Also, many researchers apply different mathematical manipulations, such as fast Fourier transform (FFT) (Nguyen et al., 2017; Bouhouras et al., 2017), discrete wavelet transformation (DWT) (Chang H H et al., 2013), and Hilbert transform (HT) (Gabaldón et al., 2014), to deal with high-frequency time series and gain abundant information in the frequency domain, while a normalized steady-state voltage and current signals during one cycle called V-I trajectories are considered distinguishable load signatures (Hassan et al., 2013; Wang et al., 2018). In the study by Gao et al., (2015), contrast examples based on the PLAID public dataset certify that V–I trajectories have more advantages in identification than other high-frequency features.
The load identification algorithm can be divided into optimization approaches and machine learning methods (Zoha et al., 2012). With the improvement of the types of identification appliances, the NP dimension of the optimization gets bigger, and the efficiency of optimization is difficult to improve. However, the machine learning methods, represented by an artificial neural network (Chang et al., 2015), support vector machine (Su et al., 2019), and decision tree (Buddhahai et al., 2018), can build lots of classifiers through offline data training. Also, a convolution neural network implemented on hardware was used to identify the appliance through the voltage and current (V–I) trajectory. Showing 78.16% accuracy in the PLAID dataset, the CNN algorithm also has low processing time (5.7 ms) and power consumption (1.868 W) (Baptista et al., 2018).
The nonintrusive load identification models and algorithms almost focus on multiple classes of appliances and lack the identification method for a single special class such as electric bicycles. This study builds an electric bicycle sensing model based on a hybrid feature bitmap and DeiT. First, the hybrid feature bitmap, combined with V-△I trajectory features, power features, and high-harmonic features, is proposed in this study to avoid the information loss caused by normalization and pixelation of the trajectory. Then, this study incorporates the collecting electric bicycle charging data and other appliance data from the self-build dataset and the UK-DALE dataset into DeiT for training. In view of the single-class identification of electric bicycles, the positive data are the images of electric bicycles, and the negative data are other different appliances. Also, the case under multi-devices working at the same time is tested to effectively avoid the error identification problem of unknown electrical input. In addition, the main contributions/innovations of this study can be concluded as follows:
• By improving the V–I trajectory into V-△I trajectory, the feature of electric bicycle load becomes more unique and efficient for identification.
• This study proposes one novel hybrid bitmap construction method to gain the most suitable input data for subsequent image classifier.
• This study adapts the DeiT to realize the accurate identification of electric bicycle load in a single and complex working scene.
This study is organized as follows: the charging process of the electric cycle and its improved V-△I trajectory are presented in Section 2; Section 3 illustrates the construction of a hybrid feature bitmap of electric bicycles. Also, an electric bicycle identification model based on DeiT is provided in Section 4; Section 5 shows the practicability and effectiveness through examples, and finally, conclusions are drawn in Section 6.
2 Charging Process and the V-△I Trajectory of Electric Bicycles
2.1 Charging Process of Electric Bicycles
Similar to electric vehicles, electric bicycles are powered by batteries, widely known as nickel-metal hydride (NiMH) and lithium-ion (Li-ion) batteries, which require circulated energy supplement during reduplicated driving. As shown in Figure 1, the charger is essentially a single-phase AC/DC power supply with control voltage and current output capability.
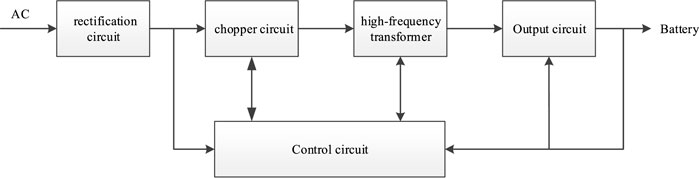
FIGURE 1. Block diagram of the electric bicycle charger.
Due to the rectification and chopping links, there are a large number of odd harmonics in its output direct current. Figure 2 shows the charging current waveform directly, with a typical triangular wave appearing. Accordingly, the ratios of harmonic content are presented in Figure 3, which are particularly obvious on odd harmonics such as three, five, and seven times.
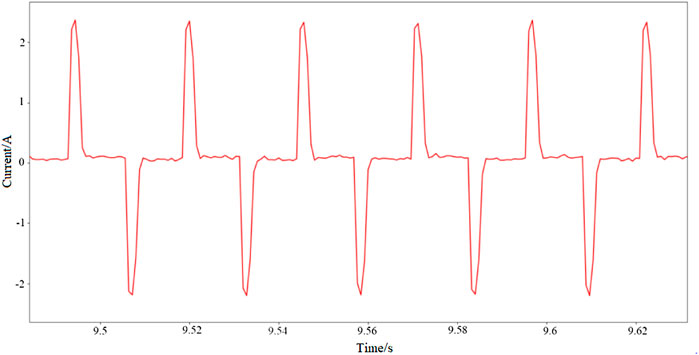
FIGURE 2. Current waveform during the electric bicycle charging.
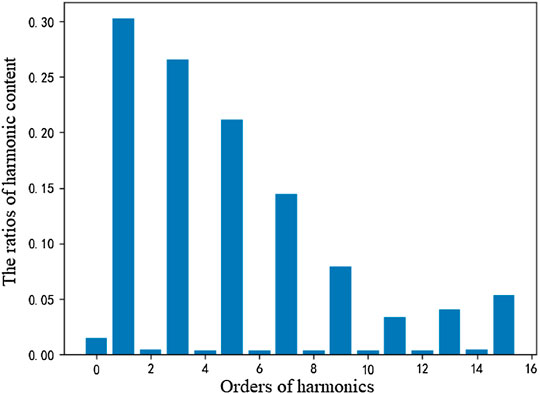
FIGURE 3. Ratios of harmonic content during the electric bicycle charging.
The charging method directly impacts the safety, durability, and performance of batteries. An unscientific charging method can significantly reduce the life of batteries and cause danger. According to Young et al. (2013), there are three stages in common charging methods shown in the Figure 4.
1) Constant current stage. In the beginning, a large current should be applied to the battery to supply the energy at maximum speed. In order to maintain a constant current to the battery, controlled charging voltage is applied to the battery. However, the voltage of the grid side is basically unchanged, so the overall power is high and constant. In this scheme, the state of charge (SOC) will increase linearly and rapidly till the cut-off point constantly reaches the thermal or other chemical limits.
2) Constant voltage stage. Aimed at protecting the battery, the current has been adjusted to a smaller and more flexible value for batteries. Also, as the SOC of batteries increases, the current gradually decreases to a low level.
3) Mixed stage. The mixed stage is the combination of constant voltage and constant current methods. In this stage, the battery will be filled with less current and voltage.
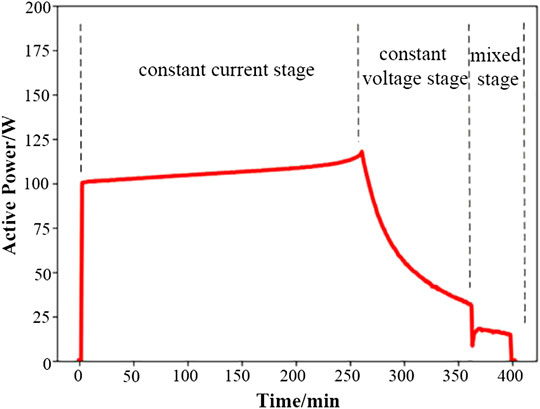
FIGURE 4. Active power curve in three charging stage.
2.2 V-△I Trajectory of Electric Bicycles
The V–I trajectory refers to the mutual trajectory of the instantaneous voltage and the current waveform of the electrical load (Hassan et al., 2013), which is mathematically manifested as a function of the sampling voltage and the current over a cycle. Baets proves that the V–I trajectories of household loads can be extracted from the delta of voltage and current samples before and after the start-up event (De Baets et al., 2018). Figure 5 shows the shapes of the V–I trajectories of two kinds of collected electric bicycles.
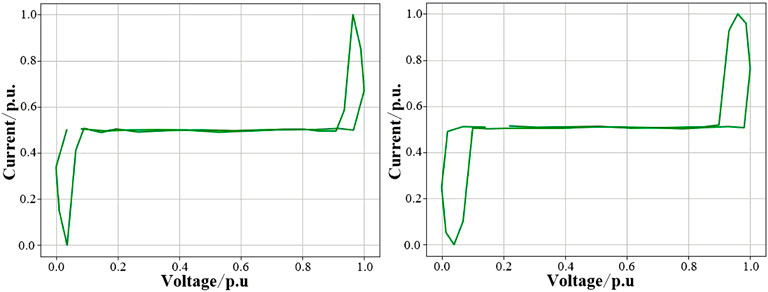
FIGURE 5. V–I trajectories of two kinds of collected electric bicycles.
It is clear that the V–I trajectory exhibits distinct and easily distinguishable shape properties for electrical loads with different operating principles such as heating, motor driving, and electronic driving. At the same time, the voltage of the gird is relatively stable, and the voltage waveform of different loads is basically consistent. Therefore, the V–I trajectory can be equivalent to the current waveform characteristics of the reactive load device.
However, it should be noted that these V–I trajectories are drawn in the stable working state of the electric bicycles, without any other appliances working. When the electric bicycle load is started based on other appliances working, the steady-state current is the sum of the electric bike and other electric currents based on Kirchhoff laws. At this point, it is conceivable that the V–I trajectory of the mixed working state is severely distorted, as shown in Figure 6. The V–I trajectory under multiple appliances simultaneous operating cannot present the typical shape of electric bicycle load.
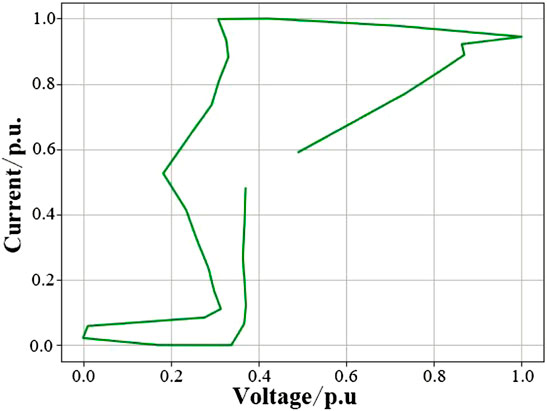
FIGURE 6. V–I trajectory of mixed state with electric bicycles and hairdryer both working.
Considering that the load equipment startup is a very short transient process, assuming that the working waveform of already-on appliances is completely unchanged before and after the start event of another electric load on these background appliances is reasonable. Therefore, the difference vector (△I) of the current waveforms before and after the start of the electric bicycles will filter the effect caused by other working appliances. The V-△I trajectories calculated by the current differences and voltage will return to the situation with only one device working, where the voltage vector can take any cycle near the start event. Moreover, there are many event detection methods for NILM, such as generalized likelihood ratio (GLR) (Berges et al., 2011) and log-likelihood ratio (LLR) (Anderson et al., 2012a). In this study, a modified CUSUM algorithm (Fang et al., 2020) with a fast and accurate detection effect is adopted.
Finally, the V-△I trajectories of the electric bicycle devices are only approximated, not identical, which are just like the Arabic handwritten letters. Correspondingly, the identification of the electric bicycles, similar to the Arabic handwritten letter recognition, adopts image construction methods and an image recognition model.
3 Building the Hybrid Feature Bitmap
In the Arabic handwritten letter recognition system, gaining the bitmaps is the first and significant step, which can reduce the complexity of characteristics and improve the accuracy of the subsequent identification. At the same time, the bitmaps cause the fuzzification of the images, which makes different devices in the same category share closer features.
3.1 The Linear Interpolation and Pixelization of the V-△I Trajectory
In order to effectively handle the V-△I trajectories within the same category, this study proposes a three-step mapping algorithm, mapping the V-△I trajectory into a binary bitmap where each cell is assigned one binary number.
Given that the V-△I trajectory is drawn from current and voltage samples whose frequency may not match or meet the requirement, the first step is to perform the linear interpolation for the V-△I trajectory using the formulas given by Hart, (1992); Zoha et al., (2012). Assuming that the number of the original current or voltage samples during one cycle is
In the formula given by Hart (1992) and Zoha et al. (2012),
The second step is normalization. Changing the values of current and voltage expended sequence per unit which ranges from 0 to 1 is necessary by formula (Ruano et al., 2019) and (Li et al., 2021).
In the formula given by Ruano et al. (2019) and Li et al. (2021),
The expended current and voltage sequences should be mapped into the bitmap in the third step, also called pixelization. Generally, the mapping process involves scanning each point in sequence and finding the location cell in the image which has m*m grid cells. The cells occupied by points in sequences will be colored in black, and unmatched cells will be white. A binary matrix, corresponding to a black-and-white bitmap, can be calculated by the formula given by Liu et al. (2022).
In the formula given by Liu et al. (2022), x and y are row and column indexes of matrix
It is noted that the parameter
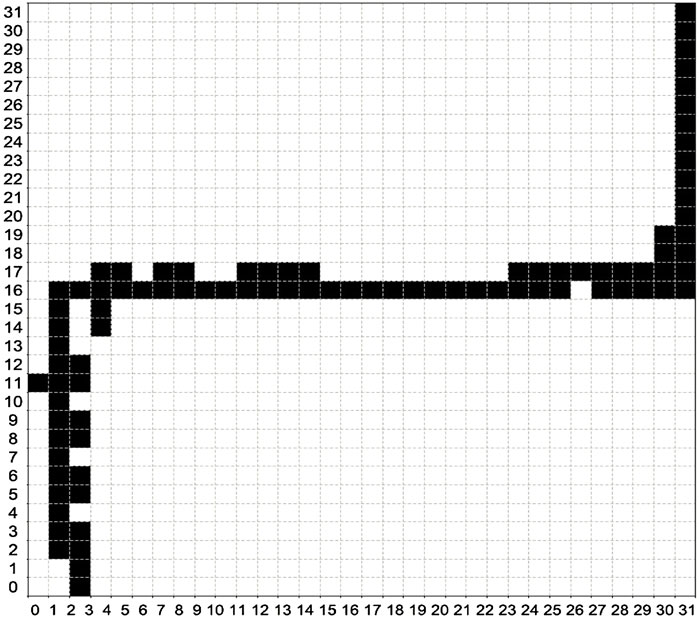
FIGURE 7. Typical bitmap of the V-△I trajectory of electric bicycles.
3.2 Mixed Feature Bitmap
Not surprisingly, the normalized V-△I trajectories lack information about active and reactive power. Therefore, the bitmap of the household with the same working principle but different working power, such as laptop and television, is not considered. In addition, harmonic amplitude and phase, as the effective harmonic features, are also not considered.
To solve the problem caused by the normalization and pixelization of the V-△I trajectory and improve the accuracy of load identification, supplementary features such as active power, reactive power, and harmonic current should be added to the bitmap. This study proposes the mixed feature bitmap, combining the V-△I trajectory, active power, reactive power, and high odd harmonic currents from 5 to 15.
Each supplementary feature is just one single value within the real number fields, differing from the two-dimensional images. It is necessary to change the single value into a special image that only has one column of pixels. Before transforming, the normalization of the supplementary feature should be executed. After all, the units vary across the supplementary parameters. Also, the formula given by Kelly and Knottenbelt (2015b) shows the calculating process during all samples of the supplementary feature.
In the formula given by Kelly and Knottenbelt (2015a),
After normalizing, the next step of gaining the hybrid feature bitmap is to encode and splice the image. First, each normalized feature, constantly within [0, 1], is expended to an integer within
4 The Identification Model Based on Data-Efficient Image Transformers
Obviously, this study draws a black and white image for each sample, called a hybrid feature bitmap, containing the V-△I trajectory, active power, reactive power, and harmonic features. Just like one given Arabic handwritten letter system, electric bicycle load can be extracted and identified by convolutional neural networks (CNNs). In this study, the Data-efficient image Transformer (DeiT) model, which has achieved better results on the large dataset ImageNet, is used for electric bicycle recognition.
The transformer is a natural language processing (NLP) model proposed by Google in 2017 (Vaswani A et al., 2017). Based on the self-attention mechanism, it can not only be trained in a parallel way but can also capture global context information and mine the dependencies between long-distance information. In October 2020, Dosovitskiy proposed the Vision Transformer (ViT) model (Dosovitskiy A et al., 2020), an image classification scheme based entirely on the self-attention mechanism. It is also the first work in the CV field where the Transformer completely replaces standard convolution. However, the ViT model requires millions of datasets to achieve ideal accuracy and generalization ability, and it is difficult for most researchers and projects to obtain such large datasets and computing resources, especially in the field of electric bicycle identification. Therefore, Facebook proposed a Data-efficient image Transformer (DeiT) (Touvron H et al., 2021) model based on knowledge distillation in 2021, which efficiently reduces the amount of dataset and time required for training without declining the accuracy of ViT.
4.1 Transformer and ViT
The Transformer framework consists of an encoder and a decoder. The encoder comprises N identical encoder layers. Each encoder layer includes sub-modules such as multi-head attention, sum and norm layer, feed-forward neural network, etc. The decoder also comprises N identical decoder layers. In addition to including the same four sub-modules as the encoder, each decoder also adds a masked multi-head attention module to avoid subsequent information in the decoding process as known information to predict the current information.
The heavy use of the layer called self-attention is most special in Transformer. Also, the Attention mechanism imitates the internal process of biological observation behavior, and increasing the fineness of observation in some areas can quickly extract important features of sparse data. Self-attention is a variant of the attention mechanism, which reduces the dependence on external information and is better at capturing the internal correlation of data or features. The application of the self-attention mechanism in text mainly solves the problem of long-distance dependence by calculating the mutual influence between words. Multihead self-attention is the connection and mapping of multiple self-attention mechanisms. The purpose is to construct multiple sub-spaces and find correlations between input data from different angles so that multiple relationships and subtle differences can be encoded.
Compared with the traditional cyclic neural network, the Transformer network has no input sequence but adopts the idea of parallelization to speed up the operation so that the model can process the next sequence at the same time when the result of the previous sequence has not been revealed. Therefore, in order not to lose order, it is necessary to combine position embedding before inputting the sequence.
In order to convert the image into sequence data that can be processed by the Transformer structure, the two-dimensional image is first processed into blocks (sequence of flattened 2D patches), and then each image patch is flattened into a one-dimensional vector through a linear transformation (full connection layer). At the same time, position coding is introduced, and the position information of the sequence is added. In addition, a classification flag (class) is added before the input sequence data as a learnable embedding vector for outputting classification prediction.
4.2 DeiT Model
The DeiT model uses distillation to guide ViT to learn from the teacher model, achieving better performance than the teacher model and spending less training overhead than the original ViT.
The method involves adding a distillation token after the input patch tokens. This token is used for computing the first loss function in the learned representation and the label of the teacher model. The representation and ground truth corresponding to the original class token are used for the second loss, and finally, the learning results of the two tokens are used. After linear transformation, they are used together as inferred embeddings.
There are two loss functions called soft loss and hard loss shown given in the formula by Le et al. (2015) and Nguyen et al. (2017), respectively.
where
4.3 The Identification Process Based on DeiT
The overall flow of the electric bike recognition model based on DeiT presented here is shown in Figure 8. First, the high-frequency voltage and current data of all kinds of electrical appliances obtained are preprocessed. Subsequently, the trajectory image is generated, pixelated, and encoded to build a hybrid feature bitmap. Finally, the hybrid bitmap is used as an input to the image classifier, and the DeiT model is used for feature extraction and classification to complete the load recognition task.
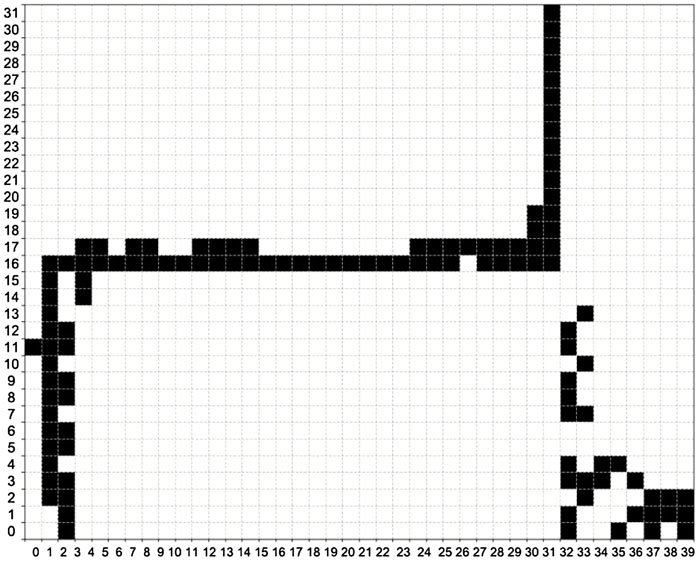
FIGURE 8. Hybrid feature bitmap of electric bicycles.
5 Case Study
5.1 Training Data Gaining
Generally, the example verification of the nonintrusive load identification algorithm uses standard load datasets, such as BLUED and PLAID. The existing datasets released by European and American scientific research institutes mainly focus on households in these areas. Table 1 shows the main features of the household load datasets with more number of references.
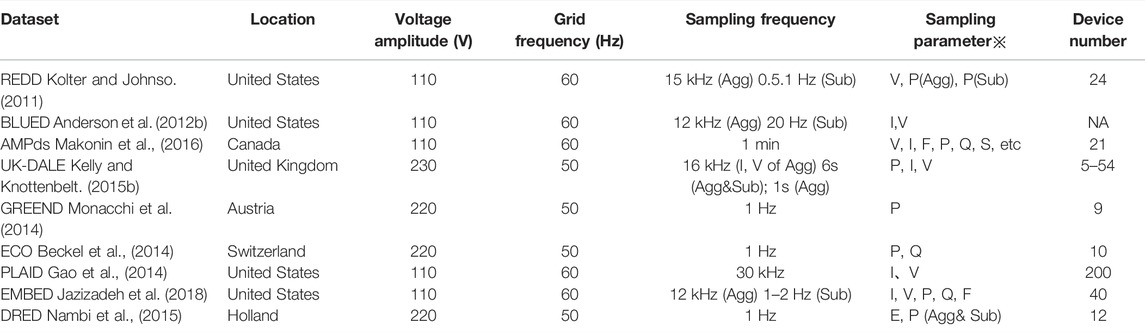
TABLE 1. Main differences between popular load datasets.
Unfortunately, these datasets shown in the table are not well-suited for verification in this study. There are three main reasons for this. First, these existing load datasets lack the electric bicycle data. Second, the supply mode, voltage amplitude, and grid frequency for European and American users are quite different from those in China and Southeast Asia. Finally, the cases in which electric bicycle charging event happens under the ON-STATE appliances are also missed in these datasets, so the ability to identify the electric bicycles in more complex situations cannot be tested.
In order to solve the problem of lacking effective load data, a customized load data acquiring device which uses AD7685 from ADI as the core sampling chip, shown in Figure 9, is designed to use in this study. The schematic diagram of our device is shown in Figure 10. The collected data mainly include current, voltage, and active and reactive data at 1.6 kHz. Using this device, more than 507 pieces of data on electric bicycles and nearly 2,340 pieces of data on other household appliances under independent working were recorded separately. Meanwhile, 493 pieces of data on electric bicycles working with other appliances at the same time are also recorded.

FIGURE 9. Overall flow chart of this method. The physical picture of the data acquiring device.
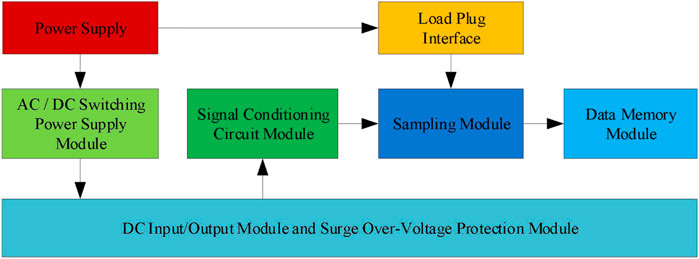
FIGURE 10. Schematic diagram of the data acquiring device.
The shortcomings of the load types of existing datasets and the amount of data on self-built datasets are both considered. This study adopts part data from UK-DALE which is most similar to the operation of the Chinese distribution network and combines the self-built datasets and UK-DALE as the training set, which contain the electric bicycles under single and superposition working condition. The detailed composition of the training set is shown in Table 2, and the division of the dataset is shown in Table 3. Focusing on identifying electric bicycles, the positive examples in the data set are electric bicycle data, including electric bicycle superposition with other electrical appliances. The counter-examples are various other electrical appliances, including air conditioners and hairdryers. The final DeiT algorithm is a binary classification model.
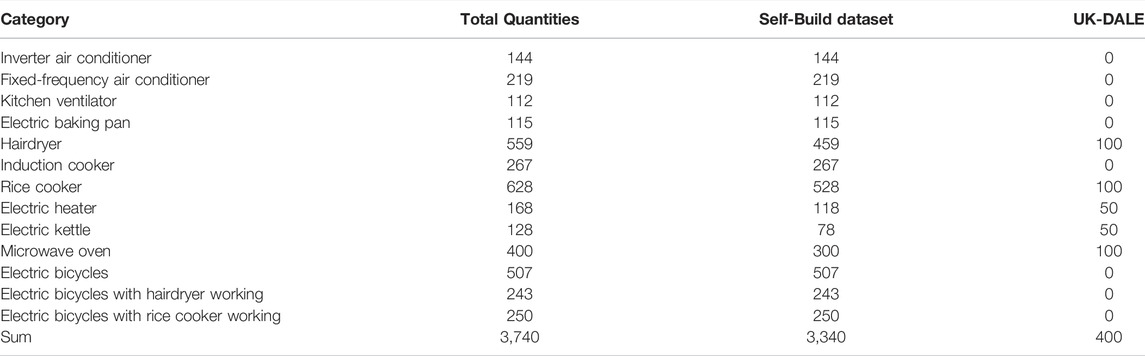
TABLE 2. Details of the self-built dataset.
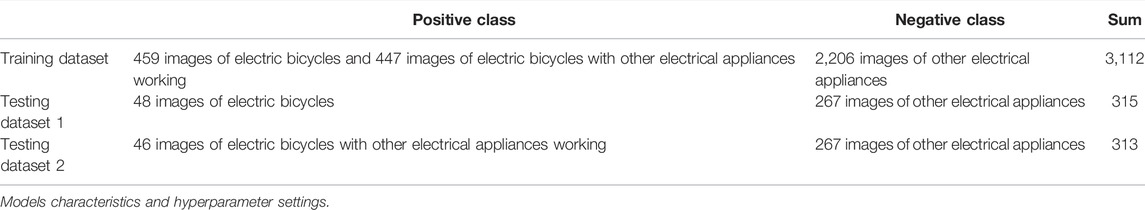
TABLE 3. Division of the self-built dataset.
In this study, the ResNet18, ResNet50, and ViT models are selected as comparative experiments, and Table 4 shows the detailed characteristic of different models. ResNet18 and ResNet50 are deep convolutional neural networks. Compared with other fully connected neural networks, the CNN uses convolutional kernels to greatly reduce the training parameters and has high training efficiency.
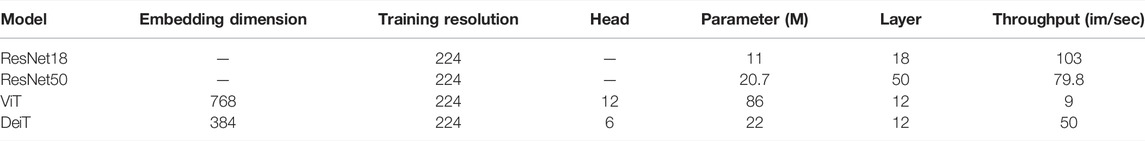
TABLE 4. Characteristic of different models.
It can be concluded from the aforementioned table that DeiT has more model parameters than the CNN but far less than ViT, and the speed of processing images is much faster than that of ViT, while Table 5 shows the training strategy and hyperparameter settings of the model. In addition, two hyper-parameters for DeiT are set as
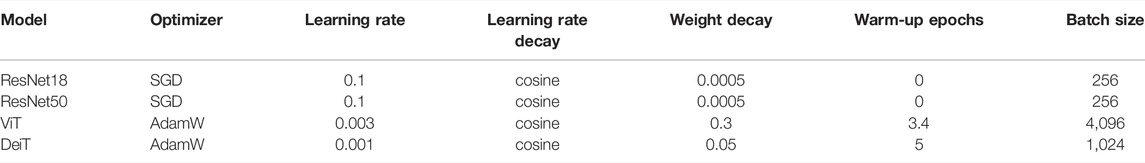
TABLE 5. Training strategy and hyper-parameter settings.
Moreover, the hardware environment of the load identification case study is briefly explained. The cases are executed using a 64-bit computer with NVIDIA Quadro RTX 8000 graphics card, Intel(R) CoreTM i5-7300HQ CPU, and 6G DDR4 memory. Also, Windows 10, Python 3.6, and Keras comprise the software environment in this study.
5.2 Case 1
The first case is executed using the testing dataset 1 in Table 3 to prove the effectiveness of this electric bicycle identification when other appliances are in off-state in one household. The results of case 1 are shown in Table 6. The results show that the DeiT model has an accuracy of 98.41% for the identification of electric bicycles without the interference of other electrical appliances, and the results are almost perfect.
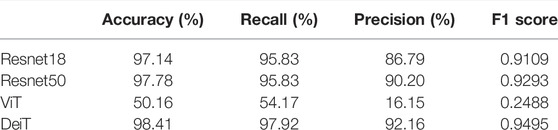
TABLE 6. Results of case 1.
Because the data set is relatively small, the loss function of the ViT model does not converge, the model fails completely, and the final accuracy rate approaches random probability. Compared with the traditional CNN deep learning model, the DeiT model has better performance in all four indicators.
Only focusing on monitoring the electric bicycles, the electric bicycle identification model based on DeiT is a binary classification model, explaining whether the turn-on device is an electric bicycle. It presents advantages in the accuracy of identifying compared with the multiclassification model. Figure 11 shows the accuracy bars of the DeiT classifier model with two to seven classes. Also, it is obvious that the accuracy of electric bicycles is decreasing with the increase in classification types.
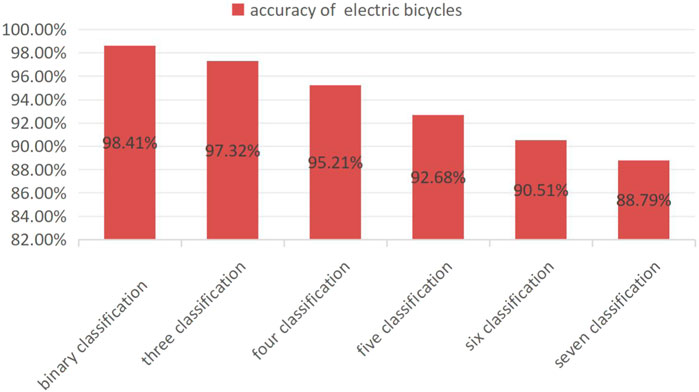
FIGURE 11. Accuracy of electric bicycles under the two to seven classification DeiT model.
5.3 Case 2
The second case is executed using the testing dataset 2 in Table 3 to test the accuracy of the electric bicycle identification model when multiple appliances are working together. The results of the model on testing dataset 2 are shown in Table 7. The results show that the identification accuracy of the DeiT model under the superposition condition reaches 96.17%, which is lower than that of the single condition. The main reason is that the fluctuation of the superposition electrical appliance will still have a certain influence, but it still exceeds 95%, which can meet the requirements of NILM.
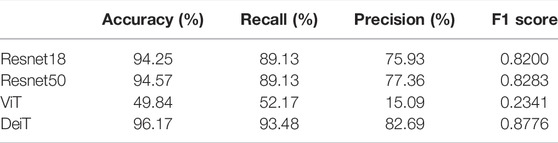
TABLE 7. Results of case 2.
According to the results of case 2, the ViT model still fails completely, and the accuracy of the electric bicycles under the superposition state of other models is generally reduced, but the DeiT model still achieves the best performance, and the four indicators are better than the CNN.
6 Conclusion
This study proposes a new method for identifying and sensing the electric bicycle-based hybrid feature bitmap and DeiT. The main process is divided into three steps. First, adapting the complex superposition work situation, the original V–I trajectory is improved by using the current differences as mapping parameters. The second step is the construction of the hybrid feature bitmap for the V-△I trajectory. Finally, the electric bicycle identification model based on DeiT is established. Tests conducted in two cases have shown that the rate of successful identification is above 95% and strong robustness for handling the impact of the simultaneous working by multi appliances. It is believed that the proposed method makes electric bicycle monitoring more applicable.
Data Availability Statement
The original contributions presented in the study are included in the article/Supplementary Material; further inquiries can be directed to the corresponding author.
Author Contributions
Conceptualization, KF and QH; methodology, KF; software, ZD; validation, KF, HC, and LG; formal analysis, KF, PW, and HX; investigation, YH; resources, HC; data curation, GL; writing—original draft preparation, KF, ZD, and PW; writing—review and editing, KF, QH, PW, and HX; supervision, YH; project administration, QH; All authors have read and agreed to the published version of the manuscript.
Funding
This study received funding from the National Key Research and Development Program of 411 China-Technology Boosts Economy 2020 Key Topic (Grant number 2020YFF0426410) and, the Science and Technology Project of State Grid Jiangsu Electric Power Company (Grant number J2021057). The funder was not involved in the study design, collection, analysis, interpretation of data, the writing of this article, or the decision to submit it for publication. All authors declare no other competing interests.
Conflict of Interest
Authors QH, KF, ZD, HC, and YH are employed by State Grid Jiangsu Electric Power Co., Ltd, LG is the postgraduate student of the School of Automation of Nanjing University of Science and Technology, Author PW is employed by Nanjing University of Science and Technology as an associate professor, and Author HX is employed by Xi'an XD Power Systems Co. Ltd. All authors declare no other competing interests.
The remaining authors declare that the research was conducted in the absence of any commercial or financial relationships that could be construed as a potential conflict of interest.
Publisher’s Note
All claims expressed in this article are solely those of the authors and do not necessarily represent those of their affiliated organizations, or those of the publisher, the editors, and the reviewers. Any product that may be evaluated in this article, or claim that may be made by its manufacturer, is not guaranteed or endorsed by the publisher.
References
Anderson, K. D., Ocneanu, A., Benitez, D., Carlson, D., Rowe, A., and Bergés, M. (2012b). “BLUED: A Fully Labeled Public Dataset for Event-Based Non-intrusive Load Monitoring Research,” in Proceedings of the 2nd KDD Workshop on Data Mining Applications in Sustainability (SustKDD), August 12, 2012 (Beijing, China, 1–5.
Anderson, K., Berges, M., Ocneanu, A., Benitez, D., and Moura, J. (2012a). “Event Detection for Non-intrusive Load Monitoring,” in IECON 2012-38th Annual Conference on IEEE Industrial Electronics Society, October 25–28, 2012 (Montreal, QC), 3312–3317. doi:10.1109/IECON.2012.6389367
Baptista, D., Mostafa, S., Pereira, L., Sousa, L., and Morgado-Dias, F. (2018). Implementation Strategy of Convolution Neural Networks on Field Programmable Gate Arrays for Appliance Classification Using the Voltage and Current (V-I) Trajectory. Energies 11, 2460. doi:10.3390/en11092460
Beckel, C., Kleiminger, W., Cicchetti, R., Staake, T., and Santini, S. (2014). “The Eco Data Set and the Performance of Non-intrusive Load Monitoring Algorithms,” in Proceedings of the 1st ACM International Conference on Embedded Systems for Energy Efficient Buildings (Build Sys 2014), November 3–6, 2014 (Memphis, TN), 80–89. doi:10.1145/2674061.2674064
Berges, M., Goldman, E., Matthews, H. S., Soibelman, L., and Anderson, K. (2011). User-centered Nonintrusive Electricity Load Monitoring for Residential Buildings. J. Comput. Civ. Eng. 25, 471–480. doi:10.1061/(asce)cp.1943-5487.0000108
Bouhouras, A., Gkaidatzis, P., Chatzisavvas, K., Panagiotou, E., Poulakis, N., and Christoforidis, G. (2017). Load Signature Formulation for Non-intrusive Load Monitoring Based on Current Measurements. Energies 10, 538. doi:10.3390/en10040538
Buddhahai, B., Wongseree, W., and Rakkwamsuk, P. (2018). A Non-intrusive Load Monitoring System Using Multi-Label Classification Approach. Sustain. cities Soc. 39, 621–630. doi:10.1016/j.scs.2018.02.002
Chang, H. H., Lee, M. C., and Chen, N. (2015). “Feature Extraction Based Hellinger Distance Algorithm for Non-intrusive Aging Load Identification in Residential Buildings,” in 2015 IEEE Industry Applications Society Annual Meeting, Addison, October 18–22, 2015 (Addison, TX), 1–8. doi:10.1109/IAS.2015.7356778
Chang, H. H., Lian, K. L., and Su, Y. C. (2013). Power-spectrum-based Wavelet Transform for Nonintrusive Demand Monitoring and Load Identification. IEEE Trans. Industry Appl. 50, 2081.
De Baets, L., Dhaene, T., and Deschrijver, D. (2018). “VI-based Appliance Classification Using Aggregated Power Consumption Data,” in 2018 IEEE international conference on smart computing (SMARTCOMP), June 18–20, 2018 (Taormina, Italy), 179–186. doi:10.1109/smartcomp.2018.00089
Dosovitskiy, A., Beyer, L., and Kolesnikov, A. (2020). An Image Is Worth 16x16 Words: Transformers for Image Recognition at Scale. arXiv preprint arXiv:2010.11929.
Fang, K., Huang, Y., and Huang, Q. (2020). “An Event Detection Approach Based on Improved CUSUM Algorithm and Kalman Filter,” in 2020 IEEE 4th Conference on Energy Internet and Energy System Integration (EI2) (Wuhan, China.
Gabaldón, A., Ortiz-García, M., Molina, R., and Valero-Verdú, S. (2014). Disaggregation of the Electric Loads of Small Customers through the Application of the Hilbert Transform. Energy Effic. 7, 711–728. doi:10.1007/s12053-013-9250-6
Gao, J., Giri, S., Kara, E., and Bergés, M. (2014). “PLAID: A Public Dataset of High-Resoultion Electrical Appliance Measurements for Load Identifification Research: Demo Abstract,” in Proceedings of the 1st ACM Conference on Embedded Systems for Energy-Effiffifficient Buildings, November 3–6, 2014 (Memphis, TN), 198–199. doi:10.1145/2674061.2675032
Gao, J., Kara, E. C., and Giri, S. (2015). “A Feasibility Study of Automated Plug-Load Identification from High-Frequency Measurements,” in 2015 IEEE global conference on signal and information processing Orlando,USA.
Hart, G. W. (1992). Nonintrusive Appliance Load Monitoring. Proc. IEEE 80, 1870–1891. doi:10.1109/5.192069
Hassan, T., Javed, F., and Arshad, N. (2013). An Empirical Investigation of VI Trajectory Based Load Signatures for Non-intrusive Load Monitoring. IEEE Trans. Smart Grid 5, 870
Jazizadeh, F., Afzalan, M., Becerik-Gerber, B., and Soibelman, L. (2018). “EMBED: A Dataset for Energy Monitoring through Building Electricity Disaggregation,” in Proceedings of the 9th ACM International Conference on Future Energy Systems (e-Energy ’18), June 12–15, 2018 (Karlsruhe, Germany), 230–235. doi:10.1145/3208903.3208939
Kelly, J., and Knottenbelt, W. (2015b). The uk-dale Dataset, Domestic Appliance-Level Electricity Demand and Whole-House Demand from Five uk Homes. Sci. Data 2, 150007. Article No. 150007. doi:10.1038/sdata.2015.7
Kelly, J., and Knottenbelt, W. (2015a). “Neural Nilm: Deep Neural Networks Applied to Energy Disaggregation,” in Proceedings of the 2nd ACM International Conference on Embedded Systems for Energy-Efficient Built Environments (BuildSys ’15), November 4–5, 2015 (Seoul South Korea), 55–64. doi:10.1145/2821650.2821672
Kolter, J. Z., and Johnson, M. J. (2011). “Redd: a Public Data Set for Energy Disaggregation Research,” in The 1st SustKDD Workshop on Data Mining Applications in Sustainability (San Diego, USA, 1–6.
Le, X. C., Vrigneau, B., and Sentieys, O. (2015). “l1-Norm Minimization Based Algorithm for Non-Intrusive Load Monitoring,” in 2015 IEEE International Conference on Pervasive Computing and Communication Workshops (PerCom Workshops), March 23–27, 2015 (St. Louis, MO), 299–304. doi:10.1109/PERCOMW.2015.7134052
Li, C., Liang, G., and Zhao, H. (2021). A Demand-Side Load Event Detection Algorithm Based on Wide-Deep Neural Networks and Randomized Sparse Backpropagation. Front. Energy Res. 9, 586. doi:10.3389/fenrg.2021.720831
Liu, Y., Liang, Z., and Huang, J. (2022). A Non-intrusive Motor Load Identification Method Based on Load Transient Features. Front. Energy Res. 10, 858–969. doi:10.3389/fenrg.2022.858969
Makonin, S., Ellert, B., Bajić, I. V., and Popowich, F. (2016). Electricity, Water, and Natural Gas Consumption of a Residential House in Canada from 2012 to 2014. Sci. Data 3, 160037–160112. doi:10.1038/sdata.2016.37
Monacchi, A., Egarter, D., Elmenreich, W., D’Alessandro, S., and Tonello, A. M. (2014). “Greend: an Energy Consumption Dataset of Households in Italy and Austria,” in Proceedings of IEEE International Conference on Smart Grid Communications (SmartGridComm), November 3–6, 2014 (Venice, Italy), 511–516. doi:10.1109/smartgridcomm.2014.7007698
Nambi, S. N. A. U., Lua, A. R., and Prasad, R. (2015). “LocED: Location-Aware Energy Disaggregation Framework,” in Proceedings of the 2nd ACM International Conference on Embedded Systems For Energy-Efficient Built Environments (BuildSys ’15), November 4–5, 2015 (Seoul, South Korea, 45–54. doi:10.1145/2821650.2821659
Nguyen, T. K., Dekneuvel, E., Jacquemod, G., Nicolle, B., Zammit, O., and Nguyen, V. C. (2017). Development of a Real-Time Non-intrusive Appliance Load Monitoring System: An Application Level Model. Int. J. Electr. Power . Energy Syst. 90, 168–180. doi:10.1016/j.ijepes.2017.01.012
Ruano, A., Hernandez, A., Ureña, J., Ruano, M., and Garcia, J. (2019). NILM Techniques for Intelligent Home Energy Management and Ambient Assisted Living: A Review. Energies 12, 2203. doi:10.3390/en12112203
Su, D., Shi, Q., Xu, H., and Wang, W. (2019). Nonintrusive Load Monitoring Based on Complementary Features of Spurious Emissions. Electronics 8, 1002. doi:10.3390/electronics8091002
Touvron, H., Cord, M., and Douze, M. (2021). “Training Data-Efficient Image Transformers and Distillation through Attention,” in International Conference on Machine Learning (PMLR), July 18–24, 2021) (Virtual) 139, 10347–10357.
Vaswani, A., Shazeer, N., and Parmar, N. (2017). “Attention Is All You Need,” in 31st Conference on Neural Information Processing Systems (NIPS 2017), December 4–9, 2017 (Long Beach, CA), 6000–6010.
Wang, A. L., Chen, B. X., Wang, C. G., and Hua, D. (2018). Non-intrusive Load Monitoring Algorithm Based on Features of V-I Trajectory. Electr. Power Syst. Res. 157, 134–144. doi:10.1016/j.epsr.2017.12.012
Young, K., Wang, C., Wang, L. Y., and Strunz, K. (2013). “Electric Vehicle Battery Technologies,” in Electric Vehicle Integration into Modern Power Networks (New York, NY: Springer), 15–56. doi:10.1007/978-1-4614-0134-6_2
Keywords: electric bicycle identification, V-I trajectory, hybrid feature bitmap, DeiT model, deep learning
Citation: Huang Q, Fang K, Ding Z, Cheng H, Huang Y, Geng L, Wang P and Xu H (2022) A Non-Intrusive Residential Electric Bicycle Load Monitoring Method Based on Hybrid Feature Bitmap and DeiT. Front. Energy Res. 10:896398. doi: 10.3389/fenrg.2022.896398
Received: 15 March 2022; Accepted: 04 May 2022;
Published: 30 June 2022.
Edited by:
Bo Yang, Kunming University of Science and Technology, ChinaReviewed by:
Gan Zhou, Southeast University, ChinaXueLong Hu, Nanjing University of Posts and Telecommunications, China
Copyright © 2022 Huang, Fang, Ding, Cheng, Huang, Geng, Wang and Xu. This is an open-access article distributed under the terms of the Creative Commons Attribution License (CC BY). The use, distribution or reproduction in other forums is permitted, provided the original author(s) and the copyright owner(s) are credited and that the original publication in this journal is cited, in accordance with accepted academic practice. No use, distribution or reproduction is permitted which does not comply with these terms.
*Correspondence: Kaijie Fang, a2FpamllZmFuZ0AxMjYuY29t